I
I
1878
•IRRIGATION STUDY
I
I
I
K. C. ELECTRIC ASSOCIATION, INC.
I
COLORADO 39 KIT CARSON
I
I
I
I
I
I
I
Prepared by: Floyd 0. Guilliams, KCEAI
Douglas M. Short, P.£., Tri-StateOro F. Wore, KCEA
I
Presented to KCEA Boord of Directors
I
October12~
1978I
I
Approved By:_---=---=~-~---
Oro F. Wore, Manager Page 1
I
I
I
I
I
I
I
I
I
I
I
I
I
I
I
I
I
I
I
I
I
I
I
I
I
I
I
I
I
I
I
I
I
I
I
I
I
I
TABLE OF CONTENTS Title Page Table of Contents List of Figures List of Tables List of Maps Selected References Selected Publications I. NARRATIVESummary and Conclusions Assumptions
A. General
B. Water Resources
C. Irrigation Power Requirements - Historical D. Irrigation Power Requirements - Future E. Diversity - Past and Future
F. Soils and Crops G. Conversions
H. Pumping Plant Efficiencies I. Water Management Practices
J. Load Management Programs K. Electricity and Fossil Fuels L. Electric Power for Irrigation M. Requirements of Regulatory Agencies
N. Economic Aspects of Projected Irrigated AgricultYre 0. Effect of Projected Irrigation Loads on System Rates
and Load Factors II. EXHIBITS
Table A, A-1, A-2, A-3 Table B
Table C Table D
Form 346, Table I Form 346, Table II Form 346, Table III Form 346, Table IV Maps (In Packet)
-2-Page · No. 1 2 3 4 5 6 7 9 14 22 29 41 47 58 60 62 64 65 67 69 89 91 93 94
I
II
I
I
I
I
I
I
I
I
I
I
I
I
I
I
I
I
I
Page 23 24 25 30 34 35 54 74 76 LIST OF FIGURESFigure No. Title 1 Service Area
2 Growth in Consumers 3 Growth in Energy Sa 1 es
4 Colorado Northern High Plains 5 Depth to Water
6 Saturated Thickness and Transmissibility 7 Projected Growth in Irrigation Accounts 8 Power Resources Plan
9 Trends in the Cost of Wholesale Power
-3-I
I
I
I
I
I
I
I
I
I
I
I
I
I
I
I
I
I
I
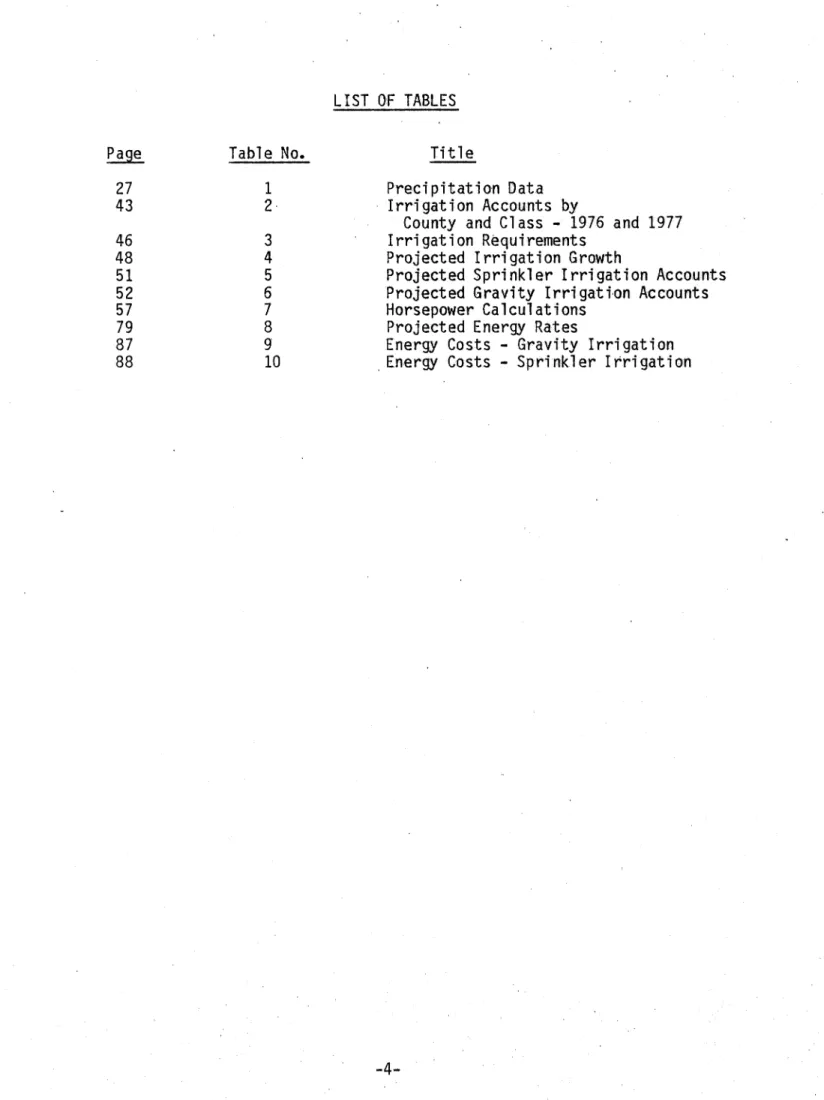
Page 27 43 46 48 51 52 57 79 87 88 LIST OF TABLES Table No. Title1 Preci pi tat ion Data 2 · Irrigation Accounts by
County and Class - 1976 and 1977 3 Irrigation Requirements
4 Projected Irrigation Growth
5 Projected Sprinkler Irrigation Accounts 6 Projected Gravity Irrigati·o.n Accounts 7 Horsepower Calculations
8 Projected Energy Rates
9 Energy Costs - Gravity Irrigation 10 . Energy Costs - Sprinkler I rri gat ion
-4-I
'li
~I
,I
,I
'I
·I
I
I
I'
'I
;I
I
I
I
:1
.I
~1·.
i '..
,
.. ' Map No. 1 2 3 4 LIST OF MAPS Title Service Area Water Resources Irrigation Services Irrigatable Land-5'-I
I
·I
I
I
I
I
I
I
I
I
I
I
I
I
I
I
I
I
K. C. ELECTRIC ASSOCIATION IRRIGATION STUDY REFERENCES Leonard A. Mercer, Water Resource EngineerGround Water Operations, Colorado Division of Water Resources Bruce E. DeBrine, Deputy State Engineer
Ground Water Operations, Colorado Division of Water Resources Verne Batchelder, Supervisor
Division of Markets, Colorado Department of Agriculture Dave Bucknam
Colorado Land Use Commission R. Dennis Anderson
Water Pollution Control Division, Colorado Department of Health Robert A. Longenbaugh, Assistant Professor
Civil Engineering Department, Colorado State University Dale F. Heermann, Agricultural Engineer
Agricultural Research Service, U. S. Department of Agriculture Fred E. Daubert, Chief, Project Planning
Colorado Water Conservation Board R. Ted Hurr, Hydrologist
Water Resource Division, U. S. Geological Survey David L. Carlson, Resource Information Specialist Colorado Department of Agriculture
William C. Fecke, Assistant State Conservationist
Soil Conservation Service, U. S. Department of Agriculture Dwane Konrad, Extension Irrigation Engineer
Colorado State University, Burlington, Colorado Don Miles, Extension Irrigation Engineer
Colroado State University
-6-I
I
I
I
I
I
I
I
I
I
I
I
I
I
I
I
I
I
I
K. C. ELECTRIC ASSOCIATION IRRIGATION STUDY LIST OF PUBLICATIONS Department of Interior, Geological SurveyWater- Supply Paper 1819-I, "Groundwater Development in the High Plains of Colorado".
U. S. Department of Interior, Geological Survey
Water - Supply Paper 1843, "Geology and Groundwater Resources of the Big Sandy Creek Valley, Lincoln, Cheyenne and Kiowa Counties, Colorado." U. S. Department of Interior, Geological Survey
Water - Supply Paper 1779-N, "Geology and Groundwater Resources in Eastern Cheyenne and Kiowa Counties, Colorado."
"Water-Level Records for Colorado, 1971-1975," Colorado Water Resources Basic-Data Release No. 37, Colorado Water Conservation Board.
"Digital Model of the Ogallala Aquifer of the Northern Part of the Northern High Plains of Colorado," Colorado Water Resources Circular Number 24, Colorado Water Conservation Board.
"Hydrogeologic Data for the Northern High Plains of Colorado,"
Colorado Water Resources Basic-Data Release Number 23, Colorado Water Conservation Board.
Norman K. Whittlesey, "Irrigation Development Potential in Colorado," Environmental Resources Center, CSU, Ft. Collins, Colorado, May, 1977. Colorado Agricultural Statistics 1969 through 1975 and Preliminary 1977 data, Colorado Department of Agriculture.
Colorado State Water Plan, Phase I
&
II, Colorado Water Conservation Board.Soil Survey, Yuma and Washington Counties, Colorado,
U. S. Department of Agriculture, Soil Conservation Service.
"Irrigation Guide for Northeast Colorado, South Platte and Republican River Watersheds below 7000 feet," U.S.D.A., March 1960.
"Fuel and Energy Price Forecasts," EPRI (Electric Power Res·earch Institute) prepared by Foster Associates, Inc., Washington D.C., March 1977.
1~75 Power Requirement Study
Tri-State Generation and Transmission Association, Inc.
-7-I
I
I
I
I
I
I
I
I
I
I
I
I
I
I
I
I
I
I
Precipitation Data, 1891 - 1977 Burlington, ColoradoCrop Water Budget - Northern High Plains Colorado State University
"Potential for Irrigated Agriculture" Colorado Land Use Commission
"Evaluation of Irrigation Pumping Plant Efficiencies and Costs in the High Plains of Eastern Colorado"
Colorado State University
Electric Rate Study for K. C. Electric Association by Miner and Miner Consulting Engineers, May, 1978
-8-I
I
I
I
I
I
I
I
I
I
I
I
I
I
I
I
I
I
I
I
I
I
I
I
I
I
I
I
I
I
I
I
I
I
I
I
I
I
K. C. ELECTRIC ASSOCIATION COLORADO 39 KIT CARSON1978 IRRIGATION STUDY SUMMARY AND CONCLUSIONS
In 1977, irrigation represented 56 percent of the total energy requirements of K. C. Electric Association. This trend is expected to continue in th~ future with 62 percent of the total energy requirements in 1992. Irrigation will be the number one priority customer due to the agriculturally-oriented area and irrigation contribution to summer peak demand.
The available water resource, surface and ground, indicated an adequate long-term supply. However, an overdraft condition on the groundwater does exist on the High Plains. With some
recharge, the laws and regulations in effect will serve to slow down the water level declines but not reverse them. The major groundwater source is the Ogallala Formation. This source is under strict control by the Colorado State Engineers Office and other local groundwater groups. The growth in 11new11 irrigation
wells will be severely limited inK. C. service area.
A direct result of these restrictions will be a gradual slowdown in increased acreage of new irrigated farmland.
Sprinkler irrigation growth will be predominate and it is expected that all of the 863 fossil fuel powered irrigation wells would be
-9-I
I
I
I
I
I
I
I
I
I
I
I
I
I
I
I
I
I
I
converted to electric power by 1992. However, this projected growth is based on the assumption that the 230 kV Big Sandy to Burlington line would be constructed and operational. There will also be growth in tailwater type pumps.
Conversion will be a source of new accounts as both fossil fuel to electric conversion and gravity to sprinkler irrigation conversion will be strong in the future.
KCEA will continue with its voluntary load management program. Pumping plant efficiencies are expected to improve
slowly during the term of this study as will irrigation efficiency of gravity irrigation due to the increased use of tailwater pumps.
The source of electric power for KCEA from Tri-State is expected to be reliable and of enough capacity to supply any forseeable demands. However, the cost of these n~w sources of power will-necessitate significant increases in wholesale and retail electric rates.
The key item in this study is and will be the price of farm products in the future. The long-term trend of crop prices will determine if this irrigation study and the entire national
agriculture picture is valid.
The following two graphs compare the number of projected irrigation accounts and irrigation energy sold based on this 1978 · Irrigation Study and the 1975 (latest) Power Requirements Study. The irrigation study predicts a slower rate of growth in
irrigation than the 1975 P.R.S. However, the irrigation study
-10-I
I
I.
I
I
I
I
I
I
I
I
I
I
I
I
I
I
I
I
predicts a larger number of accounts and about the same energy sold as the P.R.S. by 1992. There will be a faster rate of
irrigation growth during the later part of the study period due to the assumption that fossil fuel powered wells will be converted to e 1 ectri c power.
-11-
---I ,..__. N I K.C. ELECTRIC ASSOCIATION COLORADO 39 KIT CARSON2,000 .,__.,..._..,.. _ _ _ _ _ _ _ _ _ _ _ _ _ _ _ _ _ _ ~-~--.,..---....--...--... 1,500 en 1-z ::::)· 8 0
""
~~
ii a: - 1,000 u.. 0 0:: 11.1 ID :E ::::) z 500 . 1,882.IRRIGATION ACCOUNTS iCOMPARI$0N ~ .... ~
~~ !it ....
,
1973 1974 1975 1976 1977 ~....
~..
....
~..
... ~; { I,560I
I I I
d ... .....
,,
;.··
•"
1,
~
~~,,1
~t ... .
~..
~....
I
I ,h ...,.~i__:.__:._~
__
J_.
GJI.i,o\\~it~~1••'''''fl,l93
.
.,.,1 ... ,,,,,
.
'""\•••"'''
,,,,,.~ TI
I
,,,,,,,
I
I
1980 1982 . 'YEAR 1985 1987I
I
I
1992---
-·--K. C. ELECTRIC ASSOCIATIONCOLORADO 39 KIT CARSON
.-:3: I ~ .... :E w ... I Q ..J 0 II)
)-ffi
z w 250 •000I
I I
I I I ·I
I
I I I I I I I I I I I
I
ENERGY SALES COM PAR I SON
, 227,136 200,0001 I I I I I I I I
~-'~
~
~~·,
,W6~
·' ~ .~,
~
0,
~ ...~
.
~
•
••
150,000 ~.
, ~ ...~
~
•• 143,043~'
.
···
r~'''
100,000 , , 127,06.5'
.
···
••••• ••••••• ••••••••,,,,,.
... !50,000 , _ _ _ L I I I IVi
1973 1974 1975 1976 1977 1980 1982 YEAR 1985 1987 1992I
I
I
I
I
I
I
I
I
I
I
I
I
I
I
I
I
I
I
K. C. ELECTRIC ASSOCIATION COLORADO 38 YUMA ASSUMPTIONSSeveral judgement decisions were made in preparing this study. The judgements referred to herein as .. assumptions, .. included the following:
Water Resources
It was assumed that there is adequate water based on
published reports and current· information supplied by the experts, to support the projected growth of KCEA's irrigation accounts. Although there is adequate groundwater, current and future laws and regulations governing this will severely limit growth of 11new11
irrigation wells. Of the growth of irrigation accounts that is projected in this study, the vast majority will be conversions of fossil fuel powered to electric powered. It is assumed that there would be adequate water available to support the continued use of these irrigation wells in the future as the conversions take place. Water of adequate quality currently exists and is assumed to continue in the future.
-14-I
I
I
I
I
I
I
I
I
I
I
I
I
I
I
I
I
I
I
Irrigation Power Requirements - Historical
Based on the 1977 listing of electric powered irrigation accounts by class, it was assumed that fossil fuel powered irrigation was divided in the same portion, 57 percent are sprinkler irrigation and 43 percent are gravity irrigation.
Based on information from the Colorado State Engineers Office on registration of irrigation wells in KCEA's service area and a plotting of electric powered wells served by KCEA, it was assumed that the wells plotted from the registered wells list that did not match up with the plotting of electric powered wells would be fossil fuel powered wells.
It was assumed, based on published information, that gravity irrigation has a 60 percent water efficiency and sprinkler
irrigation has a 80 percent water efficiency.
Due to the lack of pumping plant testing, the average flow of wells and their efficiency was estimated with assistance from Colorado State University personnel.
It was assumed that water requirements for irrigated crops in KCEA's service area would not change in the future.
-15-I
I
I
I
I
I·
I
I
I
I
I
I
I
I
I
I
I
I
I
Irrigation Power Requirement~ - Future
The majority of the growth of irrigation accounts will be due to the complete conversion of 863 fossil fuel powered wells over the 15 year projected period. Howe~er, this projection is based on the assumption that the 230 kV Big Sandy to Burlington line would be constructed and operational.
The other projected growth of irrigation accounts is based on historical trends and information supplied by experts. The growth of new irrigation wells will slow down to two per year due to Colorado State rules and regulations governing groundwater.
It was assumed.that water application efficiency for gravity irrigation would increase from 60 to 65 percent by 1992 due to the increased number of tailwater pumps that would be in use.
It was assumed that each new gravity irrigation represents, on the average, 160 acres and a new center-pivot system
represents, on the average, 125 acres.
Based on the average historical decline of the Ogallala formation, it is expected that for each five-year period there would be a net decline of static water level of five feet. It is assumed that operating pressure for a sprinkler will decline on the average from 50 psi to 45 psi by 1987 and another 5 psi drop by 1992. This is due to the assumption that sprinklers in the future will be low pressure variety. (See Table~·
-16-I
I
I
I
I
I
I
I
I
I·
I
I
I
I
I
I
I
I
I
Based on historical information, the average kWh per horsepower will remain at the five-year average of 1,618.
The predicted growth in the number of irrigation pumps is based on a consensus of opinion of informed staff members of KCEA and the authors. Most of those involved have access to and
knowledge of relevant historical ·data and are in a -position to evaluate general trends and project them into the future. The chief assumption which has been made is that no cataclysmic changes will occur in the field of agricultural economics.
It was assumed that the majority (70%) of the fossil fuel conversions would take place during the later part of the projected period, from 1988 to 1992.
Diversity
The historical diversity was calculated on the assumption that the demand of the system less irrigation was represented by the peak winter demand. The future diversity was calculated based on the modification of the system less irrigation annual load factor to closer reflect historical data.
-17-I
I
I·
I
I
I
I
I
I
I
I
I
I
I
I
I
I
I
I
Soils and Crops
It was assumed that cropping patterns will remain about the same as they have in the past. Also that soil conditions will not change appreciably due to irrigation and that there are good soils for irrigation available to support projected growth.
The crop water requirements will remain the same as the current data for the future.
It 1s assumed that sprinkler irrigated sugar beets will remain in the future at the current level of 4,200 acres. Gravity irrigation of sugar beets will decline as will the other acres of irrigated crops due to gravity to sprinkler irrigation conversion.
Conversions
Based on projected fossil fuel prices, it is assumed that all of the 863 fossil fuel powered wells in KCEA's service area would be converted to electric power by 1992. The majority (70%) to be converted in the last five-year period 1988 to 1992.
However, this assumption is based on the completion of the 230 kV Big Sandy to Burlington line.
Based on historical trends, the conversions of flood
irrigation to sprinkler irrigation will be 10 per year and 15 per year of tailwater pump additions.
-18-I
I
I
I
I
I
I
I
I
I
I
I
I
I
I
I
I
I
I
It is assumed that there will be no electric to fossil fuel conversions.
Pumping Plant Efficiencies
Current and future efficiencies are based on published data and conversations with Colorado State University personnel. It was assumed that there will be a slight improvement of pumping plant efficiencies in the future.
Water Management Practices
It is assumed that the overall average irrigation
efficiencies of applied water would increase slowly in the future as sprinkler irrigation becomes more prevalent. It was assumed that gravity irrigation efficiency would increase due to use of the tailwater pumps.
The current rules and regulations governing new wells in the Ogallala formation in Colorado will be in effect and severely limit new growth of irrigation wells.
-19-I
I
I
I
I
I
I
I
I
I
I
I
I
I
I
I
I
I
I
Load ManagementIt was assumed that Tri-State, the wholesale power supplier of KCEA, would not actively provide direct control of the ultimate user. It was assumed that KCEA current voluntary load management program would be in effect now and in the future. However, the effectiveness of this voluntary load management is not known.
Power Supply
It is assumed that the wholesale power supplier to KCEA, · Tri-State Generation and Transmission Associatio~, Inc., will have the facilities and equipment to supply power for the entire
projected future. The cost of wholesale and retail power will be es_£alating at approximately 8 to 12 percent annuaJly~ Even with the cost of electric power rising. it is assumed that fossil fuels will be higher priced than electric power.
Irrigated Agriculture Economy
No projections or pred.ictions were made as to prices of farm products. It is assumed that irrigated farms will be as strong now as in the future. However, the cost to produce farm products
I
-20-I
I
I
I
I
I
I
I
I
I
I
I
I
I
I
I
I
I
:1
and the price paid to the farmer will determine if irrigated agriculture will be existing in the future.
-21-I
I
I
I
I
I
I
I
I
I
I
I
I
I
I
I
I
I
I
I
I
I
I
I
I
I
I
I
I
I
I
I
I
I
I
I
I
I
K. C. ELECTRIC ASSOCIATION A. GeneralThe area served by K. C. Electric Association, Inc., (KCEA) covers some 4,000 square miles in eastern Colorado. Service is provided in Cheyenne, Kit Carson and a portion of Lincoln
counties. Headquarters of KCEA are in Hugo, Colorado. The service area of KCEA is shown in Figure land Map No.
1,
in the back pocket.KCEA was formed on October 14, 1946, with operations
commencing on September 10, 1948. Today, over 5,000 consumers are served with over 700 as irrigation accounts with 2,540 miles of line. The growth in number of consumers and number of ·irrigation accounts are shown in Figure~· The growth in total energy sales and irrigation energy sales are shown in Fi.gure
l·
KCEA iscertificated by the Public Utilities Commission of the State of Colorado.
Since 1956, KCEA has purchased its power requirements from Tri-State Generation and Transmission Association, Inc., of Thornton, Colorado. Tri-State G
&
T is composed of 25 rural electric associations in northeastern Colorado, Wyoming and western Nebraska, who organized to consolidate their efforts in the area of wholesale power supply. Prior to this time, the members were purchasing power on an individual basis, mostly from-22-I
I
.I
I
I
I
I
I
I
~
I
~
(!)-I
lJ..
I
I
I
I
I
I·
I
I
i
.I
-23,-..
---
FIGURE 2
GROWTH' IN CONSUMERS
K. C. ELECTRIC ASSOCIATION, INC. COLORADO 39 KIT CARSON
5000 5030 .. ,·· (/) . t -4000 N Z ·
-r
530oo
0 ~ lL 0 a: UJ Q:J ~ ~2000 1000IJ--·~-14
,'
14
~,_,.
,,
1950 ,~ .~''
,..,
...
-~--~
...
,.
·'
..
~--_4 -· ...
lOT L 'UMBI R 0 CONSUME S , , . , , . •r,'
-- ... -- -·"·"'- -·"- -- -· - ... ,
1...-~
~~ '
• NO OF IRRII ATI<jN A COU
~TS
__ ,1955 1960 1965 1970 1975
YEAR
-.-
- - - -
.
- .-·-,
~
I
FIGURE 3
GROWT-H IN ENERGY SALES
K. C. ELECTRIC ASSOCIATION, INC. COLORADO 39 KIT CARSON
150
'I'-~
I \
I
\
II
,
125 100 I I 126 :,. I N U1t
I~75
.
')
' '-.- ('...) " 50 25"~
,_-loa ... ,.
.·_..fi/Jr-,'
,.
~J
1 ...-t-
oj.-~-
... "'"·~'J'!,~
!\:."..1 ...
.Ia ... .,. ...
~<--"'
, ...
-,.--I~RIGAtiON IENEitGY· ~LES
j )
1950 1960 1970
YEAR
. ~·
I
I
I
I
I
I
I
I
I
I
I
I
I
I
I
I
~I
I
I
the Bureau of Reclamation's Missouri River Basin Project. Tri-State· was formed when it became apparent that the members could not indefinitely satisfy their power requirements from the Bureau of Reclamation. A master contract between Tri-State and the Bureau is central in this arrangement, with Tri-State then
contracting with the members on an individual basis to meet their total power requirements. Presently, Tri-State is meeting this obligation by both purchasing and generating power.
The principal river in the area, and for Kit Carson County, is the South Fork of the Republican River, which has over a dozen tributaries. These various tributaries are usually intermittent and flow in a southwest to northeast direction, as does the South Fork of the Republican. At the county line between Kit Carson and Cheyenne counties, there is a shift in drainage pattern. The west
I
half of Cheyenne county drains southeasterly into Big Sandy Creek, the east half of Cheyenne County drains easterly into Smoky Hill River. There are no major water storage projects in the area. The topography is generally flat being on the High Plains physiographic unit.
Elevations vary from 5,000 feet to 3,900 feet. The soils in the area range from sandy loam to clay loam and are, in general, suitable for farming and grazing.
The climate of KCEA's area is described as semi-arid with less than 17 inches of annual precipitation, at Burlington, Colorado, most of which comes in the spring and summer, as shown in Table 1. Temperatures vary from over 100°F in summer to as low
-26-I
I
I
TABLE 1K. C. Electric Association
I
Colorado 39 Kit Carson PRECIPITATION DATA·I
(inches)I
1973 1974 1975 1976 1977 87 Year Record Average Year Jan. 0.55 0.24 0.24 0.32 0.17 0.30I
Feb. 0.00 0.24 0.12 0.10 0.00 0.40 Mar.o.oo
0.95 0.28 0.16 1.18 0.78I
Apr. 1.71 0.94 1.01 0.91 1. 70 1.17 May 2.80 0.37 2.77 0.83 3.60 2.52I
Jun. Jul. 1.04 2.04 2.74 0.86 3.41 0.68 0.32 3.81 1.01 1.69 2.62 2.60 Aug. 0.45 2.33 0.8.9 0.42 1.54 2.35I
Sep. 2.32 0.00 0.31 2.96 0.30 1.37 Oct. 0.41 0.65 0.00 0.61 0.30 0.92I
Nov. 0.12 1.06 1.50 0.15 0.06 0.49 Dec. 0.00 0.18 1.03 0.09 0.11 0.46I
Total 12.44 10.56 12.24 10.68 11.66 16.52I
Apr-Sep. 11.36 7.24 9.07 9.25 9.84 13.17I
I
I
I
I
I
-27-I
I
I
I
I
I
I
I
I
I-I
I
I
I
I
I
I
I
I
as -40° in winters. The generally simi-arid climate fo,rces agriculture to rely on irrigation where it is available and feasible, or on dry land farming.
-28-I
I
I
I
I
I
·,I
I
I
'I
I
I
I
I
I
I
I
I
I
B. Water ResourcesThe primary and most prominent source of irrigation water within the service area of KCEA is the groundwater of the Ogallala aquifer of the High Plains. The secondary source is the surface water supplies available through the South Fork of the Republican River, Big Sandy Creek, and Wild Horse Creek.
The Northern High Plains of Colorado covers an area of about 9,500 square miles. All or parts of 11 counties are included and bound by the State Line on the east, the South Platte River on the north, Big Sandy Creek on the west and the Arkansas River on the south, see Figure
i·
This area is part of the Great Plains physiographic province and the High Plains area of Colorado is part of a vast expanse of a single geologic formation, the Ogallala Formation, that extends from South Dakota to Texas,including parts of Colorado, Kansas, Nebraska, New Mexico and Oklahoma. The land surface of this formation varies from
extremely flat plains to stream-dissected ·topography with a few hundred feet of relief.
The Colorado High Plains is an eastward-sloping gently rolling plain, in places cut by streams or covered by loess and dune sand. The dune sand forms a series of low northwest trending . hills with relative flat inter-dune areas. The sand hills cover
an area of approximately 1,240 square miles and are mainly encompassed by an area with Holyoke at the North, the Arikaree River to the South, and western boundary of Yuma County.
-29-I
I
F-IGURE 4
··-I
I
I
.
. .'"
...
41---,---.:---~---r~-=-;;:::u.-~_:_..
I
.
.
~
I
ot:NVt:ll• ~~·I
COLORA~
•I
L
... _ _ _ _ _ _ J:
r
I
. W E L 0~---1
'I
I
.I
ADAMS·-I
I
'I
I
I
~I
I
I
I
•
I
COLORADO -NORTHERN HIGH PLAINS
-.:.30-I
I
I
I
I
I
I
I
I
I
I
I
I
I
I
I
I
I
I
The surface of the High Plains is marked by numerous
undrained depressions, more than 2,000 within the Colorado portion and as many as 20 per square mile in Kit Carson County. These depressions, usually dry except after spring rains, help recharge the aquifer, otherwise drainage trends generally eastward and northeastward. Streams are ephemeral and influent except for the lower reaches of the North and South Forks of the Republican and the Arikaree Rivers, which are effluent near the State Line. With the dune sand of the sand hills being very porous, most of the precipitation percolates downward instead of adding to runoff. Therefore, no definite drainage pattern is established in the sand hill area and creeks like Sandy, Patent, Red Willow Surveyor and Rock, end in the dune sand.
The geology of the High Plains of Colorado consist of the singular Ogallala Formation, of the Pliocene age. A west to east cross-section of the Ogallala is wedgesharp, sloping eastward and ranges in thickness from a few feet on the west near Limon to as much as 400 feet in places riear the State Line. The Ogallala consists of semi-consolidated poorly sorted sand, silt, clay, gravel and caliche, and resistant ledges called mortar beds, composed of sand and gravel cemented with calcium carbonate.
The Ogallala Formation is the major source of water in the area. Small quantities (<20 gpm) sufficient for stock or domestic suppplies, can be obtained from the aquifer almost anywhere. Well yeilds suitable for irrigation are generally available in the
eastern portion of the Ogallala Formation near the State Line.
-31-I
I
I
I
I
I
I
I
I
I
.I
I
I
I
I
·I
I
I
I
The determination of well yields is dependent upon the permeability of the rock and the thickness of the zone of saturation. The ability of an aquifer to transmit water is measured by the coefficient of transmissibility, the amount of water that will flow in a given time under unit hydraulic gradient through a cross-section of unit width extending the full thickness of the aquifer. Based on actual field tests run by the United States Geological Survey (USGS), this coefficient varies widely from 20,000 to 250,000 gpdpf (gallons per day per foot). This wide range of transmissibility is due to variations in grain size, sorting, cementation, compaction, lenticularity and total
saturated thjckness of the aquifer.
Currently, discharge of the Ogallala Formation in Colorado exceeds the recharge by about 580,000 acre-feet annually. Current estimates indicate that the total water in storage in the Colorado· portion of the Northern High Plains is in excess of 70 million acre-feet. The actual amount that could be pumped out by current methods has been estimated at 40 million acre-feet. Most of the 580,000 acre-feet d1scharge can be attributed to the extensive irrigation well pumping. Recharge of the Ogallala Formation is mai.nly by precipitation. The amount of recharge differs from place to place because of difference in the topography,
vegetation, soil and agricultural practices. Permeability of the rock, the depth to water, and the intensity and duration of
precipitation also affects the amount of recharge. In areas
overlain by the sand hills, the Ogallala is more readily recharged
-32-I
I
I
I
I
I
I
I
I
I
I
I
I
I
I
I
I
I
I
and little water runs off. Overall, the sand dunes of the sand hills area provides the greatest overall recharge due to the larger areal extent. Actual recharge figures vary due to local conditions, as explained above. An average annual recharge figure over the entire Colorado Northern High Plains has been estimated at 0.85 inches to 0.50 inches. This translates into an actual water level recharge of 5.67 inches to 3.33 inches based on a storage coefficient of 0.15. This means that a cubic foot of the aquifer releases or takes into storage 15 percent of the total volume. This also relates to water level declines. For example, a subtraction of 1 foot of water in the aquifer will lower the water table by 6.67 feet. The water table declines caused by
pumping o.n the High Plains is very pronounced due to the extremely slow recharge by precipitation and localized drawdown near each well. In winter, when irrigation wells are not pumped, the water does return almost to its pre-pumping level.
Within KCEA's service area is a portion of the most productive section of the Ogallala Formation. As can be seen from Map No. 2 in the back pocket, the northeast portion of KCEA's service area has a very good saturated thickness of aquifer. This is the saturated thickness as of the summer of 1976.
The depth to water in the Ogallala Formation in KCEA's service area varies from less than 50 feet to over 250 feet in
easter~ Cheyenne County as of 1965 as shown in Figure
i·
The transmissibility coefficients and the saturated thickness, as of 1965, are shown in Figure~· The higher the transmissibility the33 33 33 33 33
-K.C. ELECTRIC ASSOCIATION, INC.
Colorado 39 Kit Corson
DEPTH TO WATER
1 0 0
-
r---'-··:::t'
Line of equal depth to water, in I' ~-.r
feet below land surface. lnterv<9~ .-~ ... - ,_.. r.
Is 50 feet -~sr-::--· -···-· · . · ?----r< I w .p. I ;j
-SCALE 1:500 000-10 -= 0 10 20 30 MILES
Mop •nd·lnlormallon by Unlttd Stales Gtoloqlcol Survey 1!!._ 0 10 _ _ _ _ 2_~-~--=---=-~0 KILOMElERS
-5 5-T· 10 11 13 14 15 16
-K. C. ELECTRIC ASSOCIATION, INC.
Colorado 39 Kit Carson
SATURATED THICKNESS AND TRANSMJSSI Bl LITY
EXPLANATION
Tbiclrneos of aaturaled material&, In feet
-I
w
c.n
I
Bas'! rrom lJ I s. Geolo.ical Suryey
stal-! map 1·500.000 series
----50---Une of approximate transmis.~ibility
Da•hed where i-rtferred. Nu.'fflb6r indica.Ua
l1'G'1UJmi•ri.bil~t~. in lhou•r.nd• of gallun• per
do., per foot
.65
Pumping-test l<oeation
Number U calcu.lnf..ed c~f'Jeient qftraumi11ai·
6ilifJI. in f.lu>utuJntb Q/ gn.llm111 per doll pr.r foot
-SCALE 1:500 000 10 0 10 20 30 MilES EL:... C::::...:=E:L:~ 10 0 s:::FI_::r:...:mr:.__ 10 20 30 KilOMEtERS
Mop oncl lnlor..,ollon br Unllod Stolt GtoloQicol Survtr
-KCEA Service -6 7 8 9 10 11 12 ]9• 13 14 15 16 17
·-I
I
I
I
I
I
I
I
I
I
I
I
I
I
I
I
I
I
I
greater the yield from a well. As can be seen from Figure~' the higher values of transmissibility are located in eastern Cheyenne County and around Burlington.
The main competition for water is not from municipal or industrial concerns but from irrigation wells in the same vicinity. Water withdrawn for purposes other than irrigation amount to only 2 to 5 percent of the total amount of water pumped out of the Oga 11 a 1 a. However, the vast amounts of water pumped from adjoining irrigation wells has caused more problems, in regards to competition for water than any other.
Annually, during the winter months, a series of wells
throughout the State of Colorado are analyzed by various Federal, State and Local agencies. The results of the water level records are published by the state with reviews of the current conditions by drainage basin or aquifer. This enables the appropriate
agencies and other interested parties to monitor the state and condition of water sources and the short and long term effects. There are 50 and 332 obs.ervation wells in Cheyenne and Kit Carson counties, respectively, that are monitored by the State .of
Colorado and other agencies.
If a well is allowed to be drilled, Colo.rado well
regulations require a one-half mile spacing between irrigation wells and a maximum water application of 2.5 acre-feet per acre annually. Other items in regards to Colorado water laws and regulation on the High Plains will be discussed in Section!_, Watet Management. A mining situation exists in the Ogallala
-36-I
I
I
I
I
I
I
I
I
I
I
I
I
I
I
I
I
I
I
Formation in KCEA1s area. This water management aspect is
discussed in detail in Section I of this report. The mining or discharge situation will not be reversed in the future. The only alternative will be to reduce the long-term effects of lowering the water tables •
. The Ogallala Formation yeilds large quantities of water to wells. This water is generally of good to excellent quality. Water from the Ogallala is generally of the calcium bicarbonate type and has a dissolved-solids content ranging from 100 to 600 ppm. Calcium and magnesium are the principal constituents
producing hardness, and the water ranges from moderately hard to very hard (100-350 ppm calci urn carbonate). The suitability of water for irrigation is not only dependent upon its Gverall chemical composition but also factors such as soil texture, permeability, drainage, cropping patterns and water and farm management practices. As will be seen in Section[, Soils and Crops, the existing and future soil texture, permeability and drainage are average and above for suitability to irrigation and that the overall farm management has been good for irrigation.
Based on historical analysis of groundwater for the Ogallala and current analysis, the overall quality of water is excellent for irrigation. It has a very low sodium hazard, so it can be used on most soils with little danger of developing harmful levels of exchangeable sodium in the soils. Generally, the ground water has a medium salinity hazard; moderate amounts of leachtng should be satisfactory and crops with a moderate salt tolerance, such as
-37-I
I
I
I
I
I
I
I
I
I
I
I
I
I
I
I
I
I
I
wheat, oats, corn, alfalfa, and most cash crops, can be grown without special salinity control. The boron concentration is low and therefore is not likely to be toxic to plants. As irrigation increases, water quality may deteriorate, because during
irrigation a part of the water and most of the salts return to the. aquifer, and over a period of time the salt concentration of the ground water can increase to a harmful level.
The current system of water quality monitoring by the Colorado Department of Health will be able to forewarn of potential water problems. It is expected that water of good quality for irrigation will be available in the future.
The second source of irrigation water, but very minor, in KCEA's service area is the aluvium deposits of the larger stream valleys.
Alluvium derived locally from the Ogallala formation lies along the valleys and underlies the flood plains of the major stream valleys and some of the smaller creeks. The alluvium in the larger valleys generally consists of moderately to well-sorted sand and gravel containing some silt and clay. The
alluvium of the smaller valleys generally consists of finer grained materials. The greatest thickness of the alluvial
. .
deposits in the main valleys commonly is about 50 feet, whereas that in the smaller valleys probably is less than 20 feet.
The alluvium along the South Fork of the Republican River also is favorable for the development of large-capacity irrigation wells. In places it overlies the lower part of. the Ogallala
-38-I
I
I
I
I
I
I
I
I
I
I
I
I
I
I
I
I
I
I
formation. Yields of 1,000 gpm have been reported for wells that tap both formations.
In all cases of alluvium groundwater, large yields are generally obtainable only where wells tap buried channels which contain the thickest and most permeable water-bearing materials. The exact locations can only be determined through extensive exploration.
Surface water flow from these streams is very minor with a few farmers and irrigation companies utilizing surface water flow during the irrigation season. The water quality of the alluvium and surface water of streams is comparable to the Ogallala
formation, as the Ogallala is the main source of water to the streams in the area.
A very minor area for ground water irrigation is the valleys of Big Sandy Creek, Rush Creek and Wild Horse Creek, which are in the southwest portion of KCEA service area. These valleys are topographically lower than the surrounding terrain. Thus their valley-fill deposits usually contain water because they collect runoff or ground water draining from the dune sand or upland deposits. Saturated thickness may range from a few inches near the edge to about 20 feet near the center of the larger
tributaries. Finer grain size and poorer sorting of these deposits relative to the valley fill in the Big Sandy Creek and Rush Creek valleys result in lower permeability. The maximum will yeild in the tributary valleys is estimated to be 200 gpm, which
is probably possible only in the lower end of Big Spring Creek and
-39-I
I
I
I
I
I
I
I
I
I
I
I
I
I
I
I
I
I
I
Wild Horse Creek valleys, where the saturated section is thickest and permeabiltiy is highest. In the other tributary valleys maximum yield of wells is about 50 gpm, and average yield is 5 to 10 gpm.
Due to low groundwater yields and unsuitable soils and topography, this area will not be a major area for current or future irrigation development. KCEA currently serves approximately 10 electric powered pumps and there are approximately 25 fossil fuel powered wells in this area.
-40-I
I
I
I
I
I
I
I
I
I
I
I
I
I
I
I
I
-I
I
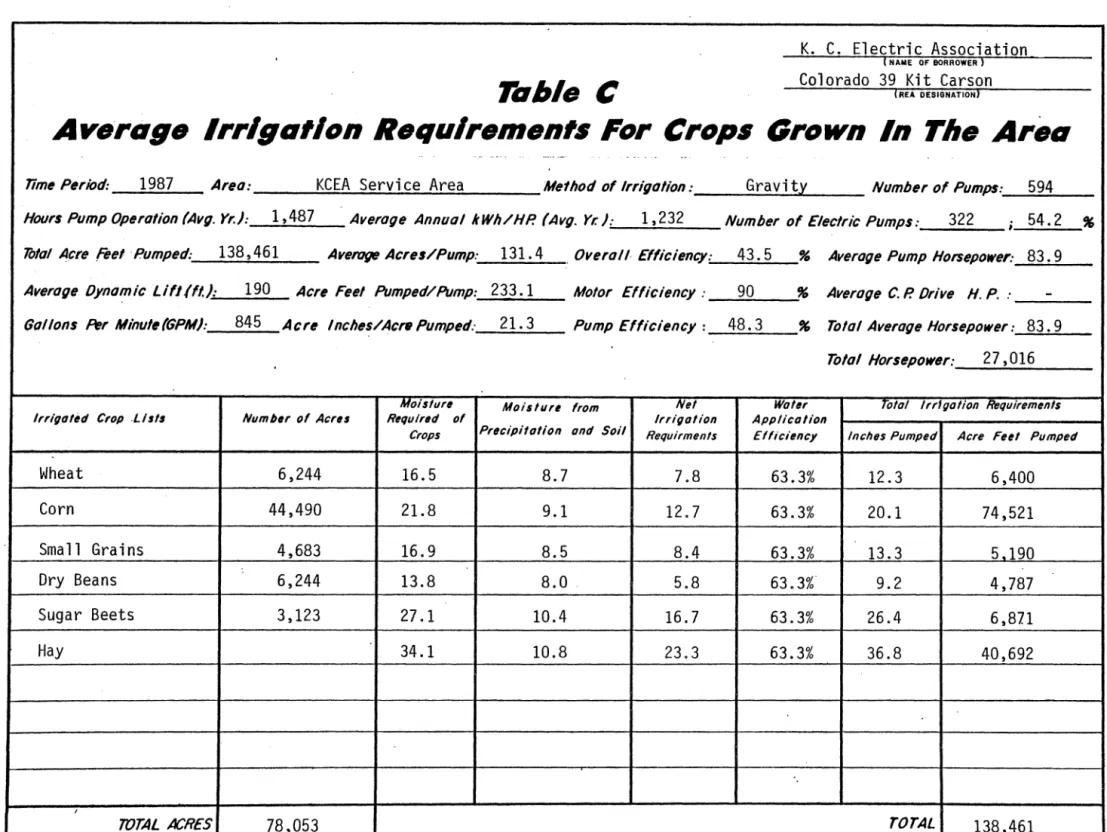
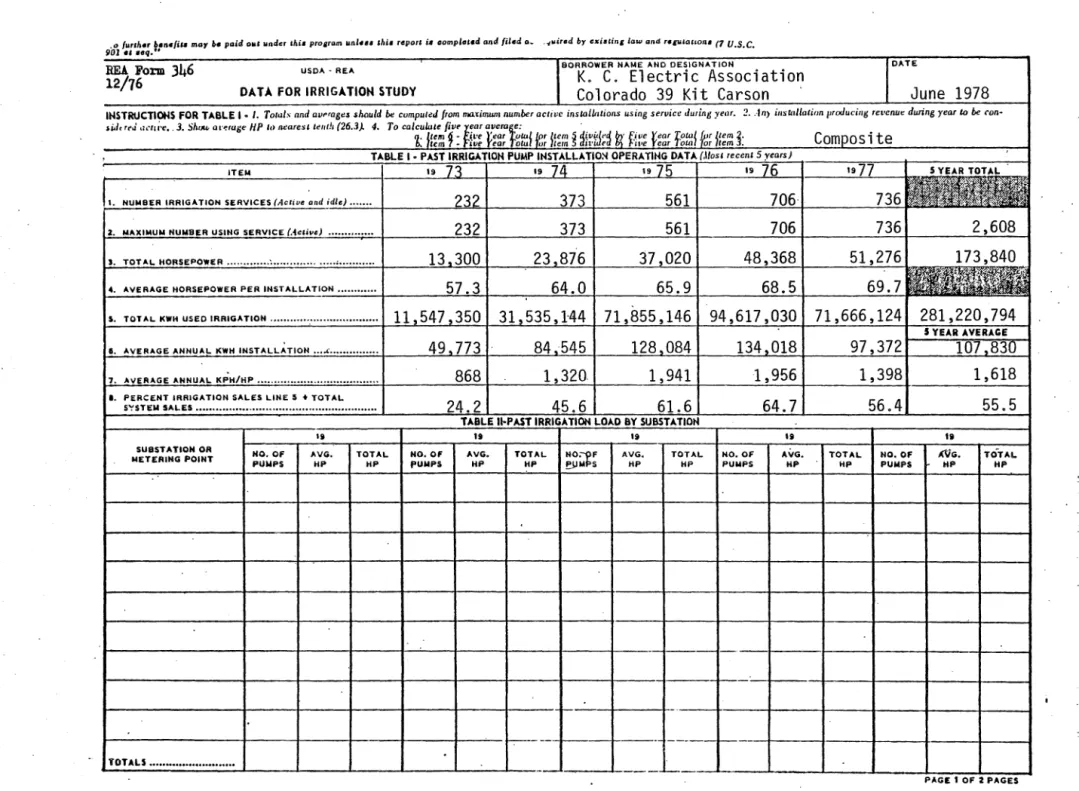
C. Irrigation Power Requirements - Historical
The historical power requirements for all irrigation
accounts in KCEA•s area are shown in Composite Table l of REA Form 346 at the end of this report in the tab section. During the four-year period from 1973 to 1977, 504 new irrigation services were connected. The total connected horsepower increased over 40 percent annually from 13,300 to 51,276 HP. However, the average horsepower per installation has only slightly increased from 57.3 in 1973 to 69.7 in 1977. The total kWh and kWh per horsepower has steadly increased over this period but with a noticable change in 1976 (see Figure~- This was due to below average precipitation
in 1976 which caused greater use of groundwater for irrigation and, therefore, electric power. In 1977 the energy usage declined due to above normal precipitation, .(see Table l). It is
interesting to note that irrigation sales to the total system sales has increased from 24 percent to over 50 percent. This is also shown dramatically in Figure£. In Composite Table l, REA Form 346, there are no idle irrigation accounts, therefore line 1 and line 2 are identical.
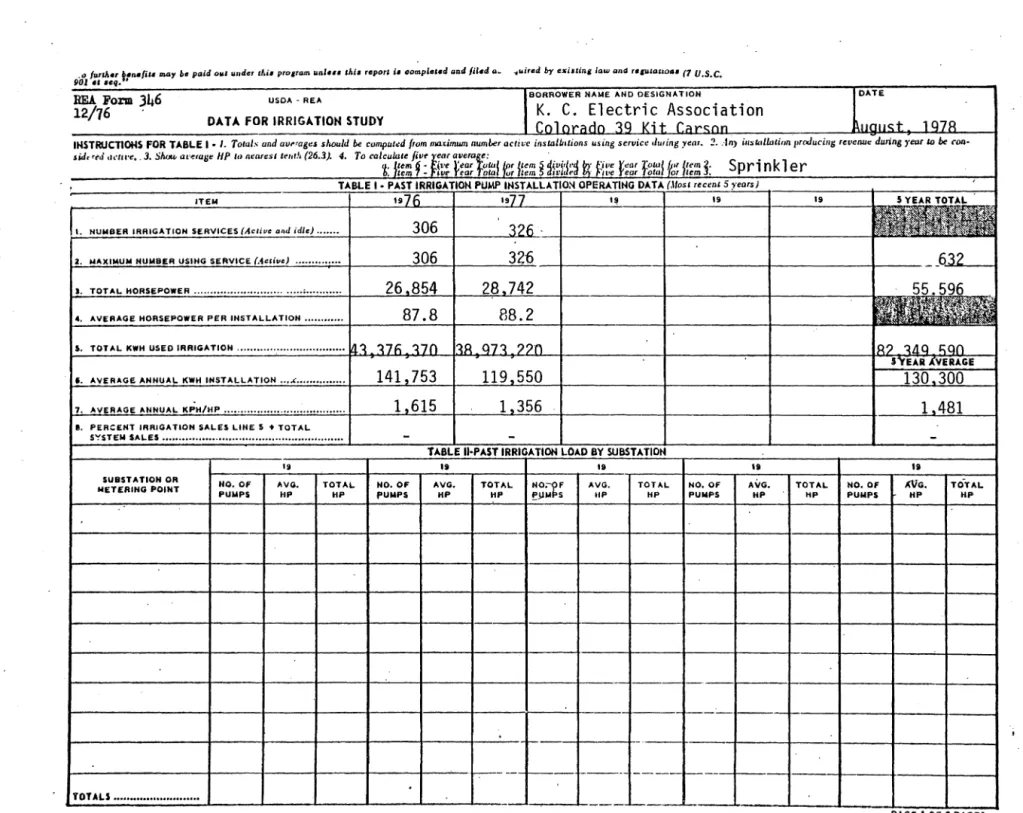
REA Form 346, Table lis tabulated for all irrigation
accounts (Composite). REA Form 346, Table lis also tabulated for 1976 and 1977 only for sprinkler, gravity, and tailwater accounts. Data is available only for these two years. REA Form 346, Table
ll,
shows the breakdown of all irrigation accounts by county (Composite). REA Form 346, Table II is also tabulated for 1976-41-I
I
I
I
I
I
I
I·
I
I
I
I
I
I
I
I
I
I
I
and 1977 only for sprinkler, gravity and tai lwater accounts by county. Data is available only for these two years. Table 2 shows the tabulation of total irrigation accounts by irrigation methods and county for 1976 and 1977.
The location of all the electric irrigation services served by KCEA have been plotted and are shown in Map No.
1,
in the back pocket. Also shown in the map is the irrigation services that were added in 1977. This map also shows the best availableaccounting of fossil 'fuel powered irrigation wells. The location of the fossil fuel powered wells on Map No.
1
was based onregistered irrigation wells by the Colorado State Engineers
Office. Well locations that did not match known electric services were assumed to be fossil fuel powered.
The topic of fossil fuel powered wells is discussed in detail in Sections ~and~ of this report.
The water efficiency of flood or gravity irrigation in the KCEA service area is depe.ndent upon crop, type of i rri gat ion method, soils, slope of land, and water application. Based on irrigation manuals, the minimum efficiency for flood or gravity is about 50 percent. The average· overall efficiency for flood and gravity irrigation in KCEA's service area is slightly higher, at approximately 60 percent.
The water efficiency of sprinkler irrigation is also
dependent upon crop, type of sprinkler irrigation method, soils, slope of land, and water application. Based on irrigation manuals
-42-I
I
I
I.
I
I
I
I
I
I
I
I
I
I
I
I
I
I
I
TABLE 2 K. C. Electric Association Colorado 39 Kit CarsonIRRIGATION ACCOUNT BY COUNTY AND CLASS - 1976 and 1977 1977
Flood Irrigation Sprinkler Irrigation Tailwater DeeQ Wells DeeQ Wells PumQ Cheyenne County 54 66 12
Kit Carson County 197 256 147
Lin co 1 n County 0 4 0
Total Class Accounts 251 326 159 1976
Flood Irrigation Sprinkler Irrigation Tail water DeeQ Wells DeeQ Wells PumQ Cheyenne County 51 64 12
Kit Carson County 190 238 147
Li nco 1 n County 0 4 0
Total Class Accounts 241 306 159
-43-Total County Accounts 132 600 4 736 Total County Accounts 127 575 4 706
I
I
I'
I
I.
I
I
I
I
I
I
I
I
I·
I
I
I
I
I
for this area, the average overall efficiency for sprinkler irrigation is 80 percent.
Nationally, ~here have been trends in reuse systems for flood or gravity irrigation. These systems recycle excess runoff water from a field and return it to the start of the field
irrigation. This system can imporve average efficiencies up to 75 percent. The extent of such systems in the KCEA area is
significant, with some 159 tailwater pumps on account in 1977. With the increase in center-pivot sprinkler systems, an added benefit has been increased water application efficiencies. The most direct benefit from center-pivot systems has been the labor savings.
In the past few years, KCEA has become acutely aware of the problem of low pump efficiency. Although KCEA has no in-house efficiency testing program, it does encourage consumers to have this done. At present, consumer interest in pump testing has been light. This is discussed in detail in Section ~of this report.
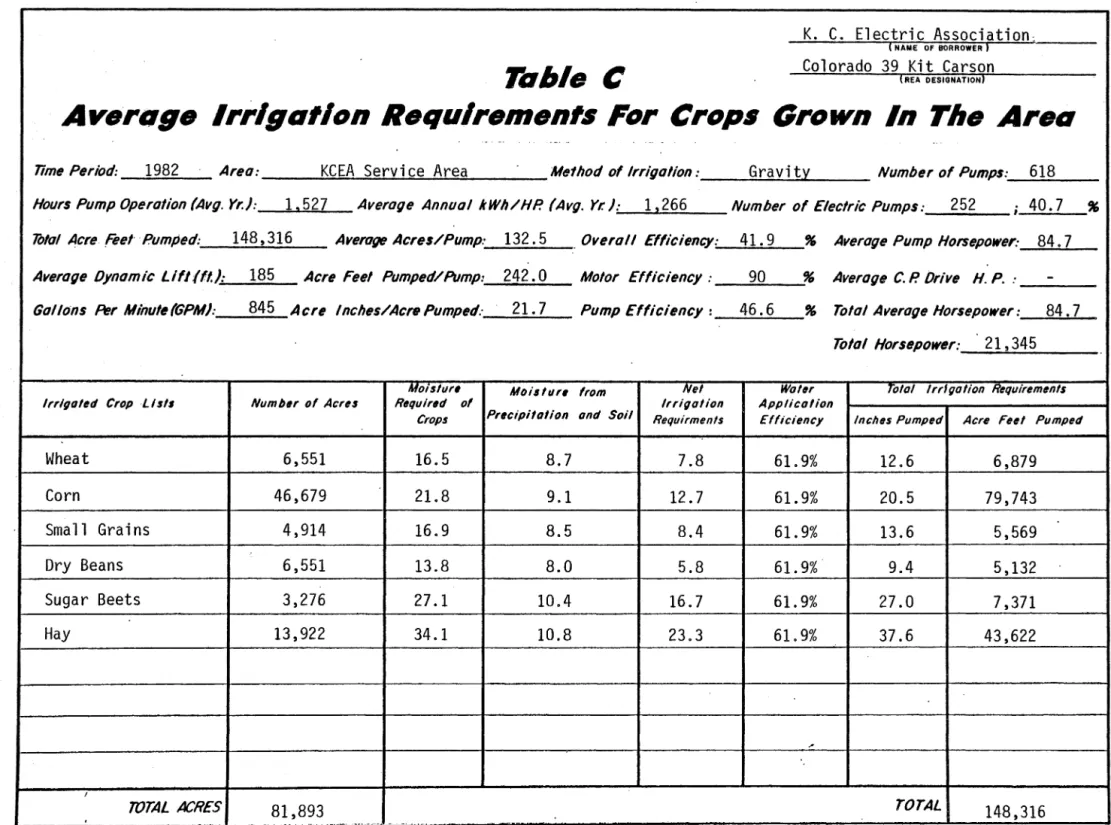
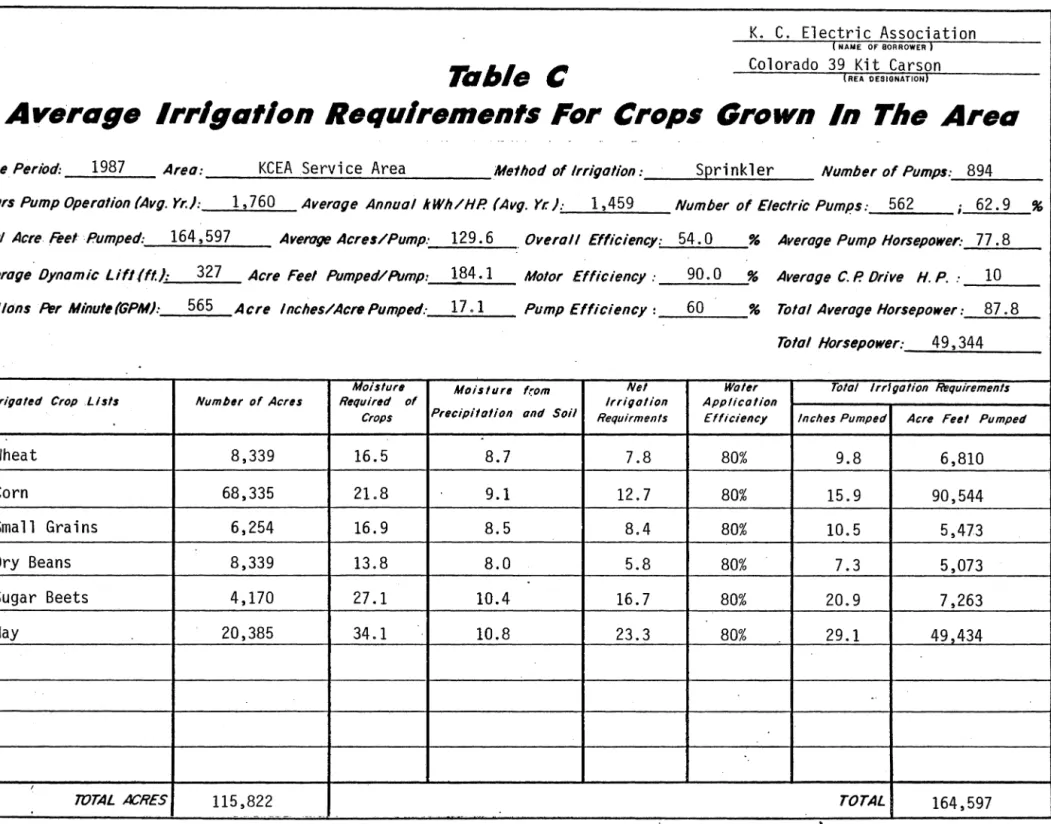
Due to the lack of pumping plant testing, the averge flow pumped for sprinkler and gravity irrigation are not known and have been estimated on Tables
£,
in the tab section.Historical irrigated cropland in Kit Carson County has generally i·ncreased during the past few years but with wide
fluctuations from 110,400 acres in 1971 to 141,500 acres in 1975. Irrigated cropland in Cheyenne County has been fairly constant fluctuating between 32,500 and 19,900 acres. Cropping patterns are .discussed in detail in Section F of this report.
-44-I
I
I
I.
I
I
I
I
I
I
I
I
I
I
I
I
I
I
I
Based o.n preliminary data supplied by the USDA Colorado Crop and Livestock Reporting Service on 1977 irrigated cropland for Kit Carson and Cheyenne counties was 161,800 acres and 27,250 acres, respectively. KCEA serves only 400 acres of irrigated crop land in Lincoln County.
Based on historical data presented in Table
£,
anddiscounting tailwater pumps, KCEA's area has 57 percent sprinkler accounts and 43 percent gravity accounts.
The water requirements for the irrigated crops is based on information supplied by the local extension agents. Table 3 shows the total water requirements of the crops, the effective
precipitation and net irrigati.on requirement for average
precipitation years. The effective precipitation is variable and dependent upon the crop during the April to September growing season.
-45-I
I
I
I
I
'I
I
I
I
'I
I
I
I
I
I
I,
'I
I
I
Cro~ Corn Alfalfa Sugar Beets Wheat Dry Beans Small Grains TABLE 3 K. C. Electric Association Colorado 39 Kit Carson IRRIGATION REQUIREMENTS(AverageYear)
Total Water Water Received Required During Precipitation {Inches} {Inches} 21.8 9.1 34.1 10.8 27.1 10.4 16.5 8.7 13.8 8.0 16.9 8.5 Net Irrigation Requirements (1) {Inches} 12.7 23.3 16.7 7.8 5.8 8.4 (1) The gross irrigation requirement would be the net irrigation
requirement divided by the water application efficiency.
-46-I
I
I
I
I
I
I
I
I
I
I
I
I
I
I
I
I
I
I
D. Irrigation Power Requirements - Future
The future potential for increased irrigation acreage is directly dependent upon adequate supplies of water, both ground and surface. In KCEA's ~rea, the growth of irrigated acreage will be a minimum due to the water laws and regulations restricting irrigation developing. During the 15 year period to 1992 only 58 new irrigation wells are expected. The State of Colorado, in order to minimize the decline of the water available from the Ogallala formation, will be severely limiting new irrigation wells in KCEA's service area.
The growth that has been projected in REA Form 346, Table
l!
and following Table!, is mainly from the conversion of 863 fossil fuel powered wells to electric power, with the remaining growth in tailwater pumps.It is anticipated that the new well growth will begin to slow down within the first five year period with a maximum of 2 per year from 1982 to the end of the projected period, as shown in Table 4.
The conversion of fossil fuel to electric will start out slowly with approximately 10 per year through 1982. The second five-year period will see a larger portion of the conversions with 209. The last five-year period will see the remaining 70 percent on 604 converted. As noted in Section ~of this report, the conversion of all these fossil fuel powered wells is dependent upon completion of the Big Sandy to Burlington 230 kV transmission
-47--
..
-'
- -
'-
-TABLE 4
K. C. Electric Association, Inc. Colorado 39 Kit Carson PROJECTED IRRIGATION GROWTH
Fossil Fuel Total Gravity to New to Electric Tail water Annual Irrigation Sprinkler Year Wells Conversion PumQS Growth Accounts Conversion {1)
1977
-
-
-
-
736 1978 13 10 15 38 774 5 I +::> 1979 11 10 15 36 810 5 00 I 1980 7 10 15 32 842 5 1981 5 10 ·15 30 872 5 1982 2 10 15 27 899 5 1987 (2) 10 209 75-
1193 25 1992 (2) 10 604 75-
1882 25(1) There will be 5 conversions per year from floor irrigation to sprinkler irrigation with no increase of total accounts or increase in connected horsepower.
I
,I
I·
I
I
I
I
I
I
I
I
I
I
I
I
I
I
I
I
line. If the line completion is delayed further this will delay the number of conversions and time frame as outlined in Table 4.
There will also be 5 conversions per year of gravity to sprinkler irrigation. However, this will not alter the connected horsepower or number of irrigation accounts.
Overa 11, during the fifteen-year projected peri ad, the
connected horsepower will increase 154 percent from 51,276 H.P. in 1977 to 130,207 H.P. in 1992. The total irrigation accounts will increase 156 percent.
Due to the complete absence of any type of flow meter to measure the flow from wells in this· area and the lack of pumping plant efficiency testing, the actual or average flow from wells were estimated.
The water application efficiency of sprinklers are expected to remain the same during the projected years at about 80 percent. However, increased water application efficiency of gravity is expected to increase to 65 percent by 1992 from 60 percent in 1977. Currently, there are 326 sprinkler and 251 flood accounts served by KCEA. Of the 251 flood accounts, 75 will be converted to sprinkler operation during the projection period. Of the 58 new wells that will be served by KCEA, 10 percent or 6 will be gravity irrigation, the remaining 90 percent or 52 will be
sprinkler irrigation. Of the 863 fossil fuel powered wells, it is assumed that 55 percent of them or 475 are sprinkler irrjgation and the remaining 45 percent or 388 are gravity irrigation.
-49-I
.I
I
I
I
I
I
I
I
I
I
I
I
I
I
I
I
I
I
It is expected that the fossil fuel powered irrigation wells that are sprinkler irrigation will convert to sprinkler
irrigation, electric powered. Similarly, fossil fuel powered irrigation wells that are gravity irrigation will convert to gravity irrigation, electric powered. However, the authors of this study believe that there will be some conversions of fossil fuel powered gravity irrigation to electric powered sprinkler irrigation. In that no historical data or trend is available to KCEA to evaluate this unique double conversion, it is assumed that this type of conversion is included in the five per year
conversion of gravity to sprinkler, electric powered, irrigation. Tables .?_and §..show the estimated projection of irrigation well accounts only by irrigation method and the conversions associated with each irrigation method projection.
As mentioned, of the 863 fossil fuel powered wells, 475 are sprinklers (55 percent), as can be seen in Table.?.. in 1977. Table
i
shows that during the first five-year period there have been 50 of these conversions. Therefore, 55 percent or 28 of these will be sprinklers that will convert to electric power, as can be seen in Table.?_. Also during the same time period there would be 34 new sprinkler accounts and 25 flood to sprinkler conversions. Similarly, the second five-year period, 1982 to 1987 there would be a total of 209 fossil fuel conversions, with 55 per~ent or 115 to be sprinklers, as .shown in Table 5. During this same five-year period there would be 9 new sprinkler accounts and 25 flood to sprinkler conversions. The last five-year period, as shown in-50-I
I
I
I
I
I
I
I
I·
I
I,
I
I
I
I
I
I
1.·
I
Year 1977 1982 1987 1992 TABLE 5 K. C. Electric Association Colorado 39 Kit CarsonPROJECTED SPRINKLER IRRIGATION ACCOUNTS Total Number
of Pumps
801
=
475 Fossil Fuel Pumps New Accounts·+
Fossil Fuel to Electric Conversion Flood to Sprinkler Conversion 860 = 447 Fossil Fuel Pumps . +
New Accounts
Fossil Fuel to Electric Conversion Flood to Sprinkier Conversion 894 = 332 Fossil Fuel Pumps +
New Accounts
Fossil Fuel to Electric Conversion Flood to Sprinkler Conversion 928 = 0 Fossil Fuel Fuel Pumps
-51-Number of Electric Powered Pumps + + + + + + + + + 326 34 28 25 413 9 115 25 562 9 332 25 928
I
I
I
I
I
I
I
I
.I
.1·
I
I
I
I
I
I
I
I
I
Year 1977 1982 1987 1992 TABLE 6 K. C. Electric Association Colorado 39 Kit CarsonPROJECTED GRAVITY IRRIGATION ACCOUNTS Total Number
of Pumps
639
=
388 Fossil Fuel Pumps New Accounts+
Fossil Fuel to Electric Conversion Flood to Sprinkler Conversion 618
=
366 Fossil Fuel Pumps +New Accounts
Fossil Fuel to Electric Conversion Flood to Sprinkelr Conversion 594
=
272 Fossil Fuel Pumps +New Accounts
Fossil Fuel to Electric Conversion Flood to Sprinkler Conversion 570
=
0 Fossil Fuel Pumps +-52-Number of Electric Powered Pumps 251 + 4 + 22 25 252 + 1 + 94 25 322 + 1 + 272 25 570