VTI rapport 547A Published 2006
www.vti.se/publications
The traffic safety situation among foreign born in
Sweden
Based on eight road user population zones
Susanne Gustafsson Torbjörn Falkmer
Publisher: Publication: 547A Published: 2006 Project code: 12550 Dnr: 2005/0301-22
SE-581 95 Linköping Sweden Project:
PhD studies
Author: Sponsor:
Susanne Gustafsson and Torbjörn Falkmer VTI (Swedish National Road and Transport Research Institute)
Title:
The traffic safety situation among foreign born in Sweden – based on eight road user population zones
Abstract (background, aim, method, result) max 200 words:
Road traffic crashes are identified as a world wide public health problem. Prognoses by WHO suggest these crashes to constitute the third most common reason for fatalities and disabilities in 2020. However, the crash risk varies from country to country. Previous research concerning foreign born within the Swedish road transport system shows an overrepresentation of crash involvement for this group.
In order to identify the nature of the problem and to be able to compare crash involvement among foreign born with native born, the aim of the study was to cluster countries world wide into road user population zones, depending on Gross National Income (GNI), motorization, the traffic safety situation and geo-graphical position for each country. Based on the eight identified clustered zones, comparisons of the zones and possible correlations between the different parameters were made, using Sweden (native born) as reference country.
Data from several registers showed that an increase in GNI correlated with more cars and fewer traffic fatalities. For a number of zones, nearly all of them less wealthy, an increase in GNI correlated with more cars, and the more cars, the lower the number of killed road users per car. Furthermore, among foreign born, the average relative crash risk was 50% higher for males and about 10% for females compared to native born in the Swedish road transport system. If the subgroup of crash involved car drivers 18 years and older was selected for analyses, data revealed that male foreign born ran double the risk of being involved in a crash, while for female foreign born the relative risk was increased by 70%.
Keywords:
road traffic crashes, foreign born, crash risk, gross national income, motorization, worldwide, geography
Utgivare: Publikation: 547A Utgivningsår: 2006 Projektnummer: 12550 Dnr: 2005/0301-22 581 95 Linköping Projektnamn: Doktorandstudier Författare: Uppdragsgivare:
Susanne Gustafsson och Torbjörn Falkmer VTI
Titel:
Trafiksäkerhetssituationen bland utlandsfödda invånare i Sverige utifrån åtta trafikantzoner
Referat (bakgrund, syfte, metod, resultat) max 200 ord:
Trafikkrascher har pekats ut som ett stort folkhälsoproblem och kommer enligt WHO:s prognoser att år 2020 vara den tredje vanligaste anledningen till skador och dödsfall i världen. Risken varierar dock mellan länderna. Tidigare forskning har visat att utlandsfödda i det svenska vägtransportsystemet är överrepresenterade vad gäller kraschinblandning.
För att göra det möjligt att närmare studera och jämföra kraschinblandning bland utlandsfödda och svenskfödda har världens länder grupperats till åtta olika zoner. Grupperingen av dessa zoner baseras på inkomstmåttet GNI (Gross National Income), grad av motorisering i populationen samt trafiksäker-hetssituation och geografiskt läge. I rapporten presenteras korrelationer mellan inkomst, motoriserings-grad samt två olika trafiksäkerhetsmått i de olika zonerna. De två trafiksäkerhetsmåtten är dödade trafikanter per population och dödade trafikanter per personbil. Sammanställda data för samtliga länder visade att ökad inkomst korrelerade med fler bilar per person och med färre dödade i trafiken. För ett flertal fattigare zoner fanns en korrelation mellan ökad inkomst och ökat antal bilar. Vidare kunde konstateras att ju fler bilar i dessa zoner desto färre dödade per fordon.
Bland de utlandsfödda i det svenska vägtrafiksystemet uppvisade männen en förhöjd relativ kraschin-blandning med 50 % medan motsvarande siffra för utlandsfödda kvinnor var drygt 10 % jämfört med svenskfödda. Om enbart kraschinblandade personbilsförare 18 år och äldre relaterades till körkorts-innehavare, hade utlandsfödda män en fördubblad risk jämfört med svenskfödda män. Utlandsfödda kvinnliga personbilsförare hade en förhöjd relativ kraschinblandning med ca 70 %.
Preface
The present study has been conducted to create a basis for several forthcoming studies about the road user situation for foreign born in the Swedish traffic environment. The authors are Susanne Gustafsson and Torbjörn Falkmer. Susanne Gustafsson is statistician and researcher at VTI in studies about mobility and traffic safety among foreign born in Sweden. Torbjörn Falkmer is Associate Professor & Senior Lecturer in Disability Science at INR, Rehabilitation Medicine, Linköpings universitet and has contributed with a substantial content to this report.
We have throughout this report, for simplicity, chosen to refer to people born in foreign countries but registered as Swedish citizens, as “foreign born”, and Swedish citizens born in Sweden, as ”native born”.
We would like to thank our contact persons Jonas Jonsson and Inger Forslund at the Swedish National Board of Statistics (SCB), who provided this study with compiled data. Thank you also Markus Thyberg, Gorillo Illustration & Medieproduktion, Stockholm, who illustrated all maps in the report.
Linköping May 2006
Susanne Gustafsson Project leader
Quality control review process
The report has been reviewed in a seminar by PhD candidate Linda Kronqvist, IDA Linköpings universitet and scientifically approved by Heléna Svensson, PhD, VV-konsult, as part of a PhD course in Traffic Medicine (20p) given at the Umeå
University, as part of the quality review control process. This seminar was held April 7th 2006 and the final adjusted version was approved May 12th 2006. Research Director Fridtjof Thomas, VTI, has reviewed the report and approved it for publishing September 19th 2006.
Kvalitetsgranskning
Denna rapport har granskats på ett seminarium av doktorand Linda Kronqvist, IDA, Linköpings universitet och vetenskapligt godkänts av Fil Doktor Heléna Svensson, VV-konsult, som en del i en forskarutbildningskurs i Trafikmedicin (20p) vid Umeå
universitet. Seminariet hölls 2006-04-07 och slutlig justering godkändes 2006-05-12. Forskningschef Fridtjof Thomas, VTI, har därefter granskat och godkänt rapporten för publicering 2006-09-19.
Contents
Sammanfattning ... 5
Summary ... 5
1 Background... 9
2 Aim of the study ... 12
3 Material and Methods ... 13
4 Construction of the zones ... 15
4.1 All zones ... 15 4.2 Zone 1... 20 4.3 Zone 2... 22 4.4 Zone 3... 24 4.5 Zone 4... 27 4.6 Zone 5... 30 4.7 Zone 6... 32 4.8 Zone 7... 34 4.9 Zone 8... 36
5 Background data for the foreign born in Sweden... 38
5.1 Sex distribution ... 39
5.2 Age distribution ... 39
5.3 Time in Sweden ... 40
6 Crash involvement among foreign and native born in Sweden ... 41
7 Discussion ... 44
8 References ... 49
The traffic safety situation among foreign born in Sweden – based on eight road user population zones
by Susanne Gustafsson and Torbjörn Falkmer*
VTI (Swedish National Road and Transport Research Institute) SE-581 95 Linköping Sweden
Summary
Road traffic crashes are identified as a world wide public health problem. Prognoses by WHO suggest these crashes to constitute the third most common reason for fatalities and disabilities in 2020. However, the crash risk varies from country to country. Previous research concerning foreign born within the Swedish road transport system shows an overrepresentation of crash involvement for this group.
In order to identify the nature of the problem and to be able to compare crash
involvement among foreign born with native born, the aim of the study was to cluster countries world wide into road user population zones, depending on Gross National Income (GNI), motorization, the traffic safety situation and geographical position for each country. Based on the eight identified clustered zones, comparisons of the zones and possible correlations between the different parameters were made, using Sweden (native born) as reference country.
Data from several registers showed that an increase in GNI correlated with more cars and fewer traffic fatalities. For a number of zones, nearly all of them less wealthy, an increase in GNI correlated with more cars, and the more cars, the lower the number of killed road users per car. Furthermore, among foreign born, the average relative crash risk was 50% higher for males and about 10 % for females compared to native born in the Swedish road transport system. If the subgroup of crash involved car drivers 18 years and older was selected for analyses, data revealed that male foreign born ran double the risk of being involved in a crash, while for female foreign born the relative risk was increased by 70%.
*
Trafiksäkerhetssituationen bland utlandsfödda invånare i Sverige utifrån åtta trafikantzoner
av Susanne Gustafsson and Torbjörn Falkmer* VTI
581 95 Linköping
Sammanfattning
Trafikkrascher har pekats ut som ett stort folkhälsoproblem och kommer enligt WHO:s prognoser att år 2020 vara den tredje vanligaste anledningen till skador och dödsfall i världen. Risken varierar dock mellan länderna. Tidigare forskning har visat att utlands-födda i det svenska vägtransportsystemet är överrepresenterade vad gäller kraschin-blandning.
För att göra det möjligt att närmare studera och jämföra kraschinblandning bland utlandsfödda och svenskfödda har världens länder grupperats till åtta olika zoner. Grupperingen av dessa zoner baseras på inkomstmåttet GNI (Gorss National Income), grad av motorisering i populationen samt trafiksäkerhetssituation och geografiskt läge. I rapporten presenteras korrelationer mellan inkomst, motoriseringsgrad samt två olika trafiksäkerhetsmått i de olika zonerna. De två trafiksäkerhetsmåtten är dödade
trafikanter per population och dödade trafikanter per personbil. Sammanställda data för samtliga länder visade att ökad inkomst korrelerade med fler bilar per person och med färre dödade i trafiken. För ett flertal fattigare zoner fanns en korrelation mellan ökad inkomst och ökat antal bilar. Vidare kunde konstateras att ju fler bilar i dessa zoner desto färre dödade per fordon.
Bland de utlandsfödda i det svenska vägtrafiksystemet uppvisade männen en förhöjd relativ kraschinblandning med 50 % medan motsvarande siffra för utlandsfödda kvinnor var drygt 10 % jämfört med svenskfödda. Om enbart kraschinblandade personbils-förare 18 år och äldre relaterades till körkortsinnehavare, hade utlandsfödda män en fördubblad risk jämfört med svenskfödda män. Utlandsfödda kvinnliga personbils-förare hade en förhöjd relativ kraschinblandning med ca 70 %.
*
1 Background
Road traffic crashes are identified as one of the major public health problems world wide, leading to more than 1.2 million people killed in road crashes and 50 million injured annually (WHO, 2004). Furthermore, WHO estimates that road traffic injuries will constitute the third most common reason for fatalities and disabilities in 2020. The Swedish parliament voted in favour of the goal for the national transportation policies in 1996, namely to ensure a nation wide cost-effective and durable
transportation for all citizens and the industry. Six sub goals were formulated: • An accessible transport system
• A transport system based on equity
• A transport system positive for regional development • A transport system of high quality
• An environmentally friendly transport system • A safe transport system.
The long term goal for the safe transport system sub goal was also formulated as the “Vision Zero” (SNRA, 1996), stating that no one should be killed or seriously injured in the road transport system. Furthermore, it stated that the road transport system should be designed to fit this goal.
Sweden is a multi cultural country, with a growing population of immigrants, i.e. people born in foreign countries but registered as Swedish citizens, hereafter called “foreign born”. By the end of 2004, 12.2% of Sweden’s 9,011,392 inhabitants were foreign born (SCB, 2006), immigrating from approximately 200 different countries to Sweden. They have the same need from the road transportation system to support work, studies, leisure and shopping travelling, as anybody else in Sweden. These transports will partly be done with the use of cars, apart from by public transport, by bicycles or by foot. Research concerning foreign born within the Swedish road transport system has
previously been conducted, pointing at an over representation of crash involvement for this group. However, with respect to exposure data, neither vehicle age, nor annual kilometres driven differ between foreign born and native born (Lewin, Gustafsson & Nyberg, 2006). A study by Eriksson (1998) showed that the share of foreign born increases and that over the period of 1987–1996, 4.6% of the foreign born were involved in at least one crash, whereas the corresponding figure for Swedish citizens born in Sweden, hereafter called ”native born” was 3.4%. Moreover, the share of crash involvement was shown to be higher among those immigrating prior to 1991, who at that point in time simply converted their driving licenses into a Swedish license without any other procedures attached to it, compared to those taking their driver education in Sweden. These findings concerning crash involvement were also shown in a pilot study by Yahya (2001).
In the Yahya pilot study concerning foreign born’s traffic safety situation, registers on emigrant countries, clustered into eight nationality groups, traffic crashes and license holding were compared (Yahya, 2001). The results showed great differences between these groups and one group consisting of native born with respect to traffic safety. The risk of being involved in a crash in the different groups varied with a factor of 2.7, and
even more if women and men were separated in the analyses, the latter group being the most risky.
In 1999, a survey on foreign born’s attitudes and knowledge about traffic safety, based on questionnaires and interviews, was conducted (Forward, Kos-Dienes & Obrenovic, 2000). Questions about seat belt usage, child safety restraints, speed, vulnerable road users, traffic information and the differences between the emigrant countries and Sweden were included. The study showed, for example, that safety belt and child safety restraint usage in city traffic were reduced. Moreover, traffic information to a lesser extent reached foreign born. However, the foreign born stated to be more negative towards speeding than others.
Moreover, an analysis of road crash fatalities in southern Sweden during the years 1997–2003 showed that foreign born, more often than native born, were unbelted (Vägverket, 2005). On the other hand, road crash fatalities among foreign born were less related to alcohol or drugs than among native born.
Child safety restraints usage in road crash fatalities 1992–1997, among children was investigated, with respect also to emigrant nationality (Wenäll, 2001). The results were unclear, but pointed towards an over representation of drivers of the cars involved in the crashes that were foreign born. However, several of these drivers were tourists,
confounding the figures. Nevertheless, misuse of child safety restraint was the most common problem found and was considered to have caused one third of the fatalities. A questionnaire distributed in western Sweden showed that forward facing children in child safety restraints among children 1–2 years old was more common among foreign born parents (Anund, Sörensen & Yahya, 1999). Gustafsson, Anund, Sörensen & Vogel (2003) confirmed these findings in a literature review on social economic backgrounds and non-usage or misuse of child safety restraints. Following that, a national
questionnaire survey showed that children 9 months–3 years old travelled unrestrained to a higher degree among foreign born than among native born (Anund, Forsman, Gustafsson & Sörensen, 2003).
Foreign born road users are obviously not a homogeneous subset, and for that reason, any analyses should be done with a differentiation with respect to foreign born’s native country, in order to explore whether or not this has an implication on their traffic safety situation in Sweden. Several confounding factors are involved in any such analyses, for example, individual preferences in travelling, socio economical factors and attitudes towards safety. Nevertheless, analyses on group level could gain extensive and useful information, for example with respect to sex, age and native countries in traffic safety analyses. Analyses on native countries need, however, some clustering into larger road user population zones, due to the fact that almost 200 different countries are emigrant countries in Swedish immigration, as mentioned earlier.
Such clustering has previously been done by Eriksson (1998) and Yahya (2001), but in slightly different manners, ending up in nine different road user zones, one of these zones being Sweden. Eriksson, on the one hand, chose to cluster from geographic position and killed per population, indicating that countries clustered together had more
To summarize; previous research have shown that the conditions for the foreign born in the Swedish road traffic system are different than for the native born. However,
knowledge about any relationship between demographic data, traffic safety measure-ments and native countries remains unknown. Furthermore, the way to measure traffic related demographic data varies and needs to be defined.
From a public health perspective, it cannot be accepted that people get killed and injured in the traffic system. In order to improve any mitigation strategies, analyses on group level of clustered native countries, with respect to traffic safety issues, should be performed, thus enabling fine tuned and highly differentiated interventions to be launched.
2
Aim of the study
The aim of the study was to present data for foreign born in Sweden and their involve-ment in police reported crashes with personal injuries. Serving as references, compara-tive data for nacompara-tive born were used.
In order to support this aim, clustering of countries world wide into road user population zones, depending on e.g. motorization and the traffic safety situation in each country was necessary. Based on this clustering, this study also aimed to compare the zones and to analyse possible correlations between the different parameters used for the clustering, namely:
• Gross national income (GNI) • Cars per population
• Road traffic fatalities per population • Road traffic fatalities per car.
3 Material
and
Methods
A SCB database, comprising of several different national registers, run by the Swedish National Board of Statistics has provided this study with compiled data, in which all foreign born Swedish citizens were registered. By December 31st 2003, this data base comprised 1,077,596 persons emigrating from approximately 200 different countries. A database comprising of the same amount of Swedish born citizens was used in order to compare data.
Initially, based on the Gross national income (GNI), Cars per population, Road traffic fatalities per population, Road traffic fatalities per car for each country, a cluster analysis was made using the SPSS 13.0 statistical programme, in order to identify possible zones based on these data. The cluster analysis provided almost 20 clusters on the lowest level of rescaled distance and on the next level; it could not include all
countries. Hence, this purely statistically based cluster analysis approach was useless for the aim of the present study. Another strategy was thus adopted, including four steps. Based on the included countries’:
1. socio-economical situation (i.e. wealth, religion, language) 2. geography (i.e. global positioning and continent belonging) 3. previous clustering made by Eriksson (1998) and Yahya (2001) a starting point for the clustering was made.
The aim for this first step was to cluster the large immigrant groups in Sweden into different road user population zones.
Secondly, data on these countries’ Gross National Income (GNI) were collected
according to the Atlas method (The World Bank, 2006). GNI is the sum of value added by all resident producers, plus any product taxes (less subsidies) not included in the valuation of output, plus net receipts of primary income (compensation of employees and property income) from abroad. Data are in current U.S. dollars, converted from countries’ respective national currencies using the Atlas method, which uses a three-year average of exchange rates to smooth effects of transitory exchange rate fluctua-tions. The World Bank favours the Atlas method for comparing the relative size of economies and uses it to classify countries in low, middle and high-income categories and to set lending eligibilities in order to reduce short-term fluctuations in country classification.
The World Bank further clustered income groups within the economies according to GNI per capita, calculated by the Atlas method (The World Bank, 2006). By 2004, the groups were:
• low income, $825 or less
• lower middle income, $826–$3,255 • upper middle income, $3,256–$10,065 • high income, $10,066 or more.
Thirdly, the degree of motorization was used. Motorization in the present study was defined as the number of cars (i.e. “passenger cars”) per population, based on data from the IRTAD (International Road Traffic and Accident Data) data base, set up within the
Organisation for Economic Co-operation and Development – OECD (IRTAD, 2006). Data for the year 2003 were primarily collected. For countries outside of OECD, data from International Road Federation, IRF, 2004 edition of the World Road Statistics, comprising data for 1998–2002, was used (IRF, 2004).
Fourthly, data that reflect traffic safety have also been collected from these sources. Parameters include road traffic fatalities per population (also labelled as “killed road users”, and “deaths in road accidents”, respectively), and road traffic fatalities per car. Yet another parameter was available, namely killed road users per vehicle kilometres, providing the best exposure denominator for determining traffic safety. However, only a few countries could provide these figures, leaving the authors no choice to include it. For certain countries their continent belongings were not all that obvious, e.g. Turkey, which has its most landareal in Asia, but is appealing for membership in the EU. Other countries, e.g. Japan, New Zealand and Australia, have a much better traffic situation according to the analysed parametres than their neighbouring countries. Hence, these countries were clustered according primarily to their GNI status rather than to their geographical position. Others, e.g. Israel, Malta, Spain and Italy were clustered primarily according to their geographical position rather than their GNI status.
Not all countries could provide measurement data and these countries were clustred as initially described above, leading basically to a clustering with their neighbouring countries.
The definitions used for retrieving the data from the two sources in the present study could vary somewhat between the included countries. For example, IRTAD uses ”passenger cars and station wagons” while IRF only include ”passenger cars”. Also the definition of road traffic related fatalities varies between countries. For example, in OECD countries, a fatality within 30 days after a crash is considered to be related to it, whereas in other countries this is not the official way to define this parameter. As population figures, all data from IRTAD (with one or two exceptions) are from 2003, while population data from IRF could be dated any year from 1998–2002. However, if data from several years were available, the most recent annual data were chosen,. For several countries figures were missing, as shown in the complete list in Appendix 1, table 1–8.
The different parameters, for the entire material, as well as for each of the road user population zones, were compared and analysed with respect to correlation between them, utilising Pearson’s product moment correlation coefficient test, using the SPSS 13.0 statistical programme. The overall, α-level was set to 0.05. The partial significance requirements for the six partial correlations levels in each road user population zone, were adjusted with the Bonferroni correction (Altman, 1991). Bonferroni correction is used to determine partial significance levels, αp, from an overall significance level, αo, and a number of partial significance levels, c, with the following relation: αp = αo / c. With αo = 0.05 and c = 6, the partial significance level requirement for each correlation were calculated as αp = (0.05/6) meaning that p should be <0.0083 to be considered as significant.
4
Construction of the zones
In this chapter, the results from the different measurements of classification are shown for the zones respectively, and for the whole world as an introduction. These measure-ments are Gross National Income (GNI), degree of motorization and two different measurements of traffic safety, namely killed road users per population and killed road users per passenger car. In Appendix 1, a complete list of all countries with foreign born present in Sweden at the end of 2003, in addition to data from these measurements is shown. Some of these countries do not exist today, but were countries when the citizens were born. As also seen in Appendix 1, several countries lacked data of the type used in the present study.
4.1 All
zones
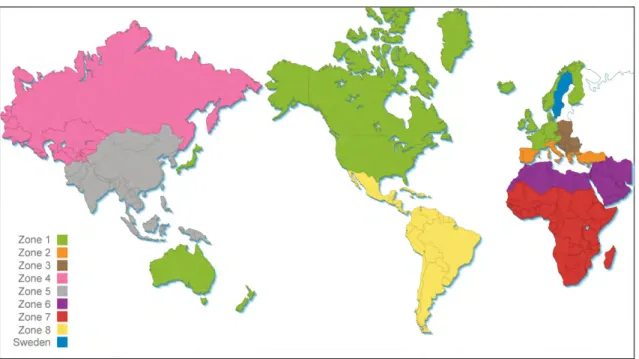
In Figure 1, a map of the world is shown with the different countries/zones marked in different colours. Sweden is a zone by itself and is not included in the correlations presented further on.
Figure 1 The world classified into zones. Graphic design: Markus Thyberg.
In total, 205 countries have been classified into different zones as a result of the
analyses of geography, Gross National Income per capita (GNI), degree of motorization (cars per population) and traffic safety measurement data (killed road users per
population and killed road users per passenger car).
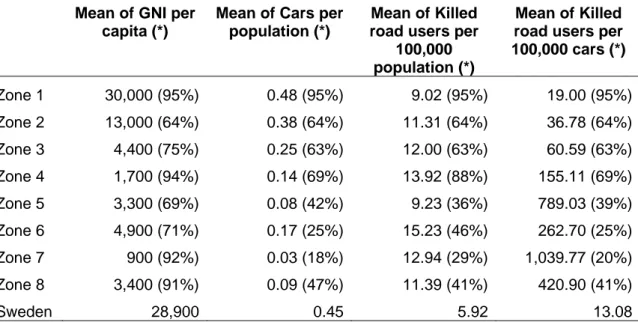
Data were, however, lacking in many countries; GNI was presented in 171 countries, cars per population in 92 countries, killed road users per 100,000 population in 101 countries and killed road users per 100,000 passenger cars in 90 countries. This meant that for the correlations made, 86–96 countries were included in the different analyses, depending on what specific type of data that were used, as shown in Appendix 2. In Table 1, a summary of mean values and percentage coverage of data for each zone and Sweden are presented.
Table 1 Summary of mean values and percentage coverage of data for each zone and Sweden.
Mean of GNI per capita (*)
Mean of Cars per population (*)
Mean of Killed road users per
100,000 population (*)
Mean of Killed road users per 100,000 cars (*) Zone 1 30,000 (95%) 0.48 (95%) 9.02 (95%) 19.00 (95%) Zone 2 13,000 (64%) 0.38 (64%) 11.31 (64%) 36.78 (64%) Zone 3 4,400 (75%) 0.25 (63%) 12.00 (63%) 60.59 (63%) Zone 4 1,700 (94%) 0.14 (69%) 13.92 (88%) 155.11 (69%) Zone 5 3,300 (69%) 0.08 (42%) 9.23 (36%) 789.03 (39%) Zone 6 4,900 (71%) 0.17 (25%) 15.23 (46%) 262.70 (25%) Zone 7 900 (92%) 0.03 (18%) 12.94 (29%) 1,039.77 (20%) Zone 8 3,400 (91%) 0.09 (47%) 11.39 (41%) 420.90 (41%) Sweden 28,900 0.45 5.92 13.08
(*) share of countries within the zones providing data
As shown in Table 1, data from several zones were missing. For zone 2 and 3, approxi-mately two thirds of all data were available. For zone 5–8, less than half of all data concerning cars and killed road users per population and per cars were missing. In some zones, e.g. zone 6 and 7, the availability was poor.
Further scrutinizing Table 1 reveals that zone 1 had the highest income, motorization and the lowest killed road users both per population and per cars among the eight zones. Sweden, being the reference country, shows the lowest figures for mean of killed road users per 100,000 population and per cars. Zone 7 had the lowest income, motorization and the highest killed road users per cars. The highest figure of killed per population was found in zone 6
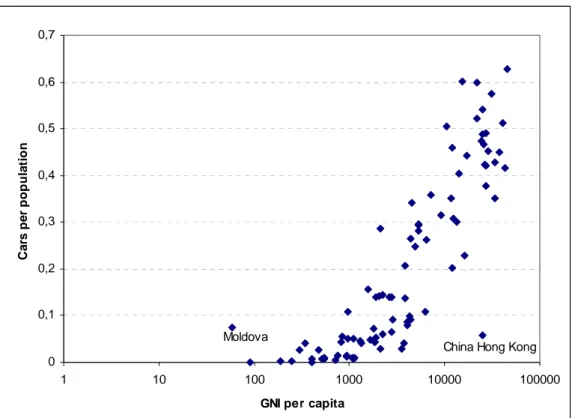
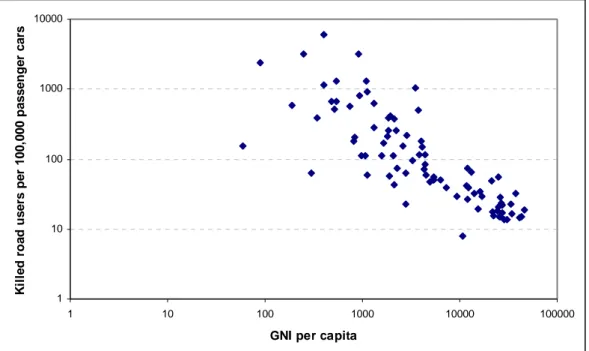
Correlations between the available data for all countries showed to be significant between GNI per capita and cars per population, r = 0.82 (p<0.0001), GNI per capita and killed road users per 100,000 passenger cars, r = -0.31 (p=0.004) and cars per population and killed road users per 100,000 passenger cars, r = -0.41 (p<0.0001). Figure 2, Figure 3 and Figure 4 plot the correlation between these measurements.
Moldova
China Hong Kong 0 0,1 0,2 0,3 0,4 0,5 0,6 0,7 1 10 100 1000 10000 100000
GNI per capita
C a rs p e r po pu la ti on
Figure 2 Correlation between GNI per capita and cars per population, all countries. Note the logarithmic scale on the x-axis. n=89.
As shown in Figure 2, there was a strong correlation between GNI per capita and cars per capita, the higher income in a country, the more cars. However, there were outliers, e.g. China Hong Kong which was a high income country with few cars per population or Moldova which is a low income country with about 0.07 cars per capita.
1 10 100 1000 10000 1 10 100 1000 10000 100000
GNI per capita
K ille d r o a d u s e rs p e r 1 0 0 ,0 0 0 p a s s e n g e r c a rs
Figure 3 Correlation between GNI per capita and killed road users per 100,000 passenger cars. Note the logarithmic scale on the x and y-axis. n=87.
The correlation between GNI per capita and killed road users per 100,000 passenger cars was negative, as shown in Figure 3. This indicates that a higher income in a country leads to fewer fatalities per car. This is quite reasonable according to the data presented in Figure 2. In more wealthy countries, not only the number of cars per person increase but also, most likely, the quality of cars and road infrastructure.
1 10 100 1000 10000 0 0,1 0,2 0,3 0,4 0,5 0,6 0,7
Cars per population
K il le d r o a d u se rs p e r 10 0, 00 0 p a ss en g er ca rs
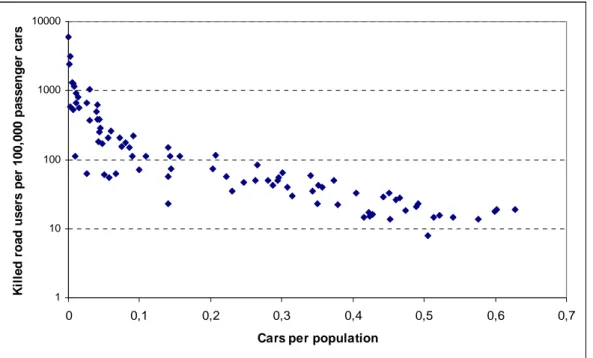
Figure 4 Correlations between cars per population and killed road users per 100,000 passenger cars. Note the logarithmic scale on the y-axis. n=86.
As shown in Figure 4 there was negative correlation between cars per population and killed road users per 100,000 passenger cars, indicating that the more cars, the fewer killed per car. Also this statement connects to the notion that in more wealthy countries, not only the number of cars per person increase but also, most likely, the quality of cars and road infrastructure. When this development takes place, the increase in cars will be followed by fewer killed in each car.
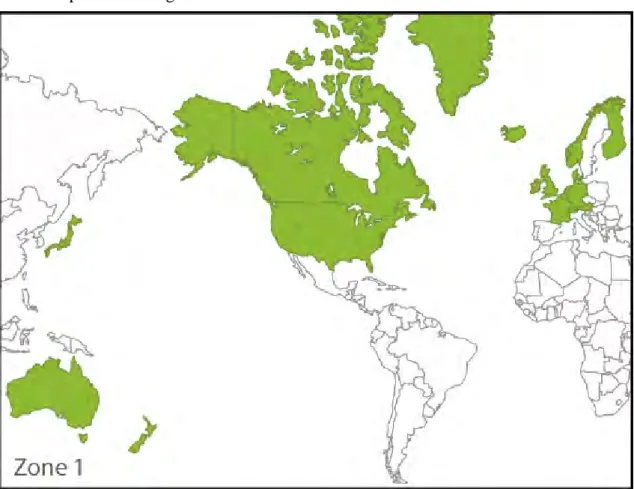
4.2 Zone
1
Zone 1 is pictured in Figure 5.
Figure 5 Zone 1. Graphic design: Markus Thyberg.
This zone comprised of 19 countries and data from these measurements were missing from Lichtenstein. Mean of Gross National Income was about 30,000 US$ (sd. 7,900) in zone 1. There were, on average, almost 0.48 (sd. 0.07) passenger cars per population, 9.02 (sd. 2.52) killed road users per 100,000 population and 19.00 (sd. 5.22) killed road users per 100,000 passenger cars.
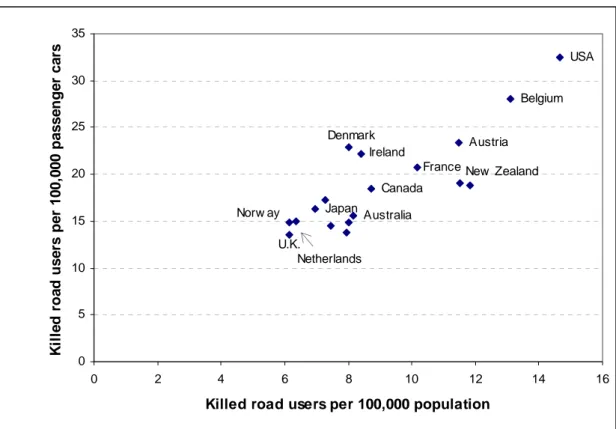
Analyses of correlations between these data were shown to be significant between killed road users per 100,000 population and killed road users per 100,000 passenger cars, r=0.84 (p<0.0001). Figure 6 plots the correlation between these measurements.
Japan Australia France Canada Netherlands Norw ay Ireland Denmark New Zealand Austria U.K Belgium USA 0 5 10 15 20 25 30 35 0 2 4 6 8 10 12 14 16
Killed road users per 100,000 population
K ille d r o a d u s e rs p e r 1 0 0 ,0 0 0 p a s s e n g e r c a rs .
Figure 6 Correlations between killed road users per 100,000 population and killed road users per 100,000 passenger cars in Zone 1. n=18.
The correlation in Figure 6 shows that there was a strong relation between killed road users per population and killed road users per passenger cars, implying that the more people in the country the more cars. Great differences could be found between e.g. the U.K. and the USA with respect to both killed road users per population and per cars. The USA had the highest killed road user rate in this zone with 15 killed per 100,000 population and 33 killed per 100,000 cars. The corresponding figures for the U.K. were 6 and 14, respectively. However, it was obvious that the USA and Canada did not fit with the rest of the American continent, with respect to their (i.e. the USA’s and Canada’s) much lower killed road users per cars rate. The same applies to Australia, New Zealand and Japan, countries that did not fit in their geographical context when looking at fatalities per cars.
In all the other zones there were no correlations between killed road users per
population and killed road users per passenger cars, indicating that this correlation only appeared in high income, wealthy, countries.
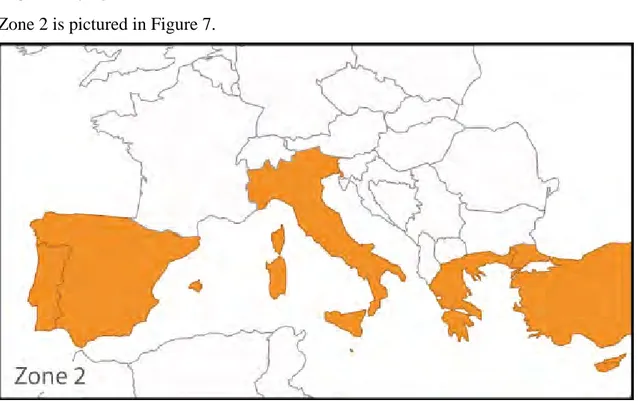
4.3 Zone
2
Zone 2 is pictured in Figure 7.
Figure 7 Zone 2. Graphic design: Markus Thyberg.
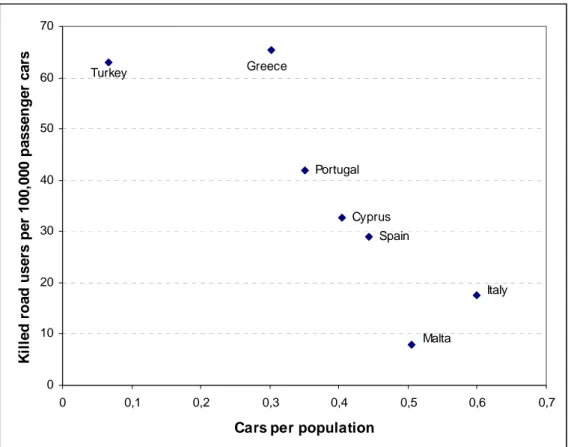
Zone 2 in our dataset comprised of 11 countries and data from these measurements were missing from 7 countries. Mean of Gross National Income was about 13,000 US$ (sd. 5,800) in zone 2. There were, on average, almost 0.38 (sd. 0.17) passenger cars per population, 11.31 (sd. 5.67) killed road users per 100,000 population and 36.78 (sd. 21.65) killed road users per 100,000 passenger cars.
None of the analyses of correlations between these data were significant with the Bonferroni adjusted α value. However, the correlation between cars per population and killed road users per 100,000 passengers cars was quite high but negative, r = -0.86 (p=0.013) and is shown in Figure 8. The correlation between GNI per capita and cars per population was 0.86 (p=0.014).
Italy Spain Cyprus Portugal Greece Turkey Malta 0 10 20 30 40 50 60 70 0 0,1 0,2 0,3 0,4 0,5 0,6 0,7
Cars per population
K ille d r o a d u s e rs p e r 1 0 0 ,0 0 0 p a s s e n g e r c a rs
Figure 8 Correlation between cars per population and killed road users per 100,000 passenger cars in Zone 2. Note that this correlation was not significant when applying the Bonferroni adjusted α value. n=7.
As shown in Figure 8, the correlation was negative between these two measurements, implying that the more cars in the population, the fewer killed road users. Malta had the best traffic safety in the world, even better than in Sweden, and also a slightly more cars per population and should thus be placed into zone 1. However, with respect to its geographical location, and the very few immigrants in Sweden, the authors placed Malta in zone 2 anyway. Malta had 4.0 killed road users per 100,000 population and 8.0 killed road users per 100,000 cars. Turkey and Greece, on the other hand, had the highest number of killed road users per cars in this zone. It is difficult to know to which zone Turkey belonged, based on its geographical position being part of Europe, Asia, and the Middle East. Since Turkey is applying for membership in the European Union (EU) it was placed in zone 2. As shown in Figure 8, Turkey had the lowest degree of
motorization within this zone. Italy had a high number of cars per population and fewer killed per car than the other countries in zone 2; thus qualifying Italy for zone 1 together with e.g. France. However, based on its geographical positioning, the authors chose to cluster Italy into zone 2.
4.4 Zone
3
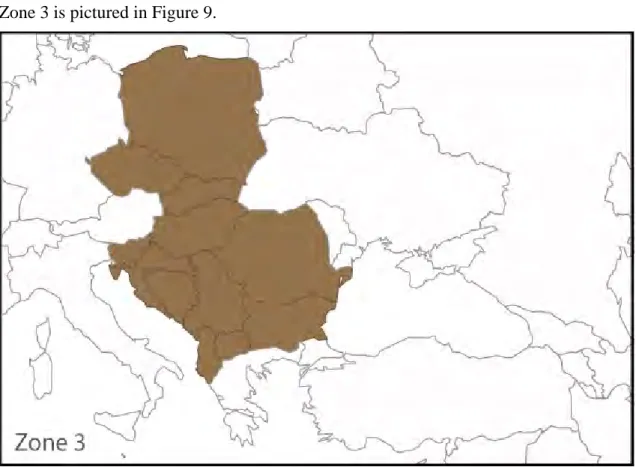
Zone 3 is pictured in Figure 9.
Figure 9 Zone 3. Graphic design: Markus Thyberg.
Zone 3 in our dataset comprised of 16 countries, some of them not existing today. We had data for all measurements from 10 of the countries. Mean of Gross National Income was about 4,400 US$ (sd. 3,100) in 12 countries in zone 3. There were, on average, almost 0.25 (sd. 0.12) passenger cars per population, 12.0 (sd. 2.48) killed road users per 100,000 population and 60.59 (sd. 39.78) killed road users per 100,000 passenger cars.
Analyses of correlations between these data showed to be significant between GNI per capita and cars per population, r = 0.87 (p=0.001), as was the correlation between cars per population and killed road users per 100,000 passenger cars, r = -0.80 (p=0.005). Figure 10 and Figure 11 plot the correlation between these measurements.
Croatia Poland Bulgaria
Serbia & Montenegro Romania Slovak Republic Hungary Czech Republic Slovenia Albania 0 0,05 0,1 0,15 0,2 0,25 0,3 0,35 0,4 0,45 0,5 0 2000 4000 6000 8000 10000 12000 14000
GNI per capita
C a rs pe r p opu la ti o n
Figure 10 Correlation between GNI per capita and cars per population in Zone 3. n=10.
As shown in Figure 10 there was a positive correlation between GNI per capita and cars per population, i.e. the higher the income, the more cars. Bulgaria was an outlier, in this respect with more cars per population than other countries in the lower middle income class (about 2,000 US dollars) represented by Albania, Romania, Serbia and
Montenegro. In zone 3, Slovenia had the highest GNI per capita, classified as a high income country and the same degree of motorization as in Sweden.
Bulgaria Poland Slovakia Hungary Romania Serbia & Montenegro Albania Czech Republic Slovenia 0 20 40 60 80 100 120 140 160 180 0 0,1 0,2 0,3 0,4 0,5
Cars per population
K ille d r o a d u s e rs p e r 1 0 0 ,0 0 0 p a s s e n g e r c a rs
Figure 11 Correlation between cars per population and killed road users per 100,000 passenger cars in Zone 3. n=10.
When looking at the correlation between cars per population and killed road users per cars, as shown in Figure 11, a negative correlation appears, i.e. the more cars the relatively fewer killed. Albania, having the fewest cars per population and the highest killed road users per passenger cars ratio, was a statistical “outlier” within this zone.
4.5 Zone
4
Zone 4 is pictured in Figure 12.
Figure 12 Zone 4. Graphic design: Markus Thyberg.
Zone 4 in our dataset comprised of 16 countries, where the Soviet Union does not exist today. We got data for all measurements from 11 countries. Mean of Gross National Income was about 1,700 US$ (sd. 1,700) in 15 countries in zone 4. There were, on average, almost 0.14 (sd. 0.11) passenger cars per population, 13.92 (sd 5.22) killed road users per 100,000 population and 155.11 (sd. 93.09) killed road users per 100,000 passenger cars.
Analyses of correlations between these data were shown to be significant between GNI per capita and cars per population, r = 0.94 (p<0.0001), between GNI per capita and killed road users per 100,000 population, r = 0.72 (p=0.004), as was also cars per population and killed road users per 100,000 passenger cars, r = -0.76 (p=0.007). Figure 13, Figure 14 and Figure 15 plot the correlations between those measurements.
Azerbaijan Georgia Ukraine Belarus Russian Federation Kazakhstan Kyrgyzstan Moldova Lithuania Latvia Estonia 0 0,05 0,1 0,15 0,2 0,25 0,3 0,35 0,4 0 1000 2000 3000 4000 5000 6000
GNI per capita
C a rs pe r p opu la ti o n
Figure 13 Correlation between GNI per capita and cars per population in Zone 4. n=11.
As shown in Figure 13 there was a big difference between the three Baltic countries Estonia, Lithuania, Latvia and the rest of the countries within zone 4. These three countries are located at the Baltic Sea close to the Fenno-Scandinavian area. Since 2004 they are members in the European Union (EU).
Gerogia Ukraine Turkmenistan Azerbaijan Armenia Belarus Russian Federation Kazakhstan Kyrgyzstan Moldova Tajikistan Latvia Lithuania Estonia 0 5 10 15 20 25 0 1000 2000 3000 4000 5000 6000
GNI per capita
K il led r o ad u se rs p er 1 00, 000 p o p u lat io n
As shown in Figure 14, the correlation between GNI per capita and killed road users per 100,000 population showed an uneven pattern. Estonia, Lithuania and Latvia who had the highest GNI per capita in zone 4 also had the highest killed road users per popula-tion. Estonia differed from the other two Baltic countries; the number of killed road users per 100,000 population was lower, despite the higher income, compared to the other two Baltic states. This could be a sign of increased traffic safety level, closer to the traffic safety level that the data seen in zone 1 reflect. However, in zone 1 a correla-tion between GNI per capita and killed road users per 100,000 populacorrela-tion did not appear. Lithuania Estonia Latvia Kyrgyzstan Belarus Ukraine Russia Azerbaijan Kazakhstan Moldova Georgia 0 50 100 150 200 250 300 350 400 450 0 0,05 0,1 0,15 0,2 0,25 0,3 0,35 0,4
Cars per population
K ille d r o a d u s e rs p e r 1 0 0 ,0 0 0 p a s s e n g e r c a rs
Figure 15 Correlation between cars per population and killed road users per 100,000 passenger cars in Zone 4. n=11.
Figure 15 shows that the more cars in the population the fewer killed road users per 100,000 passenger cars. This is especially shown for the three countries Latvia, Estonia and Lithuania with the lowest rate of killed road users per cars. On the other hand Kyrgyzstan had the highest number of killed road users per passenger cars and the fewest cars per population rate.
4.6 Zone
5
Zone 5 is pictured in Figure 16.
Figure 16 Zone 5. Graphic design: Markus Thyberg.
Zone 5 in our dataset comprised of 36 countries, but we have data for all measurements from 11 countries, only. Mean of Gross National Income was about 3,300 US$ (sd. 6,500) in 25 countries within zone 5. There are, on average, almost 0.08 (sd. 0.11) passenger cars per population (15 countries), 9.23 (sd. 6.87) killed road users per
100,000 population (13 counties) and 789.03 (sd. 1544.08) killed road users per 100,000 passenger cars (14 countries).
None of the analyses of correlations between these data were significant with the Bonferroni adjusted α value. However, a correlation between cars per population and killed road user per 100,000 population was found with the unadjusted α value, i.e. r=0.58 (p=0.039), as shown Figure 17.
Pakistan India China Bangladesh Sri Lanka Philippines Hong Kong Mongolia Republic of Korea Chinese Taipei Maldives Brunei Darussalam 0 5 10 15 20 25 30 0 0,05 0,1 0,15 0,2 0,25 0,3 0,35 0,4
Cars per population
K ille d r o a d u s e rs p e r 1 0 0 ,0 0 0 popul a ti on
Figure 17 Correlation between cars per population and killed road users per 100,000 population in Zone 5. Note that this correlation was not significant when applying the Bonferroni adjusted α value. n=13.
As shown in Figure 17 Bangladesh, the Philippines, Pakistan, India and China had the lowest degree of motorization. However, China and India, as well as Sri Lanka and Mongolia had more killed road users per population than the others in the subgroup of low motorized countries. On the other end of the scale, Brunei showed a high degree of motorization, equal to for example the Baltic countries and Portugal. Most killed road users per 100,000 population in this zone was found for the Maldives.
4.7 Zone
6
Zone 6 is pictured in Figure 18.
Figure 18 Zone 6. Graphic design: Markus Thyberg.
Zone 6 in our dataset comprised of 24 countries, but we had data for all measurements from 5 countries only. Mean of Gross National Income was about 4,900 US$ (sd. 5,500) in 18 countries in zone 6. There were, on average, almost 0.17 (sd. 0.15) passenger cars per population (6 countries), 15.23 (sd. 7.24) killed road users per 100,000 population (11 countries) and 262.70 (sd. 337.95) killed road users per 100,000 passenger cars (6 countries).
None of the analyses of correlations between these data were significant with the Bonferroni adjusted α value. However, a correlation between GNI per capita and cars per population was found with the unadjusted α value, i.e. r= 0.92 (p=0.029), as shown in Figure 19.
Syria Morocco Tunisia Bahrain Israel 0 0,05 0,1 0,15 0,2 0,25 0,3 0,35 0,4 0 2000 4000 6000 8000 10000 12000 14000 16000 18000 20000
GNI per capita
C a rs pe r p opu la ti o n
Figure 19 Correlation between GNI per capita and cars per population in Zone 6. Note that this correlation was not significant when applying the Bonferroni adjusted α value. n=5.
As shown in Figure 19, data varied substantially for the different countries in zone 6. Israel and Bahrain were high income countries and they also had most cars per popula-tion. The other three countries had a lower middle income and quite fewer cars per population.
4.8 Zone
7
Zone 7 is pictured in Figure 20.
Figure 20 Zone 7. Graphic design: Markus Thyberg.
Zone 7 in our dataset comprised of 49 countries, but we had data for all measurements from 9 countries only. Mean of Gross National Income was about 900 US$ (sd. 1,300) in 45 countries in zone 7. There were, on average, almost 0.03 (sd. 0.04) passenger cars per population (9 countries), 12.94 (sd. 8.89) killed road users per 100,000 population (14 countries) and 1,039.77 (sd. 986.00) killed road users per 100,000 passenger cars (10 countries).
Ethiopia Sierra Leone Uganda Kenya Senegal Sw aziland South Africa Mauritius Botsw ana 0 0,01 0,02 0,03 0,04 0,05 0,06 0,07 0,08 0,09 0,1 0 500 1000 1500 2000 2500 3000 3500 4000 4500 5000
GNI per capita
C a rs pe r p opu la ti o n
Figure 21 Correlation between GNI per capita and cars per population in Zone 7. n=9.
Figure 21 shows a high correlation between GNI per capita and cars per population. Botswana is a country differing from the other upper middle income countries with fewer cars per population. Ethiopia is the country within this zone with lowest income and lowest degree of motorization.
Uganda Ghana Senegal Kenya Angola Lesotho Sierra Leone Ethiopia Sw aziland South Africa Gabon Botsw ana Mauritius 0 5 10 15 20 25 30 35 0 500 1000 1500 2000 2500 3000 3500 4000 4500 5000
GNI per capita
K il led r o ad u se rs p er 1 00, 000 p o p u lat io n
Figure 22 Correlation between GNI per capita and killed road users per 100,000 population in Zone 7. n=13.
As shown in Figure 22 the higher income the more killed road users per 100,000 population. In the figure two groups can be noted; one low income group and one middle income group. Mauritius had the highest income in the zone and, compared to
the other middle income countries, the lowest killed road user per 100,000 population rate. Swaziland, on the other hand, had a lower middle income and, after Botswana, the highest killed road users per 100,000 population rate.
4.9 Zone
8
Zone 8 is pictured in Figure 23.
Figure 23 Zone 8. Graphic design: Markus Thyberg.
Analyses of correlations between these data were shown to be significant between GNI per capita and cars per population, r = 0.80 (p<0.0001). Figure 24 plots the correlation between these measurements.
Niragua Paraguay Colombia Peru Belize Chile Argentina Brazil Suriname Mexico Barbados Panama Costa Rica Guatemala Honduras 0 0,05 0,1 0,15 0,2 0,25 0,3 0,35 0 1000 2000 3000 4000 5000 6000 7000 8000 9000 10000
GNI per capita
C a rs pe r p opu la ti o n
Figure 24 Correlation between GNI per capita and cars per population in Zone 8. n=16.
As shown in Figure 24 the countries were rather similar except for Barbados that stood out from the others by having the highest GNI and highest cars per population in this zone. Nicaragua was the poorest country in zone 8 and it also had the lowest rate of motorization.
5
Background data for the foreign born in Sweden
In this chapter, the basic parameters including background data are presented, in order to provide the reader with knowledge about confounding variables. All data are based on the actual situation December 31st 2003.
Within the eight zones presented in Figure 1, the foreign born were most commonly born in:
Zone 1: Scandinavia, Germany, the U.K. and the USA Zone 2: Turkey and Greece
Zone 3: Former Yugoslavia and Poland Zone 4: Estonia and Russia
Zone 5: Thailand, India and China Zone 6: Iraq, Iran, Lebanon and Syria Zone 7: Ethiopia and Somalia
Zone 8: Chile
In Figure 25, the share of foreign born in Sweden are distributed with respect to the eight road user population zones shown in Figure 1.
36% 6% 20% 3% 8% 16% 5% 6% Zone 1 Zone 2 Zone 3 Zone 4 Zone 5 Zone 6 Zone 7 Zone 8
Figure 25 The share of foreign born in Sweden distributed with respect to the eight road user population zones.
As shown in Figure 25, more than a third (36%) of the foreign born, emigrated from countries within zone 1. A fifth (20%) immigrated to Sweden from countries in zone 3 and 16% from zone 6. As further shown in Figure 25, only 3% of the foreign born immigrated to Sweden from zone 4.
5.1
Sex distribution
In Table 2, the distribution between the sexes among foreign born and the native born is shown, the foreign born data being divided into the eight road user population zones shown in Figure 1.
Table 2 Swedish foreign born population 2003-12-31 divided into men and women per road user population zone, based on data from SCB.
Men (%) Women (%) Total number
Zone 1 45.9 54.1 381,215 Zone 2 56.3 43.7 60,091 Zone 3 46.8 53.2 219,513 Zone 4 36.8 63.2 35,486 Zone 5 40.0 60.0 91,519 Zone 6 54.8 45.2 177,383 Zone 7 52.6 47.4 49,592 Zone 8 49.7 50.3 62,797
All foreign born 47.9 52.1 1,077 ,96 All native born 49.8 50.2 7,898,074
Grand total 49.5 50.5 8,975,670
As shown in Table 2, the share of women was 2% larger among the foreign born than the native born. Furthermore, great variations in sex distribution can be observed. For example, in zone 4 and 5 women constitute the majority, whereas the opposite can be found in zone 2, 6 and 7.
5.2 Age
distribution
The age distribution between foreign born and native born is shown in Table 3.
Table 3 The age distribution between foreign born and native born, based on data from SCB.
Foreign born (%) Native born (%) Total in Sweden (%)
0–17 yrs 9.7 23.3 21.6 18–24 yrs 8.7 8.1 8.1 25–34 yrs 16.8 12.5 13.0 35–44 yrs 19.8 13.2 14.1 45–54 yrs 17.0 12.6 13.1 55–64 yrs 13.2 12.8 12.9 65+ 14.8 17.5 17.2 Total 100.0 100.0 100.0
As shown in Table 3, children were a substantially smaller share among foreign born, which in turn can be explained by the fact that foreign born in the ages 25–54 are over represented, this particular age cohort being the ages of becoming parents. Being foreign born and giving birth to a child in Sweden means that the child will be considered as native born, a development quite natural, but giving foot prints in the statistics.
5.3
Time in Sweden
Foreign born include people recently immigrating to Sweden, as well as those living in Sweden for decades. These differences may have an influence on adaptation to Swedish life in general and for crash involvement. In Table 4 the average time in Sweden for the different road user population zones are thus shown.
Table 4 Average time in Sweden for the different road user population zones, based on data from SCB.
Born in zone Time in Sweden mean (sd) Time in Sweden median 1 28 yrs (17) 31 yrs 2 19 yrs (12) 19 yrs 3 16 yrs (12) 10 yrs 4 14 yrs (18) 7 yrs 5 12 yrs (10) 11 yrs 6 10 yrs (7) 11 yrs 7 10 yrs (8) 10 yrs 8 14 yrs (9) 14 yrs
The longest average time in Sweden had the foreign born from zone 1, the majority being people from Finland. Foreign born from zone 2, having an average time of
~20 years in Sweden, comprised mainly people from Greece and Italy. The foreign born with the shortest time in Sweden, i.e. about 10 years, were people from zone 6 and 7. Zone 3 and zone 4 presented large differences between mean time and median time in Sweden.
When scrutinizing data for zones 3 and 4 further, an explanation could be that certain countries within these two zones contribute strongly to this finding. In zone 3, the countries with the greatest differences between mean and median time in Sweden, i.e. former Yugoslavia and Croatia, accounted for a difference of approximately 7 years between mean and median time in Sweden. These countries represents about one third of the foreign born from zone 3.
6
Crash involvement among foreign and native born in Sweden
In this chapter an overview of involvement in police reported crashes with personal injuries in year 2003 is presented. Men and women from the eight road user population zones are compared to native born men and women. Table 5 shows all police reported crashes involving personal injury per 1,000 population.Table 5 Police reported crashes involving personal injury per 1,000 population in year 2003, based on data from SCB.
Men Women Zone 1 5.2 2.7 Zone 2 7.4 3.3 Zone 3 9.7 3.7 Zone 4 5.1 2.5 Zone 5 6.9 4.2 Zone 6 14.0 5.2 Zone 7 8.6 2.4 Zone 8 7.9 3.2
All foreign born 8.4 3.4 All native born 5.6 3.0
As shown in Table 5, men and women in zone 6 had the highest crash involvement, men 14 per 1,000 population and women 5.2, respectively. Compared to native born men and women, whose crash involvement rates were 5.6 and 3.0, respectively, a clear difference can be observed. The second highest involvement in police reported crashes were among men from zones 3 and 7. The lowest involvement in police reported
crashes among men were in zone 4 and 1. Among women, the lowest crash involvement rates were in zones 7 and 4. The disparities between women from different zones were not as large as among men. All women’s crash involvement rates were lower than native born men’s crash involvement rate.
In Figure 26 the relative risk for foreign born compared to native born is calculated. Foreign born from the eight zones and the grand total should be compared to 1, which is the relative risk set for native born. The relative risk was computed within each sex and comparisons shall be made within men and women, respectively.
0 0,5 1 1,5 2 2,5 3 1 2 3 4 5 6 7 8 All Zones R el at ive r isk Male Female Native born = 1
Figure 26 Relative risk of being involved for foreign born compared to native born (set to 1) in police reported crashes involving personal injury.
Figure 26 shows the mentioned elevated relative risk for people from zone 6. As shown, the relative risk was more than twice compared to native born men, whereas women from this zone had 70% higher risk to be involved in a crash compared to native born women. In zones 1 and 4 the risk to be involved in a crash was lower than for native born and this applied to both males and females. Also women from zone 7 had a lower risk than native women. On average, the risk was 50% higher for males and about 10% higher for females.
To further scrutinize the crash involvement, only passenger car drivers 18 years and older were chosen and related to the number of license holders. This is shown in Table 6.
Table 6 Passenger car drivers involved in police reported crashes per 1,000 license holders 18 years and older in year 2003, based on data from SCB.
Men Women Zone 1 4.1 2.5 Zone 2 6.8 4.6 Zone 3 8.2 4.0 Zone 4 6.4 3.8 Zone 5 9.6 5.5
When comparing passenger car drivers involved in police reported crashes per 1,000 license holders, zone 6 had the highest rate, about 14 per 1,000 license holders for men and more than 9 for women. The rates for native born were 3.7 for men and 2.2 for women, both lower than any of the foreign born figures. In zone 7, the great difference between men and women was further explored. Among men in this zone, 12.8
passenger car drivers per 1,000 were involved in police reported crashes, but only 2.6 per 1,000 among women. The lowest crash risk for both foreign born males and females were among people born in zone 1.
In Figure 27, the relative risk for foreign born drivers compared to native born driver is shown. Foreign born drivers from the eight zones and the total should be compared to 1 which is the relative risk set for native born drivers. The relative risk was computed within each sex and comparisons shall be made within men and women, respectively.
0 0,5 1 1,5 2 2,5 3 3,5 4 4,5 5 1 2 3 4 5 6 7 8 All Zones R el at ive r is k Male Female Native born = 1
Figure 27 Relative risk to foreign born compared to native born (set to 1) among passenger car drivers involved in police reported crashes.
Foreign born cars drivers’ relative risk was twice the risk on average for males and slightly lower for females. When data were subdivided into the eight zones, zones 6, 5 and 8 stood out as having more than twice the relative risk for both males and females. The situation is somewhat more complicated among foreign born from zone 7, one reason being that the number of female data points was low.
7 Discussion
The aim of the present study was to present facts about foreign born in Sweden and their involvement in police reported crashes compared to native born. In order to support this aim, clustering of countries world wide into road user population zones, depending on a number of parameters, was necessary. This clustering process was extensive and based on a number of assumptions and decisions. Based on this clustering, this study also aimed to compare the zones and to analyse possible correlations between the different parameters used for the clustering.
The parameters possible to retrieve in this study were GNI, cars per population, killed road users per population and per cars for the included countries. Unfortunately, the most relevant measurement in considering traffic safety; namely exposure – usually presented as annual average kilometres driven – was only obtainable from 53of the >200 involved countries in the data sets used in this study, Sweden not being one of them. Hence, the results are based on deductions from the second best type of data. Nevertheless, they provided a fairly good estimate of the traffic safety situation in relation to GNI in the eight defined road user population zones.
Prior to any discussions on the results, six possible postulates based on the included parameters can be made:
1. As the GNI increase, the number of cars increase
2. As the GNI increase, the number of killed road users decrease
3. As the GNI increase, the number of killed road users per cars decrease 4. As the population increase, the number of cars increase
5. As the number of cars increase, the number of killed road users increase
6. As the number of cars increase, the number of killed road users per cars decrease. In order to explore these six postulates, each road user population zone has been investigated individually and also with respect to all eight zones combined. The first postulate was significantly confirmed for all zones and for zones 3, 4, 7 and 8, with r-values ranging from 0.80–0.94. However, if the Bonferroni adjustment of the αlevel is removed, also zones 2 and 6 showed correlations, significant of the 0.05 level ranging from 0.86–0.91. Such unadjusted significant correlations will in this study be regarded as tendencies, presented to further support the significant correlation found. All r-values are presented in Appendix 2 and the important ones in chapter 4. To summarize, data from all zones but 1 and 5 supported that as the GNI increase, the number of cars increase.
The assumption that as the GNI increase, the number of killed road users decrease was, surprisingly not confirmed at all. On the contrary, zones 4 and 7 significantly proved the opposite, with r-values ranging from 0.72–0.73. In order to further explore this finding all r-values were examined, none of them being significant even on the unadjusted α level. These r-values were all positive (ranging from 0.4–0.5, indicating an increase in killed road users as GNI increases, in zones 2, 3 and 6, whereas in the other three zones
of -0.3. Applying the unadjusted αlevel, also zone 4 showed a significant correlation of -0.7, further supporting the basic assumption that as the GNI grows, people would gain safety by upgrading their car model, since new cars are substantially safer than older cars (Evans, 2004). However, in zone 4 the included countries vary substantially with respect to GNI, the Baltic countries forming a wealthier subgroup, which could explain this tendency. Furthermore, this postulate was not proven for any individual zone, but for all, indicating that the range of inbuilt safety in the cars used varies more between than within the zones.
Postulate number 4 was a very simple one, namely that as the population increase, the number of cars would increase, as well. To our surprise this was only confirmed in the wealthiest zone, i.e. zone 1. None of the others, as well as all combined, showed any tendencies in this direction. However, it should be noted that the opposite was neither found, namely that as the population grows in less wealthy zones, i.e. there are more people to share a less rapid growth of car holding. When scrutinising the r-values in Appendix 2 further, it could be found that all of them pointed in the negative direction, except for zone 2. This finding could give a hint of the inverse relationship, i.e. as the population increase; the number of cars would, in fact, decrease. However, when we combined all countries no proof was found to support this speculation.
We then investigated whether any correlations were supporting the assumption that as the number of cars increase, the number of killed road users increases, as well. No such correlations were found on the adjusted αlevel. On the unadjusted αlevel, zones 3, 4, and 5 supported the postulate with r-values ranging from 0.6–0.7. This means that this relationship applied only to these zones in which less wealthy countries are clustered. Lastly, we checked for correlations supporting that as the number of cars increase, the number of killed road users per cars decrease, which was supported by data from zone 3 and 4, as well as data for all included road user population zones. The r-values ranged from -0.4 to -0.8. On the unadjusted αlevel, zones 2 and 8 further supported the postulate with r-values ranging from -0.7 to -0.9.
The earlier used categorizations (Eriksson, 1998; Yahya, 2001) ended up in eight similar zones, but given somewhat different epithet. The clustering in the present study is not remarkably different from these two. In fact, with respect to individual countries the only differences are Israel, New Zealand and Sudan. Eriksson and Yahya clustered Israel with countries in zone 1, but we chose to cluster Israel into zone 6, according to its geographical position. Zone 6 has some straggling countries, but in GNI terms, Israel will fit with e.g. Kuwait. If, however, the focus is on killed road users per population, Israel will fit with some other countries, e.g. Syria.
This is the situation in many of the zones, i.e. that all the measurements studied do not show the same pattern for all countries clustered together into a certain zone.
New Zealand was clustered by Eriksson and Yahya together with countries from Asia, but we chose clustered it into zone 1, due to its traffic safety situation and its geo-graphical position close to Australia. Sudan was clustered by Eriksson and Yahya together with countries north of the Sahara and countries from the Middle East, i.e. rather similar to our zone 6. However, we clustered Sudan into zone 7, a zone that Eriksson and Yahya labelled “the Africa south the Sahara”.
Special standpoints in considering zone belongings have also been taken for the Baltic countries, Turkey, Japan, New Zealand, Australia, Malta, Spain and Italy. We must admit taking different standpoints for different countries, of which the four
measurement data shown in chapter 2 were most important. All standpoints ended up in almost the same categorization as used by Eriksson and Yahya, but with the advantage of the present study having the clustering more thoroughly done and with greater amount of the measurements data available. The almost identical clustering makes it, in fact, easier to compare data sets between the three different studies.
Which of the measurements data used were the most valid for the aim of the present study? In accordance with our findings, Evans (2004) also found that there is a general tendency for the number of fatalities per vehicle to be lower, the higher the degree of motorization. Whether fatalities per population or a fatality per car is the most accurate measurement depends on the countries’ distribution of different vehicles. The data used in this study concerned passenger cars. In some countries a substantial part of the vehicle fleet instead consists of buses or two-wheeled vehicles. In these countries, fatalities per car are obviously not the best measurement. Thus, it would be better to use fatalities per population, if not data of all types of vehicle are available. However, in the present study both measurements were used when data were available, thereby lowering the impact of this bias.
The lack of data was most noteworthy in less wealthy countries and maybe this could be interpreted as a sign of these countries’ traffic safety; namely that this is not a very important issue. In poor countries, some of them at war, where people get killed to a greater extent due to lack of food, diseases or from the war than from traffic crashes, traffic safety issues may for obvious reasons be redundant.
Evans (2004) points out that a country’s traffic fatality rate, measured as deaths per vehicle, is strongly related to its wealth and that traffic fatality ratio declines reflect contributions from technology, infrastructure, legislation and behavioural changes among the road users. Based on the findings from this and other studies (Eriksson, 1998; Yahya, 2001), many countries in the world have a lot to do in order to decline the traffic fatality ratios; the most important factor being changing driver behaviour (Evans, 2004).
Comparing the police reported relative crash involvement risk on an all ages population basis between foreign born from the eight different road user population zones, as well as combined, showed that the risk was increased for all zones together, as well as individually, except for zone 1 and 4. The risk was increased for women (except for zone 7), as well as for men. On average, the risk was 50% higher for males and more than 10% for females, compared to their native born counter parts. However, the variation was large. Male foreign born from zone 6 had more than twice the crash risk compared to native born males, whereas females from this zone had a 70% higher crash risk than their female counterparts. The greatest differences between the sexes in crash risk within a zone was among foreign born from zone 7, in which the female risk actually was lower than for native born females and the relative risk for males twice the relative risk of the foreign born females from zone 7. The female foreign born relative risk for zone 7 was, in fact, also lower than for the native born females from zone 1 and 4. Foreign born from zone 3, 5 and 6 stood out as facing the highest relative crash risk. When further scrutinizing police reported relative crash involvement risk among