M¨alardalen University
School of Innovation, Design
and Engineering
MASTER
THESIS
A
TLAS
C
OPCO
R
OCK
D
RILLS
AB
I
NBOUND
L
OGISTICS
C
OST AND
CO
2
C
ALCULATIONS
Cihan K¨okler
Atlas Copco Rock Drills AB Inbound Logistics Cost and CO2Calculations
APPROVED BY:
Dr. Magnus Wiktorsson (Thesis Supervisor)
Prof. Mats Jackson (Thesis Co-Advisor)
Sabah M. Audo
Rolf L¨ovgren
Prof. Dr. Anders Hellstr¨om
c
⃝ Cihan K¨okler 2010
ACKNOWLEDGEMENTS
First of all I would like to thank Johanna Leijon, Stefan Neselius and Johannes Turesson on behalf of Atlas Copco Rock Drills AB for eliciting this opportunity and for their help during the process.
I also want to thank my supervisor Magnus Wiktersson and Sabah Audo for his initiate guidelines, from M¨alardalen University. I want to send my gratitude to my friends, es-pecially; Clover Giles for her amazing help, Batu Akan for his patience and Katharina Stenier for her endless support.
I am thankful to my all family members one-by-one who create this opportunity and sup-porting me all my life. But, I have dedicated to this thesis particularly to my grandfather, Ihsan K¨okler who has the biggest effort during my all education life. Thanks grandpa
”s¨oz¨un¨u tuttun, rahat uyu”.
ABSTRACT
Atlas Copco Rock Drills AB Inbound Logistics Cost and CO2Calculations
Cihan K¨okler
Business has globalized rapidly during the last decades. Distances between point of origin and point of consumption have increased as a result of globalization. Today’s increased distances mean that companies require faster logistic responses. Air transportation is preferred because it’s worldwide lead-time, of just 1-2 day, fulfill business expectations. However, transportation operation costs have risen dramatically and there are growing concerns about the high CO2 emission levels associated with air transportation. These
issues have recently become a point of focus for most globalized companies.
Currently, Atlas Copco Rock Drills AB, in ¨Orebro is mostly using air transportation for their inbound logistics flow from North America Shared Distribution Center (SDC). In this thesis, sea transportation is surveyed to asses it’s suitability as a replacement in both economic and environmental terms. The formulated questions are:
(1) For which items can SDC use sea transportation instead of air transportation at the lowest cost and with the lowest risk?
(2) How much can SDC reduce their CO2emission with the new setup? Does it comply
with the ”environmental targets” of Atlas Copco Rock Drills AB?
(3) How would SDC make decisions about suitable transportation setups for additional items in the future?
When the transportation method is changed from air to sea more than one of the total logistics costs are affected. In reflection of the longer lead-times connected with sea transportation warehousing costs will increase. Therefore, when researching the ”lowest cost” we must consider the lowest total logistics cost. Extended lead-times also decrease the companies’ capability for flexibility; additionally, there will be heightened risk in con-nection with product life cycles. The possible environmental effects of sea transportation are considered carefully before an item’s transportation method change is suggested to the company. All calculations of CO2emissions have been done in accordance with N¨atverk
f¨or Transporter och Milj¨o’s (Network for Transporter and Environment) (NTM) formula
in order to reach a credible result. The findings are compared with the company’s envi-ronmental policy. An excel model has been developed to calculate results for extra items which may be added to the product range in the future.
As a result of the research analysis it has been shown possible to reduce total logistic cost up to, 33%, 3.247.000 SEK. By changing transportation mode, the CO2 emission levels
for transportation per item for these can even be reduced by up to 97%. Additionally, the excel model can be used internally to implement future changes.
TABLE OF CONTENTS
ABSTRACT vi
LIST OF TABLES x
LIST OF FIGURES xii
1 Introduction 1
1.1 Background . . . 1
1.2 Company Description - Atlas Copco AB . . . 3
1.3 Expectation and Purpose . . . 4
1.4 Previous Studies . . . 5
1.5 Research Questions . . . 5
1.6 Limitations . . . 6
1.7 Outline of the Thesis . . . 6
2 Methodology 8 2.1 Research Methods . . . 8
2.1.1 Quantitative and Qualitative . . . 8
2.1.2 Chosen Research Method . . . 8
2.2 Research Approaches . . . 9
2.2.1 Deduction, Induction and Abduction . . . 9
2.2.2 Chosen Research Approach . . . 10
2.3 Collecting the Data . . . 11
2.3.1 Case Study . . . 11
2.3.2 Interviews . . . 11
3 Theoretical Framework 13 3.1 Logistics . . . 13
3.1.1 Logistics Activities . . . 14 3.2 Transportation . . . 17 3.2.1 Modes . . . 17 3.2.2 Environmental Effects . . . 21 3.3 Global Logistics . . . 23 3.4 Green Logistics . . . 25 4 Current Situation 29 4.1 Atlas Copco Logistics . . . 29
4.2 Atlas Copco: Transportation . . . 31
4.3 Environmental Management . . . 34
5 Analysis & Results 39 5.1 Cost Analysis of Inbound Items . . . 39
5.1.1 Transport Cost . . . 40
5.1.2 Warehouse Cost . . . 42
5.1.3 Risk Analysis . . . 43
5.1.4 Consequences of Changing Mode of Transport-All Items . . . . 44
5.1.5 Consequences of Changing Mode of Transport-TOP 2000 . . . . 46
5.2 CO2 Analysis of Inbound Items . . . 46
5.2.1 Consequences of Changing Mode of Transport-All Items . . . . 49
5.2.2 Consequences of Changing Mode of Transport-Top 2000 . . . 50
5.3 Analysis per Supplier . . . 50
5.3.1 Bristol Machine Works (ID 95) . . . 52
5.3.2 Trelleborg (ID 1362) . . . 53
5.3.3 John Deere Coffeyville Works Inc. (ID 14007) . . . 54
5.3.4 Machine Service Inc. (ID 14010) . . . 55
5.3.5 Superior Gearbox Co. (ID 14013) . . . 56
5.3.6 Williams Controls Inc. (ID 14014) . . . 57
5.3.7 Ase Supply Inc. (ID 14015) . . . 58
5.3.8 Hydraulic Technologies Inc. (ID 14019) . . . 59
5.3.9 Hydreco (ID 14025) . . . 60
5.3.10 Campion Lab Inc. (ID 14034) . . . 61
5.3.11 Polar Mobility Research (ID 14040) . . . 62
5.3.13 Serck Denver Radiator (ID 14087) . . . 64
5.3.14 Atlas Copco Drilling Solutions (ID 65744) . . . 65
5.3.15 Dana Corp Crossville (ID 90020) . . . 66
5.4 Excel Model for Future Selections . . . 67
6 Conclusion & Recommendation 69 6.1 Conclusion . . . 69 6.2 Recommendation . . . 72 R´ef´erences 74 REFERENCES 74 APPENDIX A Lists 77 ix
LIST OF TABLES
3.1 Intermodal Chart . . . 21
3.2 Paradoxes of green logistics (Rodrigue, 2001) . . . 26
3.3 Benefits of green logistics (Steveles, 2002) (Duber-Smith, 2005) . . . 28
4.1 Contracted companies for inbound logistics . . . 33
4.2 Contracted companies for outbound logistics . . . 34
6.1 Change of mode for just 438 parts . . . 70
6.2 All SAC1 items . . . 70
6.3 Change of mode for just 90 parts . . . 71
6.4 All SAC1 . . . 71
6.5 CO2 emissions change of mode for just 438 parts . . . 71
6.6 CO2 change all SAC1 items if just 438 parts are changed . . . 71
6.7 CO2 emissions change of mode for just 90 parts . . . 72
LIST OF FIGURES
1.1 CO2 change by sectors, 2005-2007 [OECD, 2009] . . . 2
1.2 Atlas Copco CMT organisation chart . . . 3
2.1 The three different research approaches (Kovcs & Spens, 2006) . . . 10
3.1 The circle of environmental logistics . . . 27
4.1 Flow of distribution . . . 30
4.2 Countries covered by Atlas Copco Customer Centers in green . . . 30
4.3 Effects on Environment . . . 35
5.1 North American inbound logistics flow . . . 39
5.2 Spare Parts Product-Life-Cycle . . . 44
5.3 Change of mode for just 438 parts . . . 45
5.4 All SAC1 items if just 438 parts are changed . . . 45
5.5 Change of mode for just 90 parts from the Top 2000 . . . 46
5.6 All SAC1 items if just 90 parts are changed . . . 47
5.7 Share of CO2 emissions between road and sea, for transportation from NA suppliers to ¨Orebro . . . 48
5.8 Share of CO2emissions between road and air, for transportation from NA suppliers to ¨Orebro . . . 48
5.9 CO2 emissions change of mode for just 438 parts . . . 49
5.10 CO2 change all SAC1 items if 438 parts are changed . . . 49
5.11 CO2 emissions change of mode for just 90 parts . . . 50
5.12 CO2 change all SAC1 items if just 90 parts are changed . . . 50
5.13 Summary of Bristol Machine Works . . . 52
5.14 Summary of Trelleborg . . . 53
5.15 Summary of John Deere Coffeyville Works Inc. . . 54
5.17 Summary of Superior Gearbox Co. . . 56
5.18 Summary of Williams Controls Inc. . . 57
5.19 Summary of Ase Supply Inc. . . 58
5.20 Summary of Hydraulic Technologies Inc. . . 59
5.21 Summary of Hydreco . . . 60
5.22 Summary of Campion Lab Inc. . . 61
5.23 Summary of Polar Mobility Research . . . 62
5.24 Summary of Horton Inc. . . 63
5.25 Summary of Serck Denver Radiator . . . 64
5.26 Summary of Atlas Copco Drilling Solutions . . . 65
5.27 Summary of Dana Corp Crossville . . . 66
5.28 Interface of the developed MS Excel model . . . 67
CHAPTER 1
Introduction
Atlas Copco AB’s Construction and Mining Technique (CMT) business sector, Atlas Copco Rock Drills AB use air transportation for their inbound logistics flow from North America. Short lead-times, high flexibility and low warehousing costs make air trans-portation convenient for the company. However, new transtrans-portation options are sought due to increasing environmental sensitivity and the high operation costs of air transporta-tion. Consequently, Atlas Copco Rock Drills AB added a sea transportation contract to its new transportation agreement. This master thesis surveys the compatibility of the shipped items for sea transportation.
1.1 Background
Quick responses have become the key factor for today’s global business. Reasons such as; shorter product life cycles, increasing distances between point of origin and point of consumption and customer satisfaction make speed crucial for the business. Air trans-portation is preferred by a significant number of companies because it can answer these demands. Short lead-times associated with air transportation provide high-flexibility and lower warehousing costs. However, high operational costs and environmental factors are drawbacks of the mode.
Sea transportation is a strong competitor to air transportation because of low operational cost and fewer harmful emissions. It is the preferred transportation mode between conti-nents because of its lower tariff.
During the last century, greenhouse gases (GHG) have reached risky high levels, which are caused, in part, by the increased usage of fossil fuels. It has been found that the level
of CO2 is second only to water vapor. As a result of this rapid CO2 increase, the world’s
average temperature has risen and the ozone layer has been impaired.
Transportation operations account for the greatest release of CO2 among all logistics
ac-tivities (Aronsson, Brondin, & Kohn, 2008). According to the 2006 data, CO2 emitted
by transportation accounts for 22,5% of the world total CO2 emission (see figure 1,1).
Companies and researchers have started to direct their attention to the concerning sub-ject of high amount of CO2 emissions. According to the OECD report published for
the Copenhagen Climate Conference 2009, CO2emissions by transportation will have to
significantly decrease in order to maintain the environment(OECD, 2009).
Figure 1.1: CO2change by sectors, 2005-2007 [OECD, 2009]
Despite the time advantages of air transportation, it is the highest CO2 emissions
cre-ating mode of transportation. It is additionally harmful because aircrafts produce CO2
emissions higher in the atmosphere and therefore the CO2 dispersion is more intensive in
the ozone layer. Cargo aircrafts release 80 times more CO2 than commercial sea vessels
(NTM, 2008). Atlas Copco Rock Drills AB aims to increase the level of sea transportation for their logistics operations with the awareness of the huge emissions gap.
1.2 Company Description - Atlas Copco AB
Atlas Copco AB is a provider of industrial productivity solutions with 130 years of expe-rience. They have 25.900 employees and business activities in more than 150 countries. The company’s headquarter is located in Stockholm, Sweden. Atlas Copco AB operates its business facilities in three main business areas which are Compressor Technique,
Con-struction and Mining Technique and Industrial Technique. (Atlas Copco AB Website,
2009)
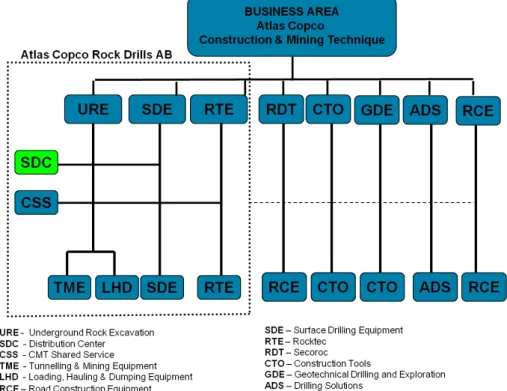
The Construction and Mining Technique (CMT) business develops, manufactures, and markets rock drilling tools, underground rock drilling rigs for tunnelling and mining ap-plications, surface drilling rigs, loading equipment, exploration drilling equipment, and construction tools. The business area has its principal product development and manufac-turing units in Sweden and the United States, with others units in Austria, Canada, China, Finland, Germany, India, Japan and South Africa. The business area is split into eight divisions, (Atlas Copco AB Website, 2009) presented in Figure 1.2.
Figure 1.2: Atlas Copco CMT organisation chart
Atlas Copco Rock Drills AB, ¨Orebro belongs to Atlas Copco’s construction and Mining Technique (CMT) business area and consists of three divisions: Rocktec, Surface Drilling Equipment and Underground Rock Excavation. The division is located in ¨Orebro, Swe-den. There is also a Shared Distribution Center (SDC) to support the Atlas Copco Rock Drills AB divisions and Atlas Copco Customer Centers in the other countries. [Atlas Copco AB’s Intranet]
1.3 Expectation and Purpose
The thesis aims to achieve the expectations set by both business and academical sides. During the course of this thesis two differing expectations should be been fulfilled. Below are listed the purposes of both the business (Atlas Copco Rock Drills AB) and educational facility (M¨alardalen University);
Business - Atlas Copco Rock Drills AB;
• Within the limitations of the research, analyze the new transportation contracts
which were implemented October 2009. Increase of the usage of sea transporta-tion as a consequence of the analysis.
• Calculation of the possible CO2 reduction with sea transportation. Analyze the
re-duction and compare to Atlas Copco Rock Drills AB’s annual environmental target which is 2% reduction per year. If the result does not comply with the targets, make suggestions to achieve the goal.
• After the thesis, build an excel model for selection of transportation mode selection
with the lowest cost.
Academical - M¨alardalen University;
• Use the tools and knowledge which is provided by M¨alardalen University during the
Master Level of Logistics and Production Management.
• Refer the study to correct and sourced theoretical frameworks.
• Follow the scientific theory and methodology principles during the writing of the
1.4 Previous Studies
The research has surveyed both transportation mode selection and its environmental effect in terms of CO2 emission. The research area has grown into a challenging issue for the
business over the last two decades. Therefore, previous master theses for other companies (examensarbete) have been considered as references during the study. There are two similar studies which overlap with this thesis.
Firstly, ”Reduction of Environmental Effects” analyzed the environmental effects of dif-ferent transportation modes for Swedish companies (Gustafsson, Larsson, & Sundst¨orm, 2009). The authors calculated the emissions of various gases which are defined by NTM. The thesis argued from an environmental point of view rather than in favour of costs.
Secondly, ”Cost breakdown and surcharge mapping for sea fright - A study for Tetra Laval Group” worked with cost calculations for sea transportation (Blom & Borisson, 2008). LCL pricing, risk factors and methodology are the coinciding similarities between these researches. The authors thoroughly analyzed sea pricing creation, however, this research used only signed price contracts. Environmental aspects were mentioned briefly but were not an objective of the authors’ study.
1.5 Research Questions
The thesis study tries to find answers for the questions which are mentioned in the in-troduction of this thesis. Research questions must be the kind of questions which can be answered by the results (Fisher, 2007). Therefore, the study follows three questions step by step. Below are the questions and their description;
(1) For which items can Shared Distribution Center (SDC) use sea transportation
in-stead of air transportation at the lowest cost and with the lowest risk?
Within the limits of the research, total logistics costs are calculated for both exist-ing air transportation use and prospective sea transportation use, accordexist-ing to the current item list. Emergent costs are compared with risk issues.
(2) How much can Shared Distribution Center (SDC) reduce their CO2 emission with
the new setup? Does it comply with the ”environmental targets” of Atlas Copco
Rock Drills AB?
According to the results of the first question, annual CO2 emission reduction is
surveyed. The findings are also compared with Atlas Copco Rock Drills AB envi-ronmental targets and recommended future suggestions for how the company can continue to decrease CO2levels.
(3) How would SDC make decisions about suitable transportation setups for additional
items in the future?
The comparing analysis shall be rendered to analyze data for the importation spare parts which are not included in the first study. Hence, an excel based model shall be developed for company use.
1.6 Limitations
Limitations of the thesis were identified by Atlas Copco Rock Drills AB according to the interim study and the knowledge/experience of the master student. The research was limited to inbound logistics from USA and Canadian suppliers to SDC in ¨Orebro. The single price list for North American suppliers and the new agreement for inbound logistics were the grounds for the limitation.
There is a wide product range imported from North America, therefore the research fo-cuses on frequent sale SAC1 items. SAC3 (low amount annual sales) items are not ana-lyzed. Only spare parts were considered during the research.
Air and sea transportation modes are analyzed as options. Supplier-to-terminal and terminal-to-SDC decisions are not included in the research. Even thought, price agreements for sea transportation are made separately for LCL and FCL, the LCL price contract is surveyed.
Calculation of emissions is limited to CO2, since CO2 is the most significant greenhouse
gas. The company uses CO2emissions as the basis for their operational routines.
1.7 Outline of the Thesis
The thesis was designed and based upon M¨alardalen University’s guidelines for the master level thesis project.
Chapter 1 contains the background of the thesis with a general company description and reference to previous studies which influenced to the thesis. The section ”research questions” poses the questions which the thesis tries to answer in Chapter 6. Project limitations describes the boundaries of the study. Chapter 2 explains the methodology of the thesis. The data gathering and tools are also explained.
The theoretical background of the thesis is surveyed in Chapter 3. Logistics and
trans-portation academic sources are considered with focused on global logistics. The relation
between logistics and environmental aspects were also based on an academical back-ground.
Chapter 4explains the current situation at Atlas Copco Rock Drills AB. It aims to show the situation for logistics, transportation and environmental management within the com-pany for easier perception of the following result chapters.
In Chapter 5; analysis and results of the study are explained. Section 5.1 tries to an-swer the first research question.Section 5.2 presents the environmental factors which were brought up in the second research question. Supplier-by-supplier analysis aims to simplify explanation of the results for the company workers.Section 5.4 details the implementation of the transportation selection model.
Conclusions and recommendations are discussed in Chapter 6. Possible future work on the subject is explained within the summary of the thesis. The authors’ individual suggestions about the subject are also placed here.
CHAPTER 2
Methodology
2.1 Research Methods
There are two distal research methods: Quantitative and qualitative methods. The choice of method depends on the research question and the research objective. The overall ob-jective of research is to define new reliable and valid knowledge.
2.1.1 Quantitative and Qualitative
• Quantitative
Quantitative methods are based on empirical data and present numerical results, hence; they have high validity and credibility. Quantitative research are able to answer question marks such as ”how many” and ”how much”. Therefore,the method is preferred more on natural science. (Miles & Huberman, 1984)
• Qualitative
Qualitative research is more subjective and interpretive and mostly used for social sciences. Qualitative researches apply to amongst others interviews, observations and questionnaires. Since result of the research is the opinion of researcher, qualita-tive researches have lower validity. [ibid].
2.1.2 Chosen Research Method
Academics agree that researchers should not restrict themselves to only one research method. Both methods should be used during thorough research. As mentioned in Section
1.5, ”how much” and ”how many” are surveyed during the thesis. Therefore, the thesis
method is linked with quantitative research. Qualitative research method have also been applied for data collection process such as case study and interviews.
2.2 Research Approaches
There are three main approaches for developing new knowledge; ie. research approaches: Deduction, induction and abduction. Deductive research approaches are based on theoret-ical knowledge and test previous theories at the research. Inductive research approaches theory development processes and are based on practical knowledge. Abduction is not counted as a research approach method by some researchers (Hyde, 2000); however, ac-cording to Kovacs and Spens [2006] abductive research generally understood as
”reason-ing from effect to causes or explanations”.
None of the research approach has excellence over the others. The uses of the approaches are dependent on the aim of the researcher; all require advanced levels of background knowledge. Kovacs and Spens have defined for choice of research approach (Kovacs & Spens, 2006)
(1) the starting point of the research process;
(2) the aim of the research; and
(3) the point in time at which hypotheses or propositions (H/P) are developed and whether they are further applied.
2.2.1 Deduction, Induction and Abduction
Deduction
The starting point of deductive researches are particular H/P, often linked to quan-titative research. A strong theoretical background is built at the beginning of the research process (Danermark, 2001). Then, theory based suggestions are tested empirically. The new research is developed from previously analyzed theories and expose new results. Therefore, dedicative reasoning is defined as a testing process
(Kovacs & Spens, 2006). Generally, consequences of the deductive research are based confirmations or contradictions of the previous H/Ps
Induction
Inductive research approaches are the mirror image of the deductive process (Johnson, 1996). In contrast to the deduction, induction research is based on practical knowl-edge. A theoretical frame or literature base is not necessary at the beginning of the research . Inductive researches aim to develop the theory instead of the building new one.
Abduction
Abductive research is the least used methods of the research approaches. According to Kovcs and Spens [2006], there are two different possible starting points for the abductive research process: ”Puzzling observations” or new alternative theory to phenomenon. The aim of abductive research is to build a new H/P to explain a situation or real-life phenomenon.
2.2.2 Chosen Research Approach
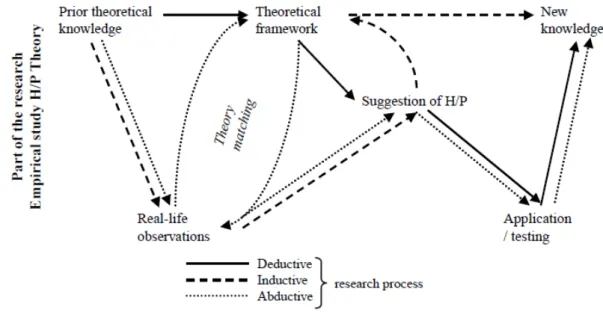
From these three research approaches, the inductive research approach is the method that this thesis follows. The followed path way is visualized in Figure 2.1.
This thesis is coordinated by Atlas Copco Rock Drills AB and focuses on real business problems and solutions. Hence, the starting point of the research is the practical knowl-edge and calculations (testing) of the problem, followed by real life observation. Theoret-ical framework matching comes after the suggestion of H/P. The consequences of these processes are new information and knowledge related to reduction of CO2 emissions and
total logistics costs, in otherwords, the subject of the thesis.
2.3 Collecting the Data
2.3.1 Case Study
Case study is one of the ways to do social science research. Case studies are also com-mon in economic and business (Gronhaug & Ghauri, 2002). Case studies help to find
Figure 2.1: The three different research approaches (Kovcs & Spens, 2006)
answers to the questions ”how” and ”why”. There are effective methods to survey certain phenomenon. (Yin, 2003)
Every company has unique working routines and rules. Therefore, case study method is used to explain Atlas Copco Rock Drills AB’s working routine and logistics flow system in this thesis, Chapter 4.
2.3.2 Interviews
Interviews are important data collection method during research. There are various type of interviews; structured, semi-structured and unstructured. The structured interviews are arranged with previously prepared questions and no new additional questions are asked during the interview. The unstructured interviews are improvisation interviews such as conversations. Semi-structured interviews are also arranged with prepared questions but extra questions can be asked according to additional information demand. (Yin, 2003)
This thesis follows mostly unstructured interview method. During the thesis, there have been periodically meetings with supervisors from Atlas Copco Rock Drills AB, shown at below. In addition, interview with Geodis Wilson (outsourced company) has been arranged as semi-structured. The contact persons are listed below.
• Atlas Copco Rock Drills AB - Johannes Turesson, Transportation & Traffic • Atlas Copco Rock Drills AB - Johanna Leijon, Environment & Quality • Atlas Copco Rock Drills AB - Stefan Neselius, Global Warehouse Support • Geodis Wilson Sweden AB - Anna-Carin Uhr, Key Account Manager
CHAPTER 3
Theoretical Framework
3.1 Logistics
Today after half a century of development, logistics are a crucial functions for companies’ profit goals. Nowadays there are diverse activities, strategies and also different definitions under the logistics heading. The concept is developed continuously; therefore there are no particular borders for logistics definition or it’s activities.
According to several sources, the term ”logistics” was coined WWI and WWII. However, the word’s meaning derives from the Greek “λ´oγς” (”logos”, ”calculation”). The first use is based in ancient Greece, Byzantium and Rome Emperors where they have had business departments called ”Logistikas”. The department was responsible for source distribution and finance. (Huston, 1977)
Until 1956 logistics was used in military terms, but then was applied to trading with the advent of shipping containers. The beginning of scheduling transportation of goods for far distances and the recognition of profit increasing in conjunction with bulk trading made logistics attractive in business. During the 1990’s both advancements in information tech-nology and the globalization of economy increased the occurrence and case of logistics activities. Since it is still developing, there is no ”True Concept” of logistics (Frazelle, 2002).
In the beginning, logistics meant only transportation. However, today ”logistics” does not only mean transportation but also many other activities which are connected to each other. For the widely accepted definition of logistics, it is better to refer to the definition of Logistics Council, ”the process of planning, implementing, and controlling the
effi-cient, effective flow and storage of goods, services, and related information from point of origin to point of consumption for the purpose of conforming to customer requirements.”
(Logistics Management, 2008).
Together with the extended definitions and the business world approach to logistics, peo-ple started to think about a new term which can describe this whole process. Since pro-duction planning is attached to the logistics process, the term Supply Chain Management (SCM) began to be used instead. However, SCM is not an excellence in logistics, it is the network of facilities (warehouses, factories, terminals, ports and stores), vehicles and logistics information systems connected to an enterprise.
A deeper understanding of SCM is needed. From the beginning of 90s until now, the definition of SCM has extended. There have been several new and controversial explana-tions for SCM as a research field. According to Monczka and Handfield [2009], SCM’s
primary objective is to integrate and manage the sourcing flow and control of materials using a total systems perspective across multiple functions and multiple tiers of suppli-ers (Monczka, Handfield, Guinipero, & Pattsuppli-erson, 2009). Cooper et al. [2002], prefer
to explain it as the management philosophy of the distribution process which lasts from supplier to end user (D. Bowersox, Closs, & Cooper, 2002).
As we can see from the paragraphs above, logistics and SCM are diverse management fields but, they are integrated with each other at several subject points. SCM activities lean toward management philosophy whereas logistics activities more base on physical processes. Examples of SCM activities include integrated behaviour, mutually sharing information and other cooperational steps.
3.1.1 Logistics Activities
According to Stock et al. [1998], logistics activities are the processes which happen be-tween the point of origin and consumption. All activities are connected to each other; therefore, one of them can affect all others. The list is prepared according to Lam-bert’s [1976] table in which he mentioned How logistics activities drive total logistics
• Customer Service • Demand forecasting/planning • Inventory management • Logistics communications • Material Handling • Order Processing • Packaging
• Parts and service support
• Plant and warehouse site selection • Procurement
• Return goods handling • Reverse logistics
• Traffic and transportation • Warehousing and storage
Classification of the logistics activities is detailed and specialized. However, real busi-ness wants to divide logistics processes into more flexible and less complex sections. Therefore, only some of the activities (which are written in bold) are described as used commonly by business (Murphy & Wood, 2007) and also detailed in this thesis.
Customer Service
Customer Service is the starting point for all logistics activities. The cause for the delivery of goods from the point of origin to the point of consumption is the cus-tomer’s order. Thus, incoming information from the customer affects the following logistics activities. The goal of logistics activities, as with other fields, is to meet costumer demand. This process can be fulfilled with the right product, at the right place, at the right time. In other words, it does not mean selection of the cheapest and shortest route, rather fulfillment of customer desires. (Stock, Grant, Lamber, & Ellram, 2006)
Demand Forecasting
Planning and forecasting is one of the most complex processes of logistics activi-ties. Planners should work together with marketing department and the production department. The marketing department informs the other of their suggestions about promotions, sales waves or effect of competitors on sales. It helps on forecasting future orders and demands. Another recommendation source can be the production which informs about historical data about production side and stock availability for the next terms. The troublesome side of planning/forecasting is that the planner must analyze and optimize feedback and information from different departments in order to decide on the optimum ordering schedule. (Stock et al., 2006)
Inventory Management
The calculation of the stock amounts; the establishment of service levels are the only possibility to appraise together all logistics activities at inventory management. Future demand forecasts, customer response, warehousing activities, selection of transportation mode and lead times are considered in this process.
Service levels, which are established by inventory management, have an a direct influence upon the operating stock amounts and natural costs of warehousing. The cost varies from 14% up to 50% which may increase to precarious levels for profit of operation. Hence, it is vital to hold enough stock to meet the customer demands.
Order Processing
The process starts with customer orders for the goods. The development of the pro-cess depend on order availability or order status. Routine controls and updated man-ual adjustments are crucial for the order process in order to present true and current information to customer. The order process contains order entry, order adjusting, planning, shipping and purchasing operations (Mentzer & Kondrad, 1991).
Organizations are today increasingly turning to advanced order processing meth-ods such as Electronic Data Interchange (EDI). Evolving information technologies provide supplement transparency.
Traffic and Transportation
Traffic and transportation is the one of the major activities among the logistics ac-tivities. Since the transportation is a main focus in the thesis, it will be described in detail at section 3.2.
Warehousing
Warehousing supports time and place availability by allowing an item to be produced and held for later consumption. Simply, warehousing means that raw materials or finished products are stored until their delivery time. However, the storing process does not add value to the products. Therefore, the main objective of warehouse man-agement is to meet the customer demand with low energy consumption, low labour and low equipment usage. Warehousing can be minimized when all other activities are successfully achieved. There are some examples like Toyota Production System (TPS). The TPS aims to minimize finished-product storage and to minimize raw material storage with a pulling production system (Liker, 2004).
3.2 Transportation
Transportation is the main activity for logistics which aims to deliver goods to the cus-tomer (Waters, 2003) . However, this definition is extended by some sources. According to Waters [2003], the main objective of transportation is to deliver the goods from the ori-gin of source to the oriori-gin of consumption within the response time, requirements of the customer service policy and limitations of the transportation infrastructure, at the lowest possible cost.
Transportation is in most cases the highest single cost among logistics activities. It consti-tutes approximately 65% of the total operation cost (Stock et al., 2006) . A major reason is that the distances between the point of source and the point of consumption increases day-by-day because of the globalized economy. It is also affected by the increased product demand, and the low-cost manufacturing countries in far-East.
3.2.1 Modes
There are several ways to transport goods between two locations. They depend on geo-graphic situations, distances, requested lead times and the type of transported materials. There are 5 main transportation modes, however according to the thesis limitations
(Sec-tion 1.6) the pipeline mode is not examined during the research. The modes are: • Air • Sea • Road • Rail • Pipeline 3.2.1.1 Air
Air-fright has become more commonly used as a results of aviational evaluation in the last decades. Growth of the international trade, technical developments in aviation and
identification of agility as a key point for business success have increased the usage of air transportation inevitably.(Waters, 2003)
Air transportation is undoubtedly the fastest transportation mode for medium or longer distances. Hence, it is the first choice for urgent goods or short life cycle products. Air transportation is especially suited to the spare parts sector where quick customer response is vital. Furthermore, high value products like vehicles, machines, high-tech products and short life cycle products like fruits and plants are forwarded by the mode.
Air freight is operated as three various types:
• Combined: The first type is in cargo-passenger combined airplanes, where the
goods are carried in baggage space under the passenger cabins. Generally, this kind of air freight is operated by national flag carrier companies such as SAS, Lufthansa or KLM.
• Cargo Service: The operators run scheduled cargo aircrafts. Cargo aircrafts make
possible to carry large amounts of cargo and even containers. Private forwarding companies (ex TNT, UPS, and FedEx) have a significant share of cargo services, along with the national flag carriers.
• Charter: Mostly private cargo transporters offer this service for customers who
wish to hire a whole cargo aircraft out of schedule.
Air freight is a strong competitor, providing the shortest delivery time of all the trans-portation modes. Short lead-times affect also the warehousing operations. Companies do not need huge stocks for high service levels. As airports are much more widely spread, and not held by geographical boundaries, air transportation is a more accurate method of transportation between continents.
At the other hand, air fright also has the highest operational cost. The airplane’s techni-cal operation and high fuel consumption make them more costly than their competitors. Terminal-to-terminal necessity is also another drawback for short distance forwarding. Additionally, airplanes produce high amounts of greenhouse gases.
3.2.1.2 Sea
Sea transportation is the most commonly used mode for far distance freight. Over 90% of worlds’ trade is provided by sea transportation (Waters, 2003). The vehicles of the mode move on surfaces such as oceans, sea, inland sea, rivers, lakes and canals. Therefore, it is possible to access a wide range of coastal points. Maritime business is significant in European trade and there are 300 ports around the European coasts (where all continental is surrounding by) (Cochran, 1999).
Three type of sea (water) transportations are regularly used - rivers and canals, coastal shipping and ocean transport. Rivers and canals are mostly used in the huge territorial continentals such as North America or Asia. It is not a popular option in Europe where road transportation dominates. Coastal shipping moves materials from one port to another following the coast. Ocean transport goes across the major seas (Waters, 2003).
Various kinds of ships are used depending on their route and load. The main freight ships are:
• General Cargo Ships: Widely used general cargo ships are designed for standard
ports which can load and unload with standard cranes.
• Bulk Carriers: Bulk carriers are used for low-value goods like sand, grain or gravel. • Tankers: Liquid materials are carried by tanker ship. These are mostly oil products. • Container Ships: Container ships complete the ocean and major sea transport
ac-tions. Containers are generally designed as standard TEU (20-foot) and FEU (40-foot).
• Ferries: Ferries (also called RO-RO vessels) can carry trucks or other vehicles.
They are preferred for short distances.
Sea delivery offers the cheapest tariffs for long distance deliveries. Sea transportation is unrivalled in cost when high volume/weight goods are shipped in Full Container Load (FCL). Nearly every size or type of goods (solid, liquid, gas) can be carried by ship. Commercial vessels are also the lowest environmental contaminator, after cargo trains.
There are however some drawbacks of sea transportation. Since the movement field is water, there are other transport vehicle needed to complete door-to-door freight. For this, trucks are generally preferred. Therefore, sea transportation is usually only selected for long distances. Difficulties of loading/unloading, and custom transactions, are another drawback during port operations. Long lead-times are also a problem for some short-life products (such as food) and business for which agility is crucial (Stock et al., 2006).
3.2.1.3 Road
Currently, it is the most widespread used transportation method. It is nearly necessary to complete all kinds’ terminal-to-terminal transportation modes. Trucks provide to reach every geographical land points where road access has a door-to-door advantage.
3.2.1.4 Rail
Rail transport is the conveyance of goods by means of wheeled vehicles running along railways. Railway transportation has a cost-advantage in relation to its competitors and it is the most environment friendly transportation type, since trains more often use electrical power instead of fossil fuels. Trains can carry all sizes of products, especially heavy goods which is not possible with to transport road. It is also cheaper than the other modes. However, it is a terminal-to-terminal method, which has several extra hidden operation costs such as loading/unloading and transportation from terminal to customer. That’s why rail transportation is more often preferred for long-distances and heavy products. (Stock et al., 2006)
3.2.1.5 Intermodal
It is often not possible to fulfill a complete forwarding of the goods using with just one vehicle because of geographical conditions and terminal-to-terminal transportation mode selection. Intermodal transportation usage becomes inevitable for businesses which at-tempt to use efficient transportation modes for long distances.
trans-portation modes. Each mode has own characteristics, such as speed, cost, flexibility, vol-ume/weight capacity and accessibility. It is impractical to use just one single vehicle to carry goods from a supplier (located in eg. Charlotte/North Carolina-USA) to eg. ¨ Orebro-Sweden. Instead, the goods can be moved to Atlanta Airport with trucks, Atlanta Airport to Stockholm Arlanda Airport in air and again with trucks between the airport and the warehouse in ¨Orebro. Consequently, the benefits of air and road transportation are com-bined. The table shows that the benefits of the each transportation mode according to 1 (best) to 5 (worst) (Waters, 2003).
Rail Road Water Air Cost 3 4 1 5 Speed 3 2 4 1 Flexibility 2 1 4 3 Volume/weight limits 3 4 1 5 Accessibility 2 1 4 3
Table 3.1: Intermodal Chart
The loading/unloading processes and waiting time during transitions between modes are the major efficiency problems of intermodal transportation. The successful operating of transitions make intermodal transportation effective. Until the end of 1960’s when the containers were not commonly used, 60% of the operation time was spent on loading and unloading (Union Internationale Rail Route 2001, Transport Statics). Today, the ships spend only few hours for the loading/unloading operations with the widespread use of the containers. Today’s trade is happened over 70% with the containers (Waters & Soman, 1990).
3.2.2 Environmental Effects
The logistics activity which has the most environmental impact is transportation. There-fore, one of the first governmental environmental legislations was ”vehicle emission stan-dards”. Whilst regulations and high technology decrease CO2emissions, increasing
trans-portation demand with the growth of manufacturing has raised emissions to critical levels.
Looking at the situation in the Europe Union (EU) can help us to understand the circum-stances. According to ”Eurostat 2003” 32% of total energy consumption in the EU in
2001 happened during transportation operations. This rate is equal to 910 million tonnes CO2. When we compare these numbers with those from 1991, it shows us that emissions
increased by 22% in the EU. Whilst 44% of the energy consumption came by fossil fuels in 2001, it had increased by only 4% compared to 10 years before (1991) (Eurostat, 2003).
Substantial amounts of contaminants are of the increasingly released by transportation. NTM (N¨atverket f¨or Transporter och Milj¨o) mainly considers CO, HC, NOX, and CO2
gases and additionally SO2 gas which can be added by varied sources. All these gases
have detrimental effects on the environment, however we will just focus CO2 due to our
research limitations. It is considered to be the largest contributor to the greenhouse effect and it is also directly related to the fuel consumption. The Kyoto protocol calculates green houses gases (GHG), which are six, in terms of CO2. Thus, CO2 was the major
environmental subject of the theoretical framework and it will be the calibration gas for the analyzing chapter [Kyoto Protocol].
In most cases, emissions are in direct proportion with fuel consumption but are addition-ally affected by outside environments (temperature, wind etc.). However, this is disre-garded due to their exiguous effects on the total. Harmful effects of contaminants by vehicles can be described in terms of cost. The cost is predominantly theoretical infor-mation. However, some countries analyze and reflect the cost to their motor vehicle tax policy. Thus, the environmental cost can sometimes effect the total transportation cost in-directly, although there are only few countries which applies environmental costs to their policies. (Eriksen, 2000)
Even thought we did not add the environmental calculations to our research, it is better to look deeply at the costs for future trends. Since the environmental cost is still theoretical, the cost of CO2 emission is designated with a little differences by varied authors. As
part of ExtendE project, the cost was 15 euro/tonnes CO2 out of town (Eyra, Downing,
Hoekstra, Rennings, & Tol, 1998). According to Holtsmak and Hagem [1998], the cost was calculated 13,75 euro/tonnes CO2(Holtsmark & Hagem, 1998).
Each transportation mode has different environmental effect characteristics. Generally, they depend on fuel type and fuel consumption. In some certain situations; road-bed is also significant for environmental characterise. Airplanes move more closely to the ozone layer than nautical vessels; that makes airplanes a higher consumption point and thus even thought they have same GHG, low dispersion makes them more harmful. Rail, road, sea
and air modes will be discussed in Section 3.4.
Rail is the most advantageous mode among the four major transportation methods. Since most trains work with electrical power; they do not have direct effect to air as CO2 or
another contaminator from fossil fuels. Today 65-70% of freight trains in the EU are operated with electrical power and the percentage is expected to increase up to 80% by 2020. Release of CO2 from freight trains is not calculated due to its indirect effect as it
depends on countries energy production politics. For example, Norway produces their all electrical energy from hydro-electric power stations; therefore, there is no direct or indirect CO2emission by trains in Norway. Freight trains contribute only 1% of total CO2
emission in EU despite the fact that 20% of freight trains still use diesel locomotives.
3.3 Global Logistics
Globalization is the growing integration of economies and societies around the world. The term globalization is generally used for economic nominal. However, the term can describe fields directly related to economy or non-related subjects. These include trade, culture and education (Bhagwati, 2004).
Over the last 30 years companies have started to see the whole world as their market. During the 1990s’ globalization trend among the companies was three times more than domestic throughout the world (D. J. Bowersox & Calantone, 1998). Due to advancement from domestic trade to international, the distance between the point of origin and the point of consumption increased.
Since the market for companies have expanded rapidly, production capacities and manu-facturing facilities have increased. Companies which work with high volumes start to use the whole globe as a production center. Enlarged distances are not only between points of origin and point of consumption but also between supplier and production facility.
We look closer at a company’s production planning to understand how they trigger global logistics, or more accurately ”international logistics”. Xerox Corporation produces of-fice products which are used at countless ofof-fices around the World. Headquarter of the company are located in the USA; however, their copier machine circuit boards came from Hong Kong, printer stands from Brazil, frames from Germany and they are all assembled
in New York. The copier machines are then shipped from New York back to all countries. Xerox uses 20.000 containers per year to operate the logistics traffic and the value of the daily carried goods is more than 100M US Dollar. The example of Xerox is not unique in today’s global business. Most high-volume international companies have similar complex logistics maps. (Christopher, 1998)
Like Xerox; with simple narration it can be said that; today, distances from raw material to final customer has increased for every produce. Distances and lead time are longer; more players are involved; more data is required; greater knowledge is necessary; costs are higher and most importantly; there are greater penalties for error (Capacino, Britt, & Consulting, 1991). During the 1990s’ at a rate at least three times as great as typical domestic economies throughout the world (D. J. Bowersox & Calantone, 1998).
Due to progressive transportation demand, the costs of carriage between two points have been decreased as the result of some improvements, like technical developments and more competitors at logistics sector (Delany, 1990). Nevertheless, today a global company invests funds to purchased materials and logistics services up to 70% of product cost (Capacino et al., 1991). Logistics management or we can call it supply chain management with production side is crucial for business to achieve their profit goals.
These improvements, which aid progressive logistics operations, have triggered the effect during the last decades. Technical developments in information sharing, collaborative in-ternational standards and free trade zones can facilitate carriage and goods monitoring for complex logistics operations. Therefore, transported goods are not included in custom transactions where there are some continental scale custom unions such as in EC at Eu-rope, NAFTA in North America, MERCOSUR and CAN in South America, WAEMU in Africa. The aim of custom unions is to simplify border crossing and to increase the trade volume between countries.
It is not effortless to resolve the difficulties over the borders, even if nullified borders simplify the transport of goods. There is varied language, culture, standard and tech-nological request beyond each border. When we interpret Europe where there are less cultural differences and more common standards in proportion to the rest of World, we see that still there is some troubles at operations. Exemplary; between Denmark and Finland has different container types; Alp passes between Switzerland and Austria; no private co-operator at Dutch railways; different railway wideness between two neighbor
countries France and Spain (Brewer, Button, & Hensher, 2001).
Importance of logistics operations on contingently globalization business is evidentiary with comparative GDP and logistics expenditures at Europe. Increment of logistics ex-penses has more shares with GDP every single year. 884 US$ billion has been consumed at logistics operations which correspond to 12,2% share, whilst; total GDP was 7238 US$ billion during 1997. When we look at 2002, logistics operation consumption was 1229 US$ and 13,3% share billion where GDP was 9238 US$ billion at Europe. Expenses at logistics operation has amplified 39,5% whilst, GDP has increased only 19,3%. As we can observe from comparative GDP and logistics expenditures, logistics operations be-come more crucial for business than it has ever been before (Rodrigues, Bowersox, & Calantone, 2005).
3.4 Green Logistics
Environmental sustainability, is a growing concept parallel to escalating pollution levels during the last century. Increasing CO2 emissions from 5 billion tones to 25 billion tones
(United Nations Environment Program), depletion of the ozone layer, acid rains and visi-ble air pollution in big cities demonstrates that environmental susceptibility is a verifiavisi-ble issue in need of attention. Initially, scientists and academicians were concerned about the risk and their analysis stated expressly that current pollution trends could significant damage the environment. Unsurprisingly, industrialization and increased manufacturing were given as major causes. Faced with the dilemma of increasing manufacturing, de-mands governments started to create individual legal regulations and strategies in order to help prevent environmental degradation such as vehicle emissions standards, recycling requirements and source reduction (Wu & Dunn, 1995) (Stock, 1992). International foun-dations began to follow suit and there are now many global policies. To quote an example,
International Standards of Organizations (ISO) has set ISO 14000 standard for
environ-mental management systems which is applied to vendors worldwide (Young, 1996). In such light, today’s ”business” and ”environment” can not be thought of separately. Thus, business executives confirm the 1990s’ as the decade of the environment (Kirkpatrick, 1990).
The goal of logistics is to achieve cost efficient customer service and traditionally, logis-tics systems have been evaluated using the criteria of time, service and costs (Aronsson
et al., 2008). However, this definition determines logistics by just it’s main features. The environmental impact of the process was also referred to by such authors like Murphy and Poist [2000]; Wu and Dunn [1995] or Stock et al. [2006]. Accordingly, this oper-ation is named green logistics (Murphy & Poist, 2000). According to Van Hoek [1999] the term green logistics is coined to refer to those practices within the supply chain that aim to reduce sources of waste and resources of consumption (Van-Hoek, 1999). Byrene and Deeb [1996] also explained the emergence of the green logistics concept: While the term reverse logistics is widely used, other names have been applied, such as reverse
dis-tribution, reverse-flow logistics and green logistics (Byrne & Deeb, 1993). According
to Rodrigue, the reason for wide usage of ”green logistics” term is because it is ”emi-nently desirable” [2001]. Rodrigue [2001] urges that we should become more deliberate about the development of green logistics. His personal opinion about this subject is that
green logistics has still a long way from being achieved. The main reason behind this
is that environment is still not a priority or major preoccupation in the business. Whilst Rodrigue defends his opinion, he attracts attention to the paradoxes between goals and environmental aspects. These are sorted under five headings: Cost, time/flexibility, net-work, reliability and warehousing. They are summarized in Table 3.2 (Rodrigue, Slack, & Comtois, 2001).
Table 3.2: Paradoxes of green logistics (Rodrigue, 2001)
busi-ness world but also in the academic community which he has accused of not being ”green” enough (Rodrigue et al., 2001). Only 4.8% of the logistics focused academic papers be-tween 1997 and 1998 were environmental orientated. These circumstances reflects Ro-drigue’s opinion.
Although not as condemning as Rodrigue [2001]; Wu and Dunn [1999] also describe the situation with same pessimism; ”there is always the trade off between optimal efficiency in
a supply chain and environmental goals”. One of the corroborating examples is that trend
of centralization of the global logistics strategies. Increasing geographical distances, due to centralization of the inventory, trigger greater production of CO2 (Christopher, 1998).
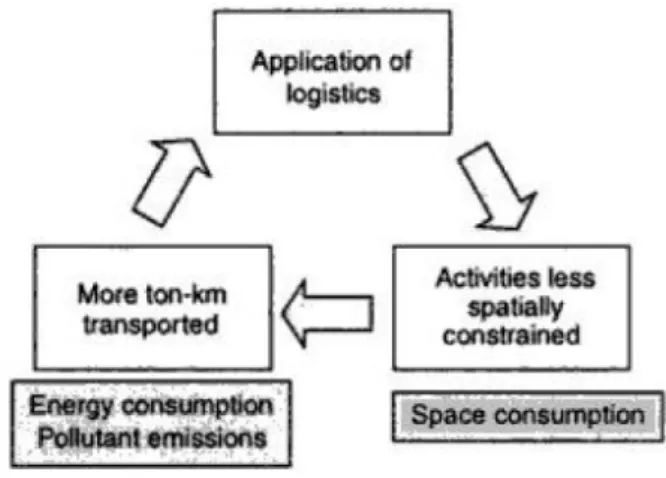
Air and road transportation are attractive options when warehousing is centralized because of their relative speed. Although this reflects positively when product life cycles are considered it must also be noted that they are much more environmentally harmful than the slower alternatives (Aronsson et al., 2008). Rodrigue labels this as the environmental
vicious circle of logistics, as illustrated in table 3.1.
Figure 3.1: The circle of environmental logistics
Having illustrated, Rodrigue’s paradoxes using Christopher’s [1998] centralization of
in-ventory example, we should also give thought to Abrahamsons [1992] idea using the same
example. Increasing distances (as a result of centralization) and emergency deliveries in-fluence the choice of speedier but more environmentally harmful transportation modes (Abrahamsson, 1992). The subject is also boarded by Aransson et al. [2008] who raise the question ”What are the environmental consequences of centralization?”.
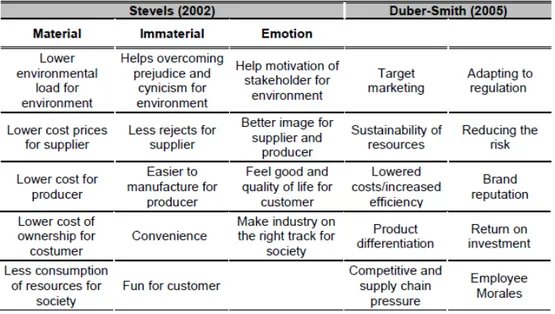
Steveles [2002] and Duber-Smith [2005] choose to describe the benefits of ”green logis-tics” section by section. Steveles forms three subject groups; material, immaterial and emotional. However Duber-Smith prefers to use 10 clauses. Both the Steveles and the Duber-Smith’s clauses are available at Table 3.3.(Steveles, 2002) (Duber-Smith, 2005)
Table 3.3: Benefits of green logistics (Steveles, 2002) (Duber-Smith, 2005)
Considering the conflicting views about green logistics, there is a common point: There are many areas related to both cost and environmental load reduction which could still be developed. Transportation is one of these subjects. For that reason it has been the focus of this study. Selection of the shortest route and the lowest energy consumption for a product between point A and point B is a good example. However, there is a long way to go before attaining a trade-off points between green options and cost. In todays environment it is important to apply both cost and environmental effective solutions without paradoxes.
CHAPTER 4
Current Situation
4.1 Atlas Copco Logistics
Atlas Copco Rock Drills AB operates as a sub-department within Atlas Copco CMT in ¨
Orebro, Sweden, and contains URE, SDE and RTE divisions within the organization. Atlas Copco Rock Drills AB uses only one distribution center as distinct from other sub-divisions. Due to the operational advantage of using one ”Shared Distribution Center” (SDC), all departments of Rock Drill division are located in ¨Orebro.
The SDC is responsible for spare part orders, stocking and delivering to customers (Atlas Copco owns Customer Centers around the world). The SDC arranges their work rou-tine according to the contracts existing between Atlas Copco Rock Drills AB divisions and their suppliers. Therefore, there is no strategic purchasing department in the SDC organization to negotiate with suppliers. Spare parts count for a significant amount of total yearly turnover, with an average of 40%. Sales of spare parts are therefore vital for profitability.
Suppliers & Customers
The SDC works with 600 different suppliers from all around the world. Most suppliers are based in Sweden; there are also a considerable number of suppliers in North America (USA and Canada). 52 of the North American suppliers provide high-volume parts. Major European suppliers are based in Germany, Poland, Slovakia and worldwide suppliers in Japan and Australia. All goods ordered from the suppliers are first collected in the ¨Orebro SDC before being distributed to customers or local warehouses.
of countries.
Figure 4.1: Flow of distribution
The spare part delivery system for EU/EEA countries is called Daily Direct Delivery (DDD). Due to short distances and non existance of customs tariffs between EU/EEA borders, SDC is able to provide a service which delivers spare parts to the customer’s door within 24 hours of ordering. There is a triangle ordering process between EU/EEA customers; local service offices and the SDC which is defined in Figure 4.1.
Figure 4.2: Countries covered by Atlas Copco Customer Centers in green
The other system is for customers located outside Europe, where there are long transport distances as well as customs drawbacks. This create long lead-times and uncertain deliv-ery times. Therefore, local Customer Center offices hold stock of demands for frequently
needed spare parts in case of urgent demands. Local offices obtain spare parts from the SDC in ¨Orebro instead of directly from the suppliers; similarly the customers order and assure spare part for local customer services.
Inventory Management
There are 160.000 different articles counted as products of URE and SDE divisions in spare part range of the SDC. They are separated into two categories which are called SAC1 and SAC3. SAC1 constitute 10% of the inventory with 16.000 items, however; they account for 95% of the total orders. Therefore, SAC1 parts have to be available on stock and the SDC aims for a 96% service level for them. 60% of total SAC1 spare part sales make the Top 2000 which is a list for most frequent orders. Top 2000 parts are checked every day by purchasers for unexpected stock out.
The yearly request level of SAC3 parts is not enough to justify keeping them as stock. Therefore, these products are not ordered from suppliers until customer demand; however, on average 8000 items are available at the warehouse due to back orders and change of order statuses. One of the targets of the SDC is to decrease the number of SAC3 items in the warehouse.
Since the SDC is the only DC for the whole global spare part provider for Atlas Copco CMT customers, the department works with a high number of orders. This amounts to 550 order lines purchased from suppliers per day and 2200 order lines delivered to customers per day. The daily 2200 order lines correspond to 15.400 packages equal 700 tons of spare part, on monthly basis. The delivering performance to the customers is 98,5% (i.e. 98,5% is available on stock).
4.2 Atlas Copco: Transportation
The ¨Orebro Shared Distribution Center is responsible for all transportation and traffic planning between DC’s customer’s local CC’s and vendors. Custom transactions and support are also concurrent duties. Atlas Copco Rock Drill products are used globally; therefore, transportation setups and operations can therefore be complex due to the world-wide usage.
The figures below show inbound logistics amount (shipment number & tonnes) according
to the transportation mode;
• Inbound Air: 2.200 shipments • Inbound Sea: 450 shipments • Inbound Truck: 55.750 shipments
• Total Inbound: 58.400 shipments/year
• Inbound Air: 1.450 tonnes • Inbound Sea: 7.760 tonnes • Inbound Truck: 45.000 tonnes
• Total Inbound: 54.000 tonnes/year
Inbound logistics covers deliveries from suppliers (e.g in US/CA) to the SDC. It is very limited, with local Customer Services dispatching their spare parts to the SDC only four times a year - due to stock exchanges included in inbound operations. Owning inbound transportation, the SDC handles not only spare parts but also rigs and machines parts for assembly for the production side. The rate is approximately 40% for spare parts and 60% for rigs/machines. Transportation modes differ depending on the location of supplier. Truck transportation is popular from European and Swedish suppliers because of door-to-door possibility. Air transportation is preferred because of short lead-times and high flexibility. Additionally, sea transportation has come into practice in 2009 from some suppliers in North America which have overweight products. Inbound shipments amount and volumes are available from 2008.
When considering volumes and amount of shipments the choice between air and sea trans-portation from over-sea suppliers is related to the weight of the goods. Cost advantage is a key reason for the selection of sea transportation of heavy-weight products; whereas air transportation is used more for low-weight goods. Sea transportation is also used for back orders from CC’s.
The figures below show outbound logistics amount (shipment number) according to the transportation mode;
• Outbound Air: 5750 shipments • Outbound Truck: 13900 shipments • Outbound Courier: 41500 shipments • Total Outbound: 61500 shipments/year
Customer satisfaction plays the major role in outbound logistics. Thus, delivery mode selection is made regarding each case. The spare parts are delivered to EU customers in one day (in some cases at most in 2 days) within DDD (Daily Direct Delivery) concept. Transportation mode selection depends on the dimension of the goods, since the deliveries are individual for each customer. Small size packages are shipped by courier as there are a high number of shipment and low volume. Airplane and truck are preferred for larger shipments. Air transportation is the only preferred for customers out side Europe due to short lead-times. Despite sea transportation’s lower tariffs and low CO2 emissions, it is
not preferred because of concerns about customer satisfaction and low local stock.
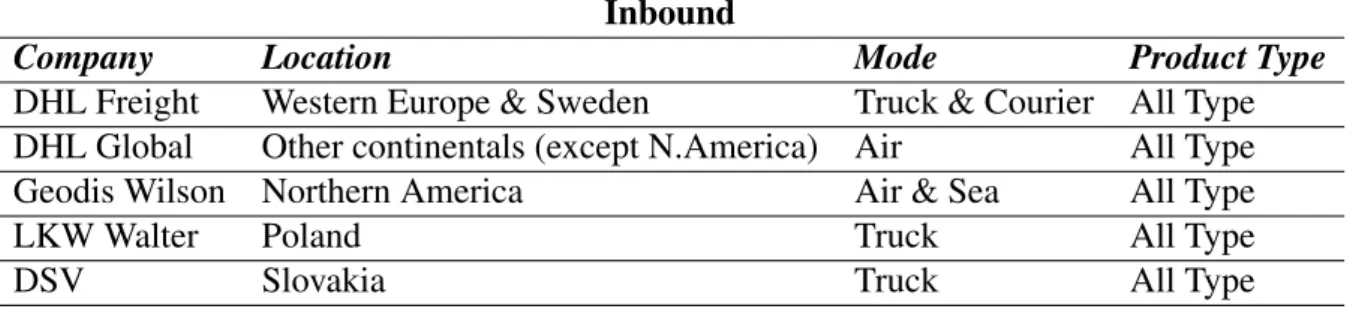
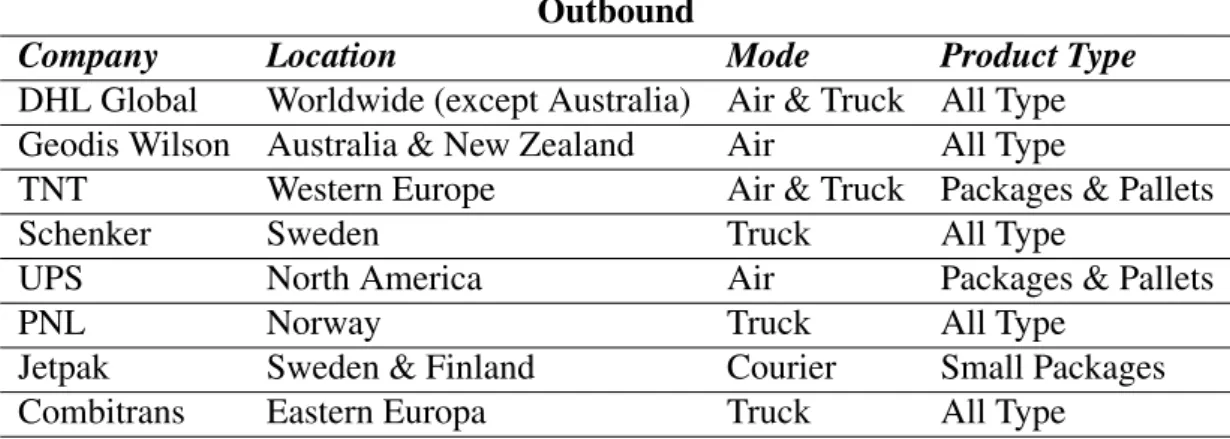
Several freight contractor companies undertake inbound and outbound transportation for Atlas Copco Rock Drills AB. The contracted companies’ service network depends on destination, selected transportation mode and dimension of the goods. Atlas Copco Rock Drills AB prefers to work for long term solutions with their sub-contractors. In addition to price/performance; environmental and custom certificates are significant to the selection of the companies. The SDC requests regular statistics, emission and performance reports for periodic assessments. Below, you can find information about contracted companies, networks, transportation mode and package types.
Inbound
Company Location Mode Product Type
DHL Freight Western Europe & Sweden Truck & Courier All Type DHL Global Other continentals (except N.America) Air All Type Geodis Wilson Northern America Air & Sea All Type LKW Walter Poland Truck All Type DSV Slovakia Truck All Type
Table 4.1: Contracted companies for inbound logistics
Outbound
Company Location Mode Product Type
DHL Global Worldwide (except Australia) Air & Truck All Type Geodis Wilson Australia & New Zealand Air All Type
TNT Western Europe Air & Truck Packages & Pallets Schenker Sweden Truck All Type
UPS North America Air Packages & Pallets PNL Norway Truck All Type
Jetpak Sweden & Finland Courier Small Packages Combitrans Eastern Europa Truck All Type
Table 4.2: Contracted companies for outbound logistics
Geodis Wilson
Geodis Wilson is an contracted company which Atlas Copco Rock Drills AB started to collaborate with in summer 2009 on outbound logistics for North America and inbound traffic from Oceania. As one of the limitations of the thesis is North American suppliers; Geodis Wilson has extra importance for the research.
Geodis Wilson is part of the Geodis group and located in 50 countries with 250 offices world-wide. The company is, with 5000 employees, one of the world’s biggest freight services. Geodis Wilson or Wilson Logistics, the name of the company at establishment, was founded in Gothenburg, Sweden, in 1894.
The cooperation covers shipments from the USA and Canadian suppliers to ¨Orebro DC and from ¨Orebro to Australia and New Zealand. Air and sea transportation modes are a relevant part of the research for inbound logistics. Whilst the SDC makes the decision between air and sea transportation, Geodis Wilson decides on the LCL or CONSOLE mode when the SDC has chosen sea transportation. Currently, air transportation is mostly favoured, however usage of sea transportation has recently started to increase. 75 air deliveries and 25 sea deliveries (23 of them LCL and 2 of them full container) were completed in October 2009.
4.3 Environmental Management
Atlas Copco AB attaches importance to gradually increasing environmental considera-tion. The environmental reflection has been implemented in every department of the
company as part of their structural organization. Every Atlas Copco AB division has its own environmental coordinator who ensures that the company’s environmental policy is followed as well as harmonizing targets with specific requirements for their division.
Figure 4.3: Effects on Environment
Planning
Atlas Copco Rock Drills AB considers legal regulations, laws and appertaining agree-ments to decide upon its environmental policy. The company has employed consultants regarding legal laws and regulations from an contracted company who are obliged to in-form them of changes and updates. The contract company works in close collaboration with the environment coordinator.
The company has accomplished conditions of ISO: 14001 Environmental Management Standards. Therefore, Atlas Copco Rock Drills AB requires the ISO: 14001 certificate as presupposition from its suppliers.
Atlas Copco Rock Drills AB plans and reviews its environmental management annually. Every third quarter, subjects such as changes in production process, investments, reloca-tion of activities are planned for the next period.
![Figure 1.1: CO 2 change by sectors, 2005-2007 [OECD, 2009]](https://thumb-eu.123doks.com/thumbv2/5dokorg/4794042.128525/14.892.268.661.413.693/figure-change-sectors-oecd.webp)