J
Ö N K Ö P I N GI
N T E R N A T I O N A LB
U S I N E S SS
C H O O LJÖNKÖPING UNIVERSITY
Patent Applications
-An empirical study across Swedish municipalities
Master thesis within economics Author: Jon Gustafsson
Tutor: Johan Klaesson
Charlotta Mellander
Magisteruppsats inom nationalekonomi
Titel: Patent ansökningar
Författare: Jon Gustafsson
Handledare: Johan Klaesson och Charlotta Mellander Datum: 2006-01-25
Ämnesord: Patent, human kapital, FoU, tillväxt, innovationer
Sammanfattning
Syftet med den här uppsatsen är att analysera de mest signifikanta faktorerna som har effekt på antalet patentansökningar på kommunnivå i Sverige, med målet att hitta den mest signifikanta av dem. Tre faktorer valdes ut och analyserades mer noggrant. De tre faktorerna var investeringar i FoU gjorda av företag, andelen humankapital och investeringar i FoU gjorda av universitet. Dels testades dessa faktorer mot den beroende variabeln patent ansökningar i tre hypoteser, men framförallt gjorde en stegvis regressions analys, med målet att få fram den viktigaste variabeln. Resultatet av studien visar att inte alla variabler har en positiv effekt på antalet patent ansökningar, vidare indikerar studien att den viktigaste faktorn för att en kommun har många patent ansökningar är en hög andel human kapital.
Master thesis within economics
Title: Patent Applications
Author: Jon Gustafsson
Tutors: Johan Klaesson och Charlotta Mellander
Date: 2006-01-25
Subject terms: Patent, human capital, R&D, growth, innovations
Abstract
The purpose with this thesis was to examine the most significant factors that affect the number of patents applications submitted on a municipality level in Sweden, with the ob-jective to find the most significant of them. Three factors was chosen and analyzed more closely. The three factors was, investments in R&D made by firms, share of human capital and investments in R&D made by universities. Theses factors was tested against the de-pendent variable patent applications in three hypothesis and a stepwise regression model was conducted, with the objective to find the most significant variable. The result of the study, shows that not all of the factors had a positive effect on the number of patent appli-cations, further the study indicated that the most significant factor for a municipality in or-der to have a high number of patent applications, was to have a high share of human capi-tal.
Table of Contents
1 Introduction ...1
1.1 Purpose ...2
1.2 Outline ...2
2 Patents and the nature of innovations ... 3
2.1 Definition of patent ...3
2.2 Nature of innovations...4
2.3 Regional aspects of growth ...5
3 Growth theories and presentation of hypothesis ... 7
3.1 Growth accounting ...7
3.2 Product life cycle ...7
3.3 Research and Development ...8
3.4 Human Capital...9 3.5 Universities ...10 3.6 Presentation of hypothesis...11
4 Empirical Analysis...12
4.1 Presentation of data ...12 4.2 Presentation of variables ...13 4.3 Analysis of data...15 4.4 Multicollinearity ...16 4.5 Stepwise regression ...165 Conclusions ...18
References...19
Appendix 1 ...21
Appendix 2 ...22
Appendix 3 ...22
Figures
Figure 2-1: Different kinds of innovations ...4
Figure 2-2: Different innovations...5
Figure 2-3: Regional growth system...6
Figure 3-1: Presentation of hypothesis...11
Tables
Table 4-1: Top ten municipalities per 1000 individuals 1999 ...12Table 4-2: Presentation of variables...14
Table 4-3: Correlation Matrix ...16
1
Introduction
We are entering a new economy, the competition of standardised products has increased. Therefore innovations have become extra important, to be able to obtain economic growth. This thesis will examine the factors that affect the number of patent applications1
submitted, on a municipality level, with the objective to find the single most important fac-tor. The main logic behind the motivation for adding another paper to the already large lit-erature that examines innovations is that there are a shortage of papers that focus on the number of patent applications on a municipality level, due to the lack of such data histori-cally.
It is well known that technological progress is the prime motor behind economic growth (Romer, 1990). The definition of technology and the underlying knowledge is however re-lated to more uncertainty. Yet, knowledge is important because the accumure-lated knowledge that an individual has can be used to increase productivity in the economy, since it deter-mines how effectively the resources in the production process can be used (Romer, 2001). Today some of the most essential factors for a nation as well as for a region, are the crea-tion and development of new technologies, that are protected with patents (Weidinger, 2004). If they are not protected, other firms or individuals may try to imitate the innova-tion. This would in the long-run lead to that no one, would invest in research and devel-opment, henceforth referred to as R&D, it would cost too much and the potential market would be too small. Another factor that are of great importance is that the Swedish gov-ernment encourage laws and rules that give incitement to invest in R&D, human capital and universities. As earlier research has pointed out these three factors as the most impor-tant, in order to have a high number of innovations. (Wigren et al, 2005)
Both innovation and products cycles are getting shorter and shorter. An innovation starts with an invention2, after some time it will, with a bit of luck, result in an innovation, which
may be either a new product, process or service to the marketplace (Edwards and Gordon, 1984). Innovators who can offer a new innovation, have a good opportunity of success, if the market like the new innovation (Wedinger, 2004). Innovations are very important for firms in terms of competitiveness, profitability and productivity. Knowing the significance of innovations, this thesis will examine how they develop and make a deeper analyze of the three factors R&D, human capital and universities.
1There are no given way to measure innovations, therefore patent applications will be used as the proxy
vari-able for innovations throughout this thesis
2Usually one distinguish between inventions and innovations. Where the invention is the idea and the
1.1
Purpose
The purpose with this thesis is to examine the most significant factors that affect the num-ber of patents applications submitted at the municipality level in Sweden, with the objective to find the most significant of them. The factors that will be examined is investments in R&D made by firms, share of human capital in municipalities and investments in R&D made by universities.
1.2 Outline
The second chapter of this paper will define what a patent is and the nature of innovations. The discussion will also involve the link to regional growth and the importance of having a good innovating climate in the region. In chapter three growth accounting will be pre-sented and underline the importance for innovations. The product life cycle will explain how innovators can profit from their innovations. The three factors: investments in R&D made by firms, share of human capital and investments in R&D made by universities will also be presented with appropriate theory. In the last part of chapter 3 the hypothesis will be presented. In the empirical part the regressions will be analyzed and in chapter 5 some conclusions will be made.
2
Patents and the nature of innovations
First in this chapter the requirements that an invention must meet to be granted a patent, will be presented. Secondly focus will be on exactly what an innovation is and how it develops. An innovation process is gener-ally a very complex process that requires input from many different actors.
2.1 Definition of patent
The link between patent applications and innovations must be established. Innovating ac-tivities are a very complex process and because of this there are no obvious way to measure innovations. Yet research has shown that the best way to measure innovations is to use patent application data. Acs, Anseling & Varga (2002) also shows that patents are a reliable measure of innovation activity. However one disadvantage with patent applications is that it does not measure the quality of innovations. Logically such research should focus on the creation of value of innovations (Linder et al, 2003). Another way to find the quality may be to measure the share of patent applications that actually generate a patent. In this thesis innovations will be measured as the number of patent applications submitted to European Patent Office (EPO).
When an innovator has a new innovation he needs to protect it. Patents give the legal rec-ognition of the ownership to the inventor. So that he can benefit from his originality and efforts (Weidinger, 2004). To come up with a new idea, develop it, make the adjustments needed and finally put it out on the market is a very long and expensive process (Edwards and Gordon, 1984). If a patent is not applied for, new products can be imitated without re-striction and the inventor stands the risk of lose a lot of future revenue (Weidinger, 2004). In this case no one will take the risk of invest in R&D activity since the potential market is too small.
Swedish Patent and Registration office and EPO, grant patents on new technical creations. They give patent based on the shape and utility of the product. This means that not only products but also methods and use, can be granted a patent. An innovator can chose be-tween applying for a national patent or a European patent. A national patent is less costly to apply for compared to a European patent. However a European patent give the legal recognition of the ownership to the inventor all over Europe (Archibuigi & Pianto, 1996). There are three different conditions that need to be fulfilled to be granted a patent. (i) It should be possible to use industrially (it should have technical character, technical effect and be reproducible) (ii) The invention cannot be known somewhere else, i.e. it must be new (iii) It should be different from all existing inventions (Swedish Patent and Registration office, 2005).
Very briefly a patent application process can be described as follows. The first step is to submit an application, which has to be paid for at least one month after it is submitted. The patent office apply a “first to file” policy which means that if two identical applications are handed in around the same time only the first will be granted a patent. This may occur in cluster areas where several firms are doing research about the same products. The next step is that the patent office, use the application fee and search for already existing similar prod-ucts. After 18 months the application becomes public. This means that competitors also will have access to the same information, however they must wait to see if the applying in-novator will be granted a patent or not before they can imitate the product. The next step in the process is the examination of the product, where the patent office examine that the innovation meets all the requirements. If the patent is acceptable the application will be granted a patent. Up to nine months after the application has been granted third parties
may oppose against the decision. Usually it takes around three years before a patent is ac-cepted and the duration of a patent from the date that the application is signed is 20 years (Van Dijk, 1994).
2.2 Nature of innovations
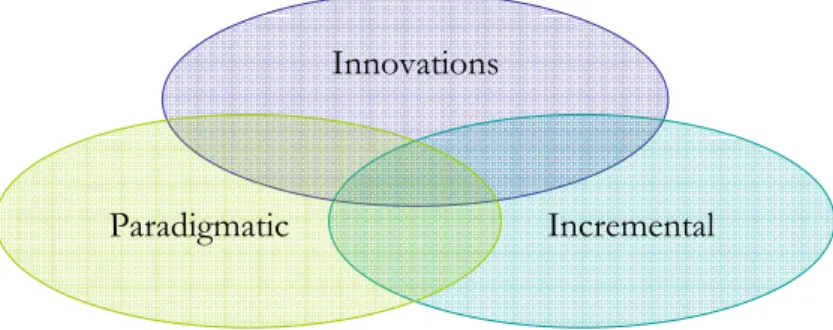
First a distinction between an invention and an innovation will be made. An invention is generally an idea that someone has. After developing an invention it can be an innovation, if the idea can be assigned an economic value. Schumpeter (1911) has made one of the first short summaries of innovation, as a new product or new process, which the consumer is not familiar with. Innovation is in most cases a cumulative process where firms add to their existing stock of knowledge (Carlsson and Jacobsson, 2000). For that reason innovations are developing more easily if the present economic structure are of high-quality, supple-mentary, elements of path dependency are also of large importance. It is also crucial that as many patents get accepted as possible, since innovations are the most important factor for long term growth and for increased welfare (Romer, 1999). Yet, one must also keep in mind when writing about innovations that only a tiny fraction of all patents actually devel-ops to be a product that increases economic growth. Schumpeter made a distinction be-tween paradigmatic and incremental innovations, as can be seen in figure 2-1. Incremental innovations are more common since they take the form of improvements and small steps. A paradigmatic innovation on the other hand is much more unusual. These kinds of inno-vations, has a higher chance of actually develop to be an innovation that increases eco-nomic welfare, since they are defined as breakthrough or radical innovations.
Figure 2-1: Different kinds of innovations
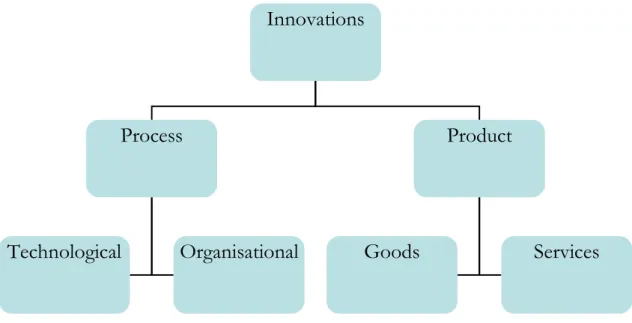
An innovation can take the form of many different aspects, as can be seen in figure 2-2. A major distinction is between product and process innovations. The most common are product innovations. That is incremental- and paradigmatic innovations in terms of new goods and services. The other innovation is process innovations. These refer to ways of producing goods and services and can take the form of either technical or organisational innovations. This means how existing and future products are produced. A technological process innovation refers to innovations of real capital. It may for example be an im-provement in existing goods that increases productivity in its use. Organizational innova-tions are non-material, instead it is changes in the organisainnova-tions that serve to make the firm or institution more productive (Edqvist, Homen and Mckiney 1998).
Innovations
Paradigmatic Incremental
Source: Fischer & Fröhlich, (2001), p. 49
Figure 2-2: Different innovations
The objective with an innovation can also differ. One objective can for example be to in-crease productivity. Being able to obtain the same result or better result, with less effort. Another objective may be to focus more on the quality. Innovations like this may not be more efficient but instead the output has better quality. A third kind of objective is new products. These innovations is of course the most difficult to develop. Historically new products are the result of innovations made by individuals, while efficiency and quality in-novations are the result of investment in R&D (Cohen and Manion, 1989)
2.3 Regional aspects of growth
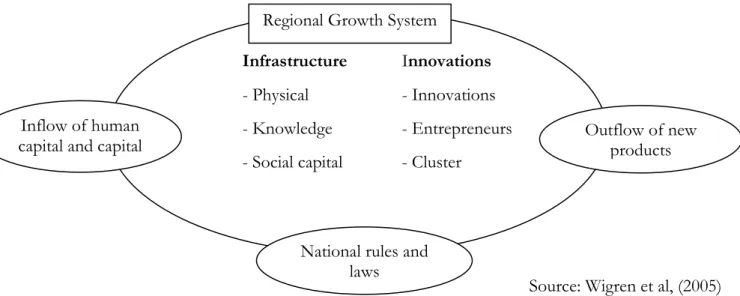
In this section regional growth in terms of innovation activity will be discussed. The eco-nomic growth in a regional perspective is by some means different from growth in a na-tional perspective, in that sense that production factors as labour and capital may be differ-ent allocated geographically within a country. This may lead to differences in a regions ca-pability to host and develop new technologies (Wigren et al, 2005). Kanter (1999) discussed the importance of the three Cs to obtain regional growth; concepts (latest knowledge), competence and connections. Figure 2-3 has the aim of graphically illustrate a regional growth system.
Innovations
Process
Product
Figure 2-3: Regional growth system
Physical infrastructure in a region may for example be buildings, roads, railroads, airports, broadband etc. Knowledge education includes all education from elementary school to universities and even municipal adult education. The third part is social capital. In a region where there are trusts between individuals and firms, R&D activities and innovations will be enhanced (Wigren et al, 2005).
The regional environment for innovations is by definition important. This can be described as the cooperation between researchers, innovators, entrepreneurs, institutions and organi-sations. In a cluster region people can benefit from each other, for example from knowl-edge spillover. Fingleton, Eraydin and Paci (2003) have defined a cluster area as an area, where firms have access to similar firms, research institutes, organizations, technology transfer agencies and complementary factors such as access to customers and suppliers. Providing these facilities are important. A small geographical distance between the different actors in an innovation process will reduce transportation costs and make the process en-hanced. Regional clusters have shown to have an effect on both innovations and economic growth (Archibuigi & Pianto, 1996).
Even though this discussion implies that innovations and the innovation environment is essential it does not tell us exactly how important it is. Therefore the next chapter will pro-vide us with more theory, that has the intention of underline the importance of innovations and how they arise.
Infrastructure Innovations
- Physical - Innovations
- Knowledge - Entrepreneurs - Social capital - Cluster
National rules and laws
Outflow of new products Regional Growth System
Inflow of human capital and capital
3
Growth theories and presentation of hypothesis
This chapter will start with an analysis of growth theory, growth accounting will be presented to underline the importance of innovation to establish economic growth. The product life cycle will be discussed in order to understand why R&D firms tend to locate themselves close to cluster areas where access to institutions is provided. After that the three important variables R&D, human capital and universities will be presented. Fi-nally three hypothesis will be discussed.
3.1 Growth accounting
It is now commonly understood that competitiveness is to a large extent dependent by the ability to generate and sell R&D intensive goods. However examine exactly how much in-novations have contributed to improvements of standard of living is very difficult (Grossman and Helpman, 1991). There are some factors that are more important then oth-ers. Labour productivity very simplified comes down to three factors (i) Capital accumula-tion (ii) Better educaaccumula-tion and (iii) The so-called “residual” (Edqvist & Texier, 1996). Early growth theory did not use the residual and therefore left more than half of the sources of growth unaccounted for. However 1957, Robert Solow found the so called residual even called the solow residual. The residual has many different definitions but the most common one is that it measures the existing stock of knowledge in the economy. Another common definition of the residual is technical change. When productivity sources are examined in growth accounting, capital accumulation and better education usually stands for 40%, where capital accumulation has a slighter higher share. Thus the remaining 60% of labour productivity growth is due to the residual, which means that by far the residual is the most important factor for increased welfare in the long-run. This discussion implies that the most important way to reach economic growth is by innovations, which contributes to in-crease the existing stock of knowledge.
3.2 Product life cycle
The product life cycle captures the process of innovation as well as relocation. In particular it explains that certain regions are more likely to be the localisation base for innovating firms because of advantages in important factors. It also explain when firms tend to relo-cate their production to other countries. The product life cycle was developed in the 1960´s by Vernon and later Hirsch. The basic idea behind the theory is that during the life of a product the demand for different types of knowledge, skills and other inputs, changes in a systematic way. This theory is important to know, when studying why firms wants to inno-vate. The product life cycle consist of three different phases.
The product life cycle starts with an innovation. At the first phase the firms are attracted to cluster areas because the demand for skilled labour is high (Karlsson, 1988). The tion is very unstable, due to that production is unstandardized. At this phase the produc-tion demands qualified workers, to be able to research, experiment and test the product (Andersson, Bjuggren and Ohlsson, 2003). If a region can provide these settings they will be more likely to be the localization base for innovating firms. In the first stage firms tend to compete with the product instead of the price. This means that the product is not price sensitive and the innovator may gain from large benefits when the product reach the mar-ket.
After a while, as Vernon (1966) describes, the product is maturing. This is in the second phase of the product cycle. The production tends to be standardized and the amount of produced units will rise. Firms may invest in machines that will be able to mass-produce.
Since the product have been produced for a while now, the technological progresses slows down and the production techniques become standardized. It demands less R&D invest-ment (Audretsch and Klepper, 2000). The competition will start to increase, since entre-preneurs take notice of the profits that can be made in this market. Now firms need to have access to good transportation systems (Karlsson, 1988).
In the third phase both the product and the production are standardized. Since the produc-tion becomes simple, less developed countries have a comparative advantage in this phase because the labour costs are low and the standardized production demands more labour (Vernon, 1966). In this phase a location where prices of labour and land are low, is most at-tractive for firms (Johansson, 1993). The competition has shifted from product competi-tion to price competicompeti-tion.
This discussion also implies that it is very essential for Sweden to invest much in R&D ac-tivates in order to be in the early phase of the product life cycle. We can also conclude that certain locations offer firms more favourable opportunities for innovation and product de-velopment.
3.3 Research and Development
Innovation is in many cases the result of successful R&D. To understand the value of in-vestments in R&D, consider formula 3-1. This model has been developed among others by Romer (1990) and Grossman and Helpman (1991). Like most growth models this model includes four variables Labour (L), capital (K) technology (A) and output (Y). The R&D model assumes two different sectors one goods producing sector and one explicit R&D sector, were additional inputs to the stock of knowledge are made. Where K denotes the
fraction of capital used in R&D sector and 1- K denotes the fraction of capital used in the goods producing sector. With the same logic L denotes the fraction of labourers used in
R&D sector and 1- L denotes the fraction of capital used in the goods producing sector. The output produced at time t is:
[
] [
]
= 1 ) ( ) 1 )( ( ) ( ) 1 ( ) (t K t A t L t Y K L 0 < < 1 Formula 3-1This formula takes the form of a Cobb-Douglas function.
Since L denotes the fraction of labourers used in the R&D sector, it follows that an in-crease in L would decrease the fraction of labourers used in the goods producing sector, this implies that the quantaties and the quality of innovations should increase. However, Romer (1990) underlined the fact that R&D output also is dependent on the stock of knowledge of the individuals that is devoted to the R&D sector i.e. how many years of education the individuals have.
The fact that increased R&D activity means more innovations can be shown by formula 3-2.
[
(
)
] [
(
)
]
(
)
)
(
t
B
K
t
L
t
A
t
The production of new ideas depends upon on how much labour and capital that is de-voted to R&D and on the level of technology. In this formula (A) denotes the existing level of technology. (B) is a shift parameter. It is possible that there are diminishing returns to scale in this formula. This is because reflects the effect of the existing stock of knowl-edge based on R&D. Therefore may be either positive or negative. When past innova-tions makes it easier to innovate, is positive. Conversely if is negative it may be so that all the easiest discoveries already have been made.
Lundvall (1992) states that innovation systems is a complex process of interactions, ele-ments and relationships. The number and quality of innovations is also dependent on how much money that has been invested. Thus far from all innovations are backed up by in-vestments in R&D or by a large company. According to Schumpeter (1911) the innovation process relies upon the development of a technology of a profit seeking entrepreneur. His-torically major innovations have actually turned out to be the result of extremely talented individuals (Baumol, 1990) .
3.4 Human Capital
The term human capital is difficult to measure, because an individual can gain knowledge from many sources. However human capital is commonly measured as the amount of time an individual has spent in school (Grossman & Helpman, 1991). Therefore the more time an individual spend in school the more human capital he or she will obtain. Human capital can also be defined as practical knowledge, acquired skills and learned abilities that makes the individual more productive.
The main contributors to the field of human capital is the following:
• Arrow 1962 Learning by doing
• Lucas 1988 Education
• Romer 1990 Research
Arrow (1962) examined the link between the economies of learning and increases in pro-ductivity, after the study he was able to define the new resource, stock of knowledge. The study was the first that examined workers who were learning by doing. He found that tech-nical progress may be endogenous and arise from learning by doing and not only by how many years an individual has spent in school. The basic idea is that when individuals pro-duce goods they inevitable think of ways to improve the product and production process. Fingleton, Eraydin and Paci (2003) provide another definition that not only includes learn-ing by dolearn-ing but also learnlearn-ing by interactlearn-ing and learnlearn-ing by imitatlearn-ing. Further they argue that human capital is also dependent on the ability to create, use and transform skills and upgrade its knowledge. This discussion could result in diminishing returns to scale for indi-viduals who are seeking to add more knowledge to their human capital.
The next important contributor was Lucas (1988). He found evidence of the importance of formal learning, such as university studies. He further showed the importance of human capital formation in the mechanism of endogenous growth. He argued that human capital is the root of innovations, economics of scale and technical progress. Further he argued that the accumulation of human capital is the prime factor behind economic growth. Lucas also stated that higher levels of human capital in the economy, would improve the imple-mentation of new technologies. One problem that Lucas found was that if wages for
indi-viduals are relatively low, indiindi-viduals does not want to increase their human capital more, which may result in the consequence that the R&D output are of lower quality. Therefore the future wage that individuals can gain from education is also important.
Romer (1990) showed that individuals also gain a lot of knowledge by research, which sometimes also result in new knowledge. Such work are very important to drive the devel-opment forward. Romer also underlined the importance of universities since most research work are being done there.
3.5 Universities
Universities provide many advantages for firms and individuals that are involved in inno-vating activities. Universities provide knowledge in science, training the labour force and sometimes also, with the help of science parks, supporting spin-off firms. According to OECD (1993) universities has proved to give an effect on new scientific knowledge. Uni-versities are defined as the most critical institution for providing human capital (Fingleton, Eraydin and Paci, 2003).
Carlsson & Jacobsson (2000) argues that technological change is complex and depends on the behaviour of individual firms as well as institutions. When a problem confront an inno-vator during an innovation process, the innoinno-vator will probably first call upon help through known science, stored knowledge, if no help can be found there, the innovator will invest money in R&D to solve the problem (Kline and Rosenberg, 2000). It is in this stage clus-tering of firms, universities and science parks may play an important role to help the inno-vator with their existing knowledge and known science. It is a known fact that firms does very seldom innovate in isolation. Instead firms must interact with a many actors like sup-pliers, customers, competitors, universities, research institutions etc (Wigren et al, 2005). Universities also play an important role as a guaranty that new ideas in the world does not just pass us by. University employees are researching constantly and are forced to always keep track of new developments. Sörlin (1996) points on the fact that Sweden receives as much as 99% of all new knowledge from abroad, which makes it even more important that universities actually take notice of new knowledge. Otherwise there are a risk that impor-tant knowledge would just pass a small country as Sweden. This also makes it more valu-able for firms to locate themselves in a region or municipality where a university exists.
3.6 Presentation of hypothesis
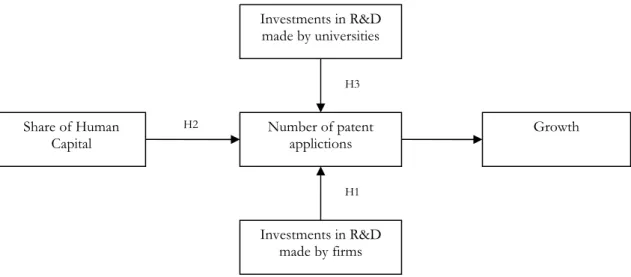
In the earlier sections of this chapter some growth theories has been presented. The impor-tant factors R&D, human capital and universities has also been presented. The reason for that is that these three factors has been established as the most important factors for inno-vations. Therefore these factors will be tested to see if they have a positive relationship with the number of patent applications. In figure 3-1 the hypothesis is presented.
Figure 3-1: Presentation of hypothesis
Hypothesis one (H1) examines whether investments in R&D made by firms is positively associated with the number of patent applications submitted. The logic behind this hy-pothesis is as stated in the R&D section; the production of new ideas depends upon how much labour and capital that is devoted to R&D and on the level of technology.
Hypothesis two (H2) states that a higher share of human capital is positively correlated with the number of patent applications. One of the reasons behind this hypothesis is that human capital is an input in R&D for both firms and universities and as Romer (1990) ar-gued, R&D output is dependent on the stock of knowledge of the individuals devoted to the R&D sector.
Hypothesis three (H3) suggests a positive correlation between the amount of R&D invest-ments made by universities and the amount of patent applications. Since firms tend to turn to stored knowledge before they innovate themselves and it is many advantages for firms to locate themselves close to an area where a university exists.
Yet, the main purpose of this thesis is to find, the most important of the three variables. Therefore most focus in the empirical part, will be devoted to obtain this objective.
Share of Human
Capital Number of patent applictions
Investments in R&D made by firms H2 H3 H1 Investments in R&D made by universities Growth
4
Empirical Analysis
This chapter will start with a presentation of the data and the different variables. After that regressions are conducted and the results are analyzed. Finally the most significant factor behind the number of patent appli-cations is presented.
4.1 Presentation of data
As the dependent variable in this thesis, patent applications will be used. The patent appli-cation statistics is taken from EPO. The statistics involve all appliappli-cations submitted by each municipality in Sweden. The fact that it is more costly to apply for a patent at EPO com-pared to a national patent, may be seen as a quality factor, as it seems logical that applica-tions submitted to EPO are better prepared then applicaapplica-tions submitted to the national patent office. To get an overview of how many patent applications that are actually submit-ted during a year, one can consider table 4-13. In this table the top ten municipalities that
are handing in most patent applications to EPO are presented.
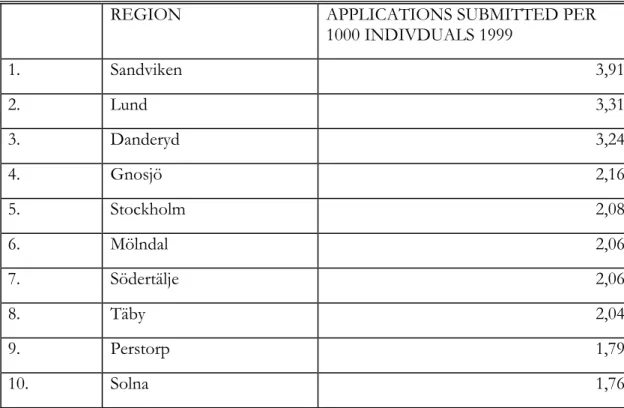
Table 4-14: Top ten municipalities per 1000 individuals 1999
REGION APPLICATIONS SUBMITTED PER
1000 INDIVDUALS 1999 1. Sandviken 3,91 2. Lund 3,31 3. Danderyd 3,24 4. Gnosjö 2,16 5. Stockholm 2,08 6. Mölndal 2,06 7. Södertälje 2,06 8. Täby 2,04 9. Perstorp 1,79 10. Solna 1,76
The average result for a municipality was 0,76 applications, so we can see that the munici-palities in this table are handing in far more applications than the average municipality. This table also show some interesting results. In top we find Sandviken, the result is due to the fact that the very large R&D intense firm, Sandvik, is located there. We can also see signs of clustering, in view of the fact that the Stockholm area has five different municipalities on the list. This may be due to the fact that they can benefit form each other and that there are
3 Totally 6768 applications was submitted 1999
many facilities in this region. It is also possible to see that both Lund and Perstorp is on the list, which also may be a sign of clustering. The next part of this chapter has the intention of analyze the most essential factors for a municipality to submit a high number of patent applications.
4.2 Presentation of variables
The full regression model that will be developed in the following section is not an optimal model, as in an optimal model several factors should be taken into account, when analyzing factors that actually determines the number of patent applications. Such factors should in-clude both measurable factors as well as immeasurable factors. This is evidently an impos-sible task. Instead in line with the theory section presented in this thesis a few variables have been chosen, as more important then others. These variables are assumed to explain some of the differences in patent applications between the municipalities.
The dependent variable that will, as mentioned earlier, be used is patent applications sub-mitted to EPO. The applications are presented as the number subsub-mitted per 1000 individu-als. A problem that occurs when measuring patent applications is to predict how many years innovators need to prepare an application. For example an innovator may get an idea that is very quick to develop. On the other hand some patent applications may need many years of development. Therefore three different regressions will be made, to be able to find a model that capture the effects of investments best. The first regression will use a one year lag. Since, investments in explanatory variables may result in more patent applications after one year. Still, bearing in mind an application may need more time then that, the second re-gression, will be using a four year lag. One can also argue by the same token that it actually may take more then four years to prepare an application. Therefore a regression using a seven year lag will also be conducted. After analyzing the regression results, the model which assumes to capture the variance in patent applications best, will be chosen. This model will be more closely analyzed, to be able to try to draw some conclusions.
The regression that will be developed here has the aim of testing the hypothesis presented in the previous chapter and by using a stepwise regression technique find the most signifi-cant variable. H1 stated that the amount of R&D investments made by firms is positively related to the number of patent applications. To measure this variable a proxy variable that measures the accessibility to R&D investments made by firms5, a municipality have. The
accessibility data is conducted in such a way that not only municipalities that has accessibil-ity to R&D intense firms within the municipalaccessibil-ity can benefit from their results and from knowledge spillover. Instead all municipalities that without too much efforts can benefit from the R&D activity, has been assigned a positive value that are related to the advantage that particular municipality has. Using accessibility data one may also measure parts of clus-tering effects, since many R&D firms tend to locate themselves in the same region or in re-gions close by. There are great advantages using this kind of data, a more reliable result is obtained compared to just measuring R&D investments per firm. Such a measuring method does not take into account that neighbourhood municipalities also benefit from these R&D investments that take place close to themselves.
H2 stated that the level of human capital was positively related to patent applications. This means that the higher share of human capital6 a municipality has, the more patent
applica-tions it will generate.
H3 stated that the amount of R&D investments made by universities7, were associated with
more patent applications. This variable has also been conducted into accessibility data, since the municipalities that lies close to a municipality that hosts a university can benefit from their knowledge. The data set consists of a total number of 286 observations. Con-sider table 4-2 for an overview of the different variables.
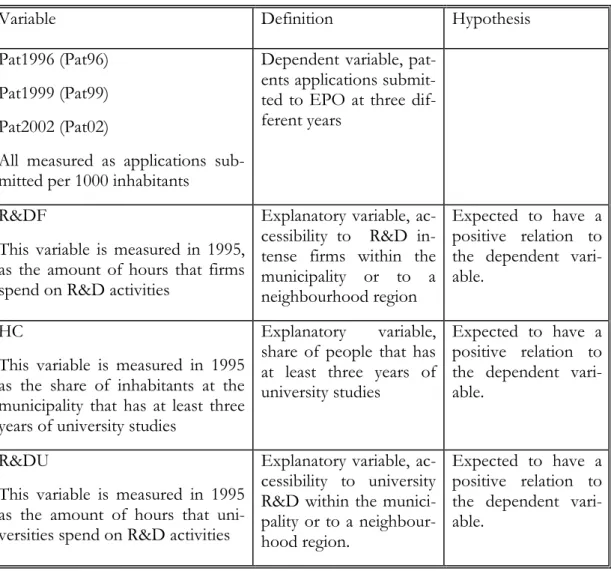
Table 4-2: Presentation of variables
Variable Definition Hypothesis
Pat1996 (Pat96) Pat1999 (Pat99) Pat2002 (Pat02)
All measured as applications sub-mitted per 1000 inhabitants
Dependent variable, pat-ents applications submit-ted to EPO at three dif-ferent years
R&DF
This variable is measured in 1995, as the amount of hours that firms spend on R&D activities
Explanatory variable, ac-cessibility to R&D in-tense firms within the municipality or to a neighbourhood region
Expected to have a positive relation to the dependent vari-able.
HC
This variable is measured in 1995 as the share of inhabitants at the municipality that has at least three years of university studies
Explanatory variable, share of people that has at least three years of university studies
Expected to have a positive relation to the dependent vari-able.
R&DU
This variable is measured in 1995 as the amount of hours that uni-versities spend on R&D activities
Explanatory variable, ac-cessibility to university R&D within the munici-pality or to a neighbour-hood region.
Expected to have a positive relation to the dependent vari-able.
Three different regressions has been conducted. The only changes between them are the dependent variable. Another possible way would have been to also lag the explanatory vari-ables, because these variables may have affect in different time periods too. For example, an increase in the share of human capital may have a quicker result in the number of patent applications than investments in R&D made by universities. However in these regressions 6The term human capital will be measured as the number of individuals that has attended at least three years
of education at university level.
the only variable that will be lagged is the dependent variable while the explanatory vari-ables will be measured in 1995.
i
DU
R
HC
DF
R
Pat
96
=
0+
1&
+
2+
3&
+
i
DU
R
HC
DF
R
Pat
99
=
0+
1&
+
2+
3&
+
i
DU
R
HC
DF
R
Pat
02
=
0+
1&
+
2+
3&
+
The aim of the estimation is to be able to analyze how different levels of variables and proxy variables affect the differences in patent applications and to identify which time ho-rizon that has the most significant result on the number of patent applications.
4.3 Analysis of data
First the outcome of the three different regressions will be presented in order to be able to decide which of the model that is the best one.
Full model 1 adjusted R square =0,254 Full model 2 adjusted R square =0,397 Full model 3 adjusted R square=0,025
When analyzing the different models, first consider the adjusted R square value. This is a measure of how much the explanatory variables actually predicts the variation in the de-pendent variable. Therefore we can first conclude that full model 3, shows a very low ad-justed R square, since it has a value, as low as 0,0258. Therefore we assume that it does not
take seven years for an innovator to prepare an application. Instead full model 1 or 2, is much better since the adjusted R square value is much higher. The adjusted R square value for full model 1 is 0,254, which means that the three explanatory variables explains 25,4% of the variations in patent applications between the different municipalities. Full model 2 has an even higher adjusted R square value of 39,7%. In choosing the best model one can also take into account how many variables that are statistically significant. Doing so it is possible to see that the first two models have two out of three variables, that are signifi-cant9, meaning that the t-value for those variables are at least 2. Since the 2 models had the
same number of significant variables, full model 2 will be considered as the best model, since it has the highest adjusted R square value. As a result in choosing model two, it will be assumed that an innovator needs four years of preparation before an application is sub-mitted. Knowing that patent applications analyzed in this thesis are submitted to EPO, which is costly, four years of preparation seems reasonable.
Before any further tests is conducted we can also conclude that H1 cannot be accepted since the variable R&DF is insignificant. However there are still strong indications that the
8One explanation for this very low value, could be that the data used (patent applications 2002) may have
been incomplete.
variable is positively correlated with the number of patent applications. An explanation for the insignificant value may be that multicollinearity is present. Both H2 and H3 may on the other hand be accepted meaning that there is possible that the relationship between the variables and the dependent variable are significantly different from zero.
4.4 Multicollinearity
Since multicollinearity is common when using economic variables, a correlation matrix ta-ble has been conducted. Multicollinearity may cause prota-blems when analyzing the data. Therefore first consider the computation of correlation matrix that has been conducted in table 4-3. Following Aczel (2002), the correlation matrix is an array of all estimated pair wise correlations between the explanatory variables. It is possible to see that the variables R&DF and R&DU are highly correlated with each other and therefore cause multicollin-earity when both are in the regression equation together. An exact number of how large the multicollinearity between the variables can be, without causing problems is difficult to give.
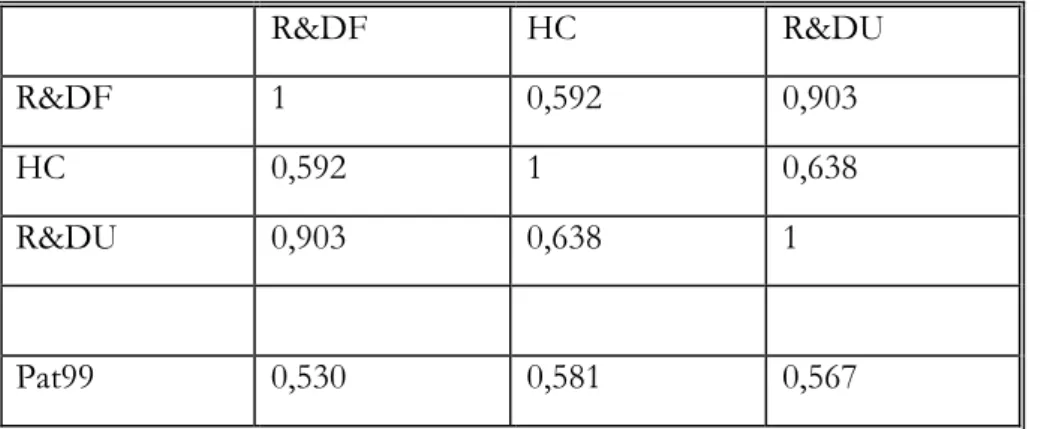
Table 4-3: Correlation Matrix
R&DF HC R&DU
R&DF 1 0,592 0,903
HC 0,592 1 0,638
R&DU 0,903 0,638 1
Pat99 0,530 0,581 0,567
When analyzing table 4-3 we can first conclude that there are high multicollinearity be-tween all variables. We can also see that all the variables have a positive correlation with the dependent variable. This can be seen as an indication on that all the three hypothesis can be accepted. To try to explain the reasons behind the fact that multicollinearity was present is interesting. It is not possible to draw any conclusions form this, yet one may argue that the high values could be interpreted as signs of clustering. The logic is that all three ex-planatory variables are dependent on one another. For example universities as mentioned in the theoretical part, tend to attract R&D intense firms and these two variables usually means a high share of human capital. Therefore the fact that there is high multicollinearity between all variables may be a sign that all parts actually gain from localization close to one another.
4.5 Stepwise regression
Knowing that multicollinearity is present in the comprehensive model that includes all vari-ables, a stepwise regression technique will be used, when analyzing full model 2. This tech-nique is considered to be one of the best techtech-niques when the aim is to test which of the variables that are most important (Aczel, 2002). Using this wholly computerized technique a backward elimination of variables is used. First a full regression model that includes all conceivable and testable influences are made. Then one test on each of the variables is made of the initial full model, to identify the less significant variable. Finally from these
candidate sub-models, the most significant sub-model will be considered, as the "best" ex-planation for the variance in patent applications. Therefore the variable that is not elimi-nated will be considered as the most significant variable.
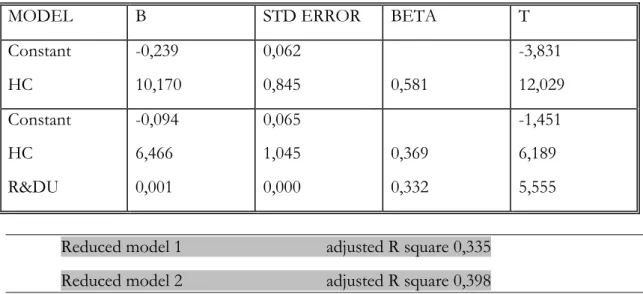
Table 4-4: Excluded variables
MODEL B STD ERROR BETA T
Constant HC -0,239 10,170 0,062 0,845 0,581 -3,831 12,029 Constant HC R&DU -0,094 6,466 0,001 0,065 1,045 0,000 0,369 0,332 -1,451 6,189 5,555
Reduced model 1 adjusted R square 0,335
Reduced model 2 adjusted R square 0,398
The following analyze will focus on the reduced models presented in table 4-410. Using the
stepwise technique, first the variable R&DF was dropped. This reduced model 2 showed an adjusted R square value of 0,398 this can be compared to the full model 2 which had an adjusted R square value of 0,397. This is interesting since the value actually increased as one variable was removed. This also confirms that it was a correct decision to remove the variable R&DF. Further evidence can be gained by the fact that the variable R&DF also was insignificant in full model 2.
The variable R&DU has a t-value of 5,555 in reduced model 2 as can be seen in table 4-4. Since the t-value is higher then 2, H3 can again be accepted. There are evidence that the amount of R&D at universities correlates positively with the number of patent applications. The result highlights the importance of universities. However in further analyze, using a stepwise regression technique the variable R&DU is the next variable to leave the regres-sion.
In the reduced model 1, which is considered the best model there is only one variable left, namely human capital. This leaves us with the conclusion that there are indications on that the most important factor for patent applications is the share of individuals that have stud-ied at least 3 years at university. The t-value of the variable are 6,189. This also implies that H2 can again be accepted. In finding the sources of this result we can go back to Romer (1990) that underlined the importance of human capital, as both R&D intense firms and R&D expenditures at universities demands educated workers to be able to continue their work. He also pointed on the fact that innovations is dependent on the stock of knowledge of the individuals that is devoted to the R&D sector. Further theory earlier in this thesis also stated that not all patent applications are backed up by large investments in R&D. In fact most of the innovations are actually developed by individuals that have an idea of a new product. It also seems reasonable that these individuals have studied at university.
5
Conclusions
The importance of innovations for economic growth is enormous. One evidence of this is the product life cycle theory developed by Vernon, and later Hirsch. At the first stages competition tends to be driven by products instead of price. This is the incitement for in-novators all over the world to innovate, because future payoffs are not assigned with any limits. Many companies and individuals try to invent new innovations in order to be suc-cessful. However developing innovations are often related to high investments, therefore they should be protected by a patent. A patent gives the innovator the legal ownership of the product. To have a large number of innovations is essential for the economy, since some of them hopefully will act as a motor for economic growth and a better standard of living.
The aim of this thesis was to examine different factors that affect the number of patent ap-plications that are submitted and determine the most important factor. Using a variable as patent applications no respect to the quality of innovations are taken, except from the fact that one can argue that applications submitted to EPO are of better quality then applica-tions submitted to national patent offices. The variables that was presented in the theory part of the thesis and later analyzed in the empirical part was: R&D investments made by firms, share of human capital and R&D investments made by universities.
The result indicated that two out of three hypotheses could be accepted. Both the share of human capital and the amount of R&D investments made by universities was positively correlated with the number of patent applications submitted. The hypothesis that R&D in-vestments made by firms was positively correlated with patent applications, could not be accepted because the variable was statistically insignificant. However there are still strong indications on that the variable is positively correlated with the number of patent applica-tions. One indications was the correlation matrix that was conducted and showed the result that all variables was positively correlated with the dependent variable. The fact that the variable was insignificant may be due to the fact of multicollinearity.
Another interesting fact when analyzing the regression model, was that multicollinearity be-tween all explanatory variables were relatively high. It may be a sign that the three variables benefits from one another. A firm that are R&D intensive needs both highly educated em-ployees and are also interested in locating themselves close to a region where a university exist.
Nevertheless the aim of this thesis was to examine the most significant factors that affect the number of patents applications submitted on a municipality level in Sweden, with the objective to find the most significant of them. Using a stepwise technique, the result indi-cated that the most important factor was the share of human capital.
A suggestion for a future interesting topic to analyze may be to focus on the quality of ent applications. One could for example study the relationship between the number of pat-ent applications submitted and the amount of applications that are granted. One could also focus on the creation of value a patent application is giving, even if such data may be very difficult to get. Another interesting topic could be how Sweden could create a good inno-vation climate. Is it possible for the government to increase the quality of innoinno-vations?
References
Acs, Z, Anseling, L, & Varga, A., (2002) Patents and innovation counts as measures of regional
pro-duction of new knowledge Research policy, Vol. 31, no. 7, p. 1069-1085
Aczel, A., (2002) Complete business statistics, Mcgraw-Hill Higher Education, New York Andersson, A, Bjuggren, P-O and Ohlsson, O., (2003), Industriell Ekonom i(Industrial economy, Stockholm: SNS Förlag
Archibuigi, D & Pianto, M., (1996) Innovation surveys and patents as technology indicators: the state
of the art, Innovation, Patents and Technological strategies p. 17-56
Arrow, K., (1962) Economic welfare and the allocation of resources for invention, The rate and direction
of inventive activity: economic and social factors Princeton : Princeton University Press, p. 609-626
Baumol, W., (1990) Entrepreneurship: Productive, Unproductive and Destructive. Journal of Political
Economy 98 (October, Part 1): 893-921
Carlsson, B & Jacobsson, S., (2000) “Diversity creation and Technological Systems: A Technology
Policy Perspective” 266-294
Cohen, L and Manion, L., (1989) Research methods in education. London : Routledge
Edqvist, C, Hommen, L, and Mckelvey, M., (1998) The role of technology and innovation, Ed-ward Elgar Publishing Limited Cheltenham
Edwards, K.L., Gordon, T.J., (1984). Characterization of innovations introduced on the U.S. market
in 1982. U.S. Small Business Administration No. SB-6050-0A-82.
Edqvist, C & Texier, F., (1996) The growth pattern of Swedish industry 1975-1991. 103-122, Tampere
Fingleton, Eraydin and Paci., (2003) Regional Economic Growth, SMEs and the Wider Europe MPG Books Ltd, Bodmin, Cornwall
Fischer, M.M. & Fröhlich, J., (2001). Knowledge Complexity and Innovation Systems.Springer-Verlag Berlin R Heidelberg.
Grossman, G and Helpman, E., (1991) Innovation and growth in the global economy Cambridge, Mass. : MIT Press
Hirsch, S., (1967), Location of Industry and International Competitiveness, Oxford: Clarendon Press
Jones, H., (1975). Modern Theories of Economic Growth, Thomas Nelson & Sons Ltd,Surrey, UK.
Kanter, R.M., (1999). From spare change to real change: the social sector as Beta site for business
inno-vation. Harvard Business Review 77 (3),122–132.
Karlsson, C., (1988), Innovation Adoption and the Product Life Cycle, University of Umeå Kline, S & Rosenberg N., (2000) An overview of innovation 275-305 Cheltenham : Elgar, Lucas, R., (1988) The economics of productivity. Vol. 2, Cheltenham : Elgar, , p. 210-249
Lundvall, B-Å., (1992) National systems of innovation: towards a theory of innovation and interactive
learning. London Pinter
OECD, (1993)., Small and Medium-sized Enterprises: Technology andCompetitiveness, Economic
Co-Operation and Development, Paris.
Romer, P., (1990) Endogenous Technological Change, Journal of Political Economy 98 (October, Part 2): p.71-102
Romer,. D., (2001) Advanced Macroeconomics 2ed, Boston : McGraw-Hill
Schumpeter, J., (1911) The theory of economic Development Cambridge, Mass: Harvard Univer-sity Press. Schumpeter
Solow, R,. (1957) Technical Change and the Aggregate Production Function, Teview of Economics and
Statistics 39: 312-320
Sörlin, S., (1996) Universiteten som drivkrafter: globalisering, kunskapspolitik och dennya intellektuella
geografin, Stockholm: SNS
Van Dijk, T., (1994), The Limits of Patent Protection, Maastricht: Universitaire Pers Maastricht. –I11
Vernon, R., (1966), International Investment and International Trade in the Product Cycle, The
quar-terly journal of economics vol 80, pp 190-207
Wedinger, I., (2004). Disseminatino of information activities of the Austrian Patent Office (APO). Austrian Patent Office, Dresdner Strasse 87, 1200 Vienna, Austria
Wigren, A., Schagerström, T., Johansson, J and Larsson., A (2005)., Tillväxtens drivkrafter. ISA, NUTEK, VINNOVA, Rapport 2005:3
Internet Sources
Appendix 1
Full model 1
PAT96 B STD ERROR BETA T
Constant 0,001 0,075 0,01
R&DF 0,002 0,000 0,292 2,446
HC 5,881 1,205 0,325 4,881 R&DU -0,004 0,000 -0,046 -0,371 R square=0,261 adjusted R square =0,254
Full model 2
PAT99 B STD ERROR BETA T
Constant -0,96 0,065 -1,474
R&DF 0,003 0,000 0,064 0,6
HC 6,436 1,047 0,368 6,147
R&DU 2,5E-6 0,000 0,274 2,444
R square=0,403 adjusted R square =0,397 Full model 3
PAT02 B STD ERROR BETA T
Constant 0,011 0,011 0,990
R&DF 8,58E-6 0,000 0,155 1,139
HC 0,115 0,182 0,048 0,629 R&DU -1,5E-7 0,000 -0,001 -0,009 R square=0,035 adjusted R square=0,025
Appendix 2
Top ten municipalities in submitting patent applications
MUNICIPALITY TOTAL NUMBER OF PATENT
APPLICATIONS 1999 1. Stockholm 1574 2. Göteborg 535 3. Lund 330 4. Uppsala 280 5. Västerås 198 6. Malmö 183 7. Södertälje 179 8. Linköping 147 9. Sandviken 144 10. Täby 123
Appendix 3
Stepwise elimination table
MODEL BETA IN T PARTIAL
CORRELATION TOLERANCE 1 R&DU R&DC 0,032 0,286 5,555 4,974 0,314 0,284 0,593 0,650 2 R&DC 0,064 0,600 0,284 0,184