Optimisation of the railway
alignment considering
vehicle reactions
Paper presented at the International seminars on infrastructure
and vehicle/ infrastructure interaction, 18-19 February 1998
at the Hong Kong Convention and Exhibition Centre, Hong Kong,
, China, organised by the Institution of Civil Engineers
Björn Kufver, VTI, Linköping
Evert Andersson KTH, Stockholm
oo G) 65 Fl N 0
m
.! O >= h IH h :CB mSwedish National Road and ' _
VTI särtryck 302 - 1998
Optimisation of the railway
alignment considering
vehicle reactions
Paper presented at the International seminars on infrastructure
and vehicle/ infrastructure interaction, 18 19 February 1998
at the Hong Kong Convention and Exhibition Centre, Hong Kong,
China, organised by the Institution of Civil Engineers
Björn Kufver, VTI, Linköping
Evert Andersson, KTH, Stockholm
Cover illustration: VTI archives.
The Southern Main Line (left) and Western Main Line (right) in Katrineholm.The diamond crossing constitutes a (non-binding) longitudinal obstacie for the superelevation ramp on the Southern
:;r; Main Line, since cant is not permitted in obtuse
' crossings in Sweden. Also the contrary exure
swgdish I tad am! turnout on the up line of the Southern Main Line
constitutes a (non-binding) obstacle, since the
..?: a spG 138368th i S t t cant excess in the branch line must be limited.
OPTIMISATION OF THE RAILWAY ALIGNMENT CONSIDERING VEHICLE REACTIONS
B Kufver, Railway Systems, VTI, SE-58l95 Linköping, Sweden
E Andersson, Railway Technology, KTH, SE-10044 Stockholm, Sweden
Background
The alignment of a railway has a high degree of permanence. When the alignment is
altered, other technical subsystems, as superstructure, substructure, catenary systems etc.,
must be altered as well. Therefore, changes in alignment are normally associated with high costs. This indicates that the alignment of new railways should be designed to meet future demands, but an unnecessarily high standard may make the project too expensive and cause an undesirable impact on the environment. These facts lead to the conclusion that the alignment should be optimised with great care when building new lines (ref. l).
Levels of analysis
Three levels of analysis have been identified. At Level One, the horizontal alignment (radii of horizontal curves, lengths of transition curves) is fixed and the track engineer is able only to choose the amount of cant.
At Level Two, there are obstacles (existing structures etc.) along the route which must be passed with a predefined clearance. There are possibilities to vary radii and transition lengths, and all alignment alternatives which pass the same set of obstacles (with at least the prede ned clearance) are assumed to be equally costly to build. In comparisons between different alignments, each of these should be evaluated with its most suitable cant according to analysis at Level One.
At Level Three, the obstacles may be removed, in which case the alignment alternatives
will be associated with different construction costs. In such an analysis, it is reasonable to compare the best alignment alternative at each cost level, derived from analysis at Level Two. In this paper, analysis on Level Three will not be described.
Models
Vehicle reactions have been quanti ed with two different methods:
1. A simplified analysis assumes that lateral acceleration within the vehicle body is proportional to the lateral acceleration in the (superelevated) track plane. An effective roll factor (72) describes the relation between the two accelerations. The effective roll factor is assumed to be 1.2 for a conventional passenger coach (Eurofima) and 0.3 for an XZOOO tilting coach. In the simpli ed analysis, the roll angle of the vehicle body and the lateral acceleration are assumed to change linearly on the transition curves.
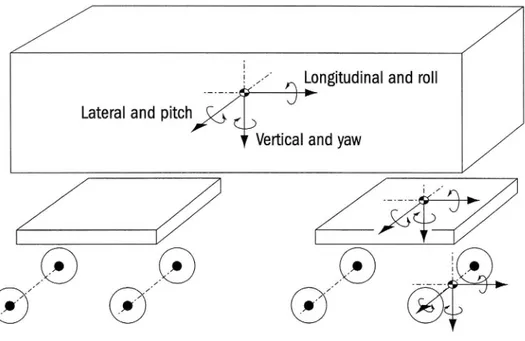
2. A dynamic analysis is conducted with the multibody computer code GENSYS. Vehicle bodies, bogies and wheelsets are modelled as rigid bodies and have six degrees of freedom each (see Figure 1). The track is modelled as a rigid body connected to each wheelset and there is one degree of freedom for each track body: lateral displacement. Hence, this model contains 46 degrees of freedom for each vehicle.
Springs and dampers in the GENSYS model are non linear. Track and vehicle data are published in ref. l. Simulations are conducted in the time domain.
Lateral and pitch
,,,@
,Q)
,@
'
(Ö
(Ö
©
Figure 1. Degrees of freedom of the vehicle model.
Variables and criteria
It has been concluded that, whenever possible, the same variables, the same ltering, the
same statistical evaluation and the same limits should be used when evaluating alignments as when evaluating vehicles (ref. 2). UIC 518 OR (ref. 3) and CEN TC 256 WG 10 (ref. 4) are working on evaluation of track/vehicle interaction and have issued draft standards suggesting evaluation of vertical wheel/rail forces, guiding forces, track shift forces and wheel climbing ratios. The following limits from ref. 3 were applied:
Vertical wheel/rail forces (99.85-percentiles) 170 kN
Track shift forces (99.85-percentiles) lO kN + static axle load/3
Wheel climbing ratio (99.85 percentiles) 0.8
A provisional Swedish limit of 45 kN was used for the 99.85-percentiles of the guiding forces, since both UIC and CEN suggest that only median values of guiding forces be evaluated.
However, in this study, it was considered that in most cases it is not of crucial importance for a railway company to reduce these variables to absolute minima. Instead, it is preferable to use passenger comfort as the object function, in order to minimise the comfort disturbances when passing the curve at a relatively high speed.
Ride comfort
Passenger comfort is of a complex nature. In curve design, where radii, cant and transition lengths are to be chosen, the most suitable single value is Comfort on Curve Transitions (PCT) which takes into consideration steady state lateral acceleration, lateral jerk and roll velocity of the vehicle body (ref. 1).
The PCT functions show the percentage of the passengers who regard the lateral ride as very uncomfortable or uncomfortable on a five-level scale (ref. 5). There is one PCT function for seated passengers and another for standing passengers. The latter, which is used in this study, is:
PCT = max(2.80 -&+ 2.03 3; 1 1.1, 0) + 0.185 - (åf-283
[1]
where y = maximum absolute value of low-pass ltered lateral acceleration of the vehicle body, expressed in per cent of g
y = maximum absolute value of low-pass ltered lateral jerk of the vehicle body, expressed in per cent of g per second
Ö = maximum absolute value of low-pass ltered roll velocity of the vehicle body, expressed in degrees per second
g = gravitational acceleration
Analysis of single curves (clothoid - circle - clothoid combinations)
The analysis assumes the lateral positions of the adjacent straight lines to be xed in positions which are the same for all curve combinations. The analysis also assumes that the lengths of the transition curves are the same at both ends. On these assumptions, the curve geometry can be de ned with two variables, and in this case it is reasonable to use the radius (R) and the length of a transition curve (Lt). ln reality, it may be possible to create compound curves, to have different transition lengths and to alter the positions and directions of the adjacent straight lines. However, sooner or later in the design process the straight lines will be xed, and normally compound curves are neither desirable nor necessary. The element combination and the assumptions made in this discussion correspond to the most frequent case in a design process.
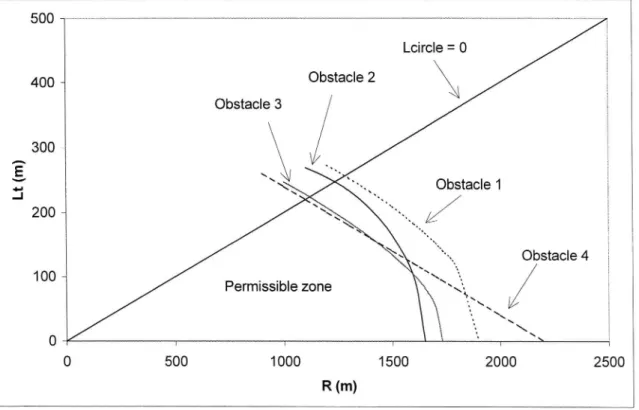
Figure 2 shows a permissible zone for comparing equally costly alignment alternatives, when a number of obstacles along the alignment are considered. The best alignment alternative may be expected to be found on the border de ned by the obstacles, since an R-Lt combination within the zone may be improved by larger radius and/or longer transition curves. At the border, increased lengths of the transition curves always result in a smaller radius. 500 Lcircle = 0 400 _ Obstacle 2 x Obstacle 3 300 \ " _ : \\ Obstacle 1 _.I *
200
Xx
/
\ x
Obstacle 4
100 _
Permissible zone
Xxxx-&_
0
,
I
,
l
. \\
0 500 1000 1500 2000 2500
R (m)
It has been found that obstacles in the middle of the curve and at the end constitute the extremes, requiring the smallest and the largest compensations of radius, when lengthening the transition curves. It has also been found that a smaller angle between the adjacent straight lines requires a larger compensation of radius than a larger angle between the straight lines.
In order to clarify the relations, only one binding obstacle is used in the gures below, and it is placed either in the middle of the curve or at the end. The curve radius (R) at LFl8O m is in the gures 1888 m and these values correspond to the smallest radius and shortest transition for conventional trains running at 200 km/h.
Figure 3 shows PCT values according to the simpli ed analysis, for a curve with an obstacle in the middle of the curve and an angle of 0.5 rad between the adjacent straight lines. PCT (for standing passengers) is calculated for conventional vehicles (fr=l.2) running at 160, 200 and 220 km/h and for tilting vehicles (fr=0.3) running at 220 and 250 km/h. All alignment alternatives are evaluated with the optimal cant (resulting in the lowest possible PCT value), but an upper limit of 150 mm has been applied.
80 _
E
mamfr=1 .2;
70 r
V=16O km/h
60 f
fr=1.2;
: V=200 km/h50 ;
5 40 _a ww%. :l';å>»mfr=1.2; 5 : V=220 km/h & _ 30 % : ' " ' 'fr=0.3;20 _;
v=220 km/h
10
1 - -fr=0.3;
V=250 km/h O 100 200 300 400 500 600 700 800 Lt (m)Figure 3. Simpli ed PCT on a curve with an angle of 0.5 rad and a midpoint obstacle.
On short transition curves, passenger discomfort is caused mainly by high lateral jerk and high roll velocity, while on very long transition curves, the discomfort is caused by high lateral accelerations (since the radius is reduced). A lower effective roll factor results in lower
PCT values, but also in longer optimal transition curves, since the negative effects of small
curve radii are reduced. For the same reason, a higher limit than 150 mm for cant will result in longer optimum transition curves.
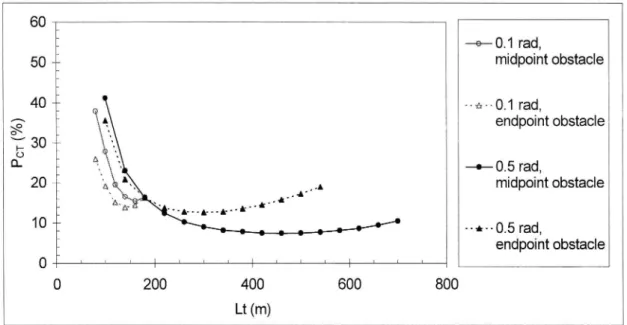
Figure 4 shows PCT values according to the dynamic analysis, for tilting trains running at 250 km/h on curves with an angle of 0.1 and 0.5 rad respectively and with an obstacle placed either in the middle of the curve or at the end. Again, all alignment alternatives are evaluated with the optimal cant. It is found that larger angles between the straight lines and obstacles near the middle of the curve (rather than near the end) favour longer transitions.
In the calculations, the limits for wheel forces and climbing ratio were not exceeded unless the transition curves were far longer than optimum and the cant de ciencies were larger than 415 mm. However, no track irregularities were used in the simulations. Hence, further investigations, including different levels of track irregularities, are necessary.
60 _
Z mew 0.1 rad, 50 midpoint obstacle 40 nal rad, '; : endpoint obstacle o\ _T: 30 T
O _ 0- : 0 0.5 rad, 20 f midpoint obstacle 10 5 --*--O.5 rad, Z endpoint obstacle0 _ '
'
'
l
'
'
'
l '
'
' l
'
'
0 200 400 600 800 Lt (m)Figure 4. PCT for a tilting coach passing curves at 250 km/h. Dynamic analysis.
Conclusions
It has been found that
- large angles between the adjacent straight lines
- obstacles in the middle of the curves (rather than near the ends), and - low roll coef cients of the vehicles
favour longer transition curves, even though the radii must be reduced.
In particular, tilting trains favour longer transitions since the comfort in these trains is less affected by reductions of radii. Generally, train speeds have a low in uence on the optimal lengths of the transition curves.
References
l. KUFVER B. Optimisation of single horizontal railway curves. Procedures involving
vehicle reactions. TRITA-FKT Report 46-1997. KTH, Stockholm.
2. KUFVER B. Variables and criteria for evaluation of vehicle reactions caused by
railway alignment. TRITA-FKT Report 29-1997. KTH, Stockholm /VTI Notat 43-97. VTI, Linköping.
3. UIC. Test and approval of railway vehicles from the points of view of dynamic
behaviour, safety, track fatigue and ride quality. UIC 518 OR (Draft of January 1997). Paris.
4. CEN. Railway applications - Testing for acceptance of running characteristics of
rail-way vehicles - Part 1: Testing of running behaviour. CEN TC 256 WG 10 (Final working draft). Brussels, 1996.
5. HARBOROUGH P R. Passenger comfort during high speed curving - analysis and