VTI meddelande 969A • 2004
Mobile telephone
simulator study
Albert Kircher
Katja Vogel
Jan Törnros
Anne Bolling
Lena Nilsson
Christopher Patten
Therese Malmström
Ruggero Ceci
Publisher: Publication:
VTI meddelande 969A
Published: 2004
Project code: 40459
SE-581 95 Linköping Sweden Project:
Mobilstudy
Author: Sponsor:
Albert Kircher, Katja Vogel, Jan Törnros, Anne Bolling, Lena Nilsson, Christopher Patten, Therese Malmström and Ruggero Ceci
Swedish National Road Administration
Title:
Mobile telephone simulator study
Abstract
The study consists of four separate experiments conducted in the VTI driving simulator. The common theme was to investigate how driver behaviour and traffic safety are influenced when the driver attends to another technical device while driving.
The experiments were concerned with handsfree or handheld mobile phone conversation and dialling, receiving mobile phone SMS messages and watching a DVD film (the latter two being minor pilot experiments). In three of the experiments (mobile phone conversation, SMS, DVD) the partici-pants drove a route which led through urban and rural environments, ranging from 90 km/h rural to 50 km/h urban environments. The urban environments differed in complexity (three levels). The driving distance was about 70 km. The dialling experiment used a rural environment with a speed limit of 110 km/h. The driving distance was about 15 km.
In the main experiment dealing with mobile phone conversation, a number of driving performance measures were analysed: driving speed, variation in lateral position, deceleration, brake reaction time, headway, time to collision, etc. PDT (Peripheral Detection Task) was used as a measure of mental workload.
Mobile phone conversation was found demanding in terms of mental workload. It also had effects on driving. Most effects were quite similar for the two phone modes (handsfree, handheld). Impaired reaction time performance was demonstrated in one of the situations for handheld mode. However, effects were found which could be interpreted as attempts to compensate for the increased workload caused by the mobile phone conversation: speed was reduced (more so for handheld than for handsfree mode), and time and distance headway increased. In spite of these compensatory behaviours, mental workload was still markedly increased by phone use.
In the SMS experiment the participants braked later in one situation when reading the SMS message. No other effects were found in this minor experiment.
In the DVD experiment, mental workload increased when watching the film, although this was compensated for to some extent by the increased distance headway to a lead vehicle. No compensation in terms of reduced driving speed, however, was apparent in this experiment.
In the dialling experiment negative effects on traffic safety were evident from the larger variance of lateral car position during the dialling task for the handsfree phone mode. The mental workload also increased with the dialling task. Compensation in terms of reduced driving speed was apparent for both phone modes.
Utgivare: Publikation:
VTI meddelande 969A
Utgivningsår: 2004
Projektnummer: 40459
581 95 Linköping Projektnamn:
Körsimulatorstudie – mobiltelefon och annan utrustning under körning
Författare: Uppdragsgivare:
Albert Kircher, Katja Vogel, Jan Törnros, Anne Bolling, Lena Nilsson, Christopher Patten, Therese Malmström, Ruggero Ceci
Vägverket
Titel:
Körsimulatorstudie – mobiltelefon Referat
Studien består av fyra separata experiment utförda i VTI:s personbilssimulator. Det gemensamma temat var att undersöka hur körbeteendet och trafiksäkerheten påverkas när föraren ägnar sig åt annan teknisk utrustning under färd.
Experimenten gällde samtal och uppringning med handsfree eller handhållen mobiltelefon, mot-tagande av SMS-meddelanden på mobiltelefonen samt att se på en DVD-film (de två sistnämnda små pilotstudier). I tre av experimenten (samtal med mobiltelefon, SMS, DVD) körde deltagarna en rutt som ledde genom landsbygd och tätort i trafikmiljöer som varierade från 90-väg på landsbygd till 50-väg i tätort. Tätortsmiljöerna varierade i komplexitet (tre nivåer). Körsträckan var ca 70 km. Uppring-ningsexperimentet använde sig av en landsväg med hastighetsbegränsningen 110 km/h. Körsträckan var ca 15 km.
I huvudförsöket som gällde samtal med mobiltelefon analyserades att antal mått på körprestation: hastighet, sidolägesvariation, deceleration, bromsreaktionstid, tidlucka (time headway), följeavstånd (distance headway), tid till kollision, etc. PDT (Peripheral Detection Task) användes som mått på mental belastning.
Samtal med mobiltelefon visade sig ge ökad mental belastning, men hade även effekter på kör-prestationen. De flesta effekterna var likartade för handsfree och handhållen telefon. Försämrad reaktionstid visades i en av trafiksituationerna för handhållen telefon. Emellertid erhölls även resultat som kan tolkas som försök att kompensera för den ökade belastningen av samtalet: hastigheten reducerades (mer för handhållen än för handsfree telefon) och tidluckan och följeavståndet blev större. Trots dessa kompensatoriska beteenden var den mentala belastningen märkbart påverkad av telefon-samtalet.
I SMS-experimentet erhölls en enda effekt; deltagarna bromsade senare i en trafiksituation när de läste SMS-meddelandet.
I DVD-experimentet ökade den mentala belastningen när man tittade på filmen, även om viss kompensation förelåg genom att följeavståndet till framförvarande fordon ökade. Ingen kompensation i termer av minskad hastighet erhölls dock i detta experiment.
I uppringningsexperimentet erhölls negativa effekter ur trafiksäkerhetssynpunkt genom ökad sido-lägesvariation för handsfree telefon. Den mentala belastningen ökade även av uppringningen. Kompensation i form av sänkt hastighet erhölls för såväl handsfree som handhållen telefon.
Andra aspekter av mobiltelefonanvändning under färd återstår att analyseras mer detaljerat, såsom effekter av att påbörja eller avsluta ett samtal, av att leta efter ett telefonnummer, av missöden som att tappa telefonen, etc.
ISSN: Språk: Antal sidor:
Acknowledgements
The study was commissioned by the Swedish National Road Administration and performed by VTI (the Swedish National Road and Transport Research Institute).
The study was headed by a project team from VTI comprising Katja Vogel, Albert Kircher, Lena Nilsson and Anne Bolling. The study was planned by the VTI team in close co-operation with Christopher Patten and Ruggero Ceci of the Swedish National Road Administration.
Mats Lidström of VTI was the creator of the visual system used in the driving simulator trials, and Håkan Jansson of VTI developed the computer programs for the trials. Leif Lantto, VTI, installed all the technical devices needed in this study in the simulator.
The experimental trials were run by Beatrice Söderström, Janet Yakoub, Albert Kircher, Anne Bolling and Katja Vogel, all from VTI. The trials were carried out during November and December 2002.
The main part of the data analysis was performed by Jan Törnros, VTI. Therese Malmström of the Swedish National Road Administration and Albert Kircher, VTI, also took part in the data analysis.
Albert Kircher, Katja Vogel and Jan Törnros were responsible for writing the report. Gunilla Sjöberg, VTI, has edited the report.
I wish to thank everyone who took part in this study. Linköping in June 2004
Anne Bolling Project leader
Contents Page
Summary 19 Sammanfattning 23
Abbreviations and explanations 27
1 Introduction 29
1.1 Background 29
1.2 Issues of the present study 34
1.3 Aims, hypotheses 35 1.4 Method 36 1.4.1 Participants 36 1.4.2 Route 36 1.4.3 Design 38 1.4.4 Driving simulator 40 1.4.5 Effect measures 41 1.4.6 Procedure 44 1.4.7 Statistical analyses 45
2 Mobile phone experiment 46
2.1 Participants 46
2.2 Design 46
2.3 Phone task 46
2.4 Results mobile phone experiment – behavioural effects 48
2.4.1 Analyses 48
2.4.2 Driving speed 49
2.4.3 Brake reaction time performance at events 61
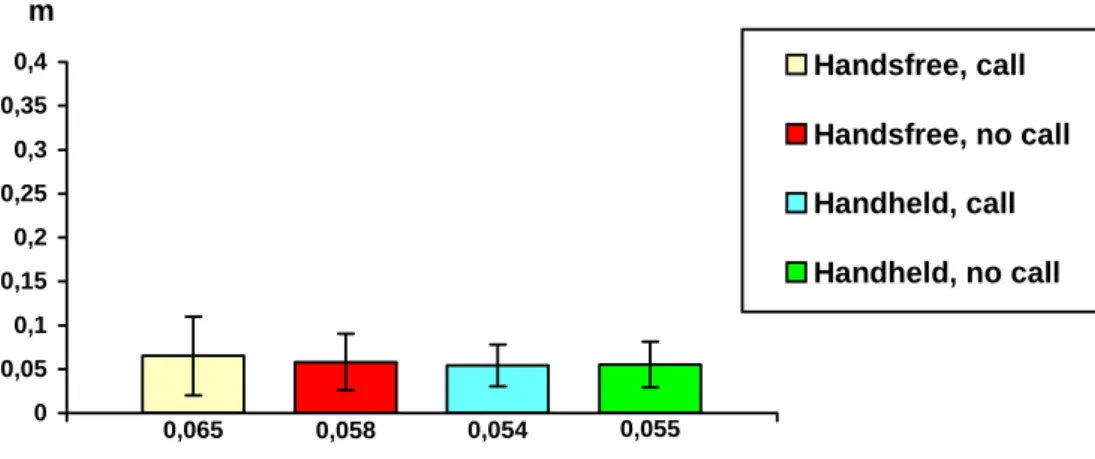
2.4.4 Lateral position variance 64
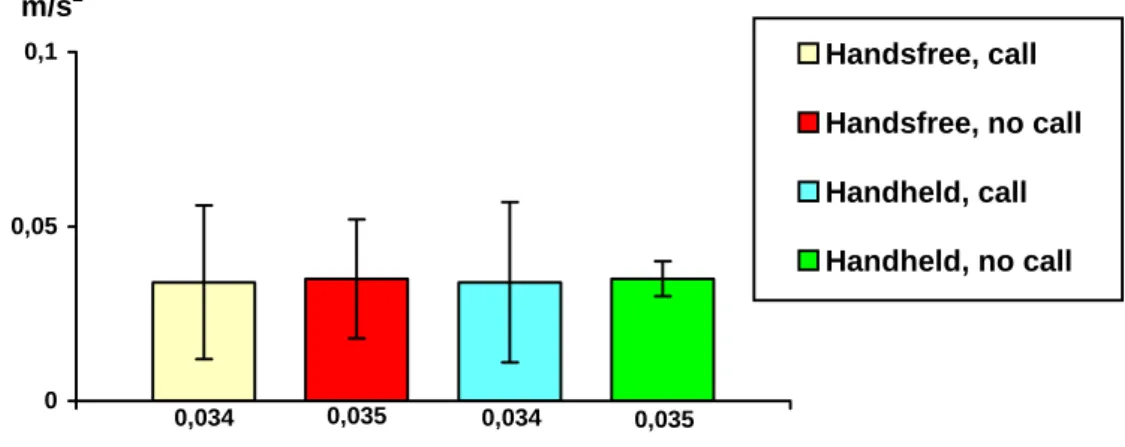
2.4.5 Lateral acceleration 68
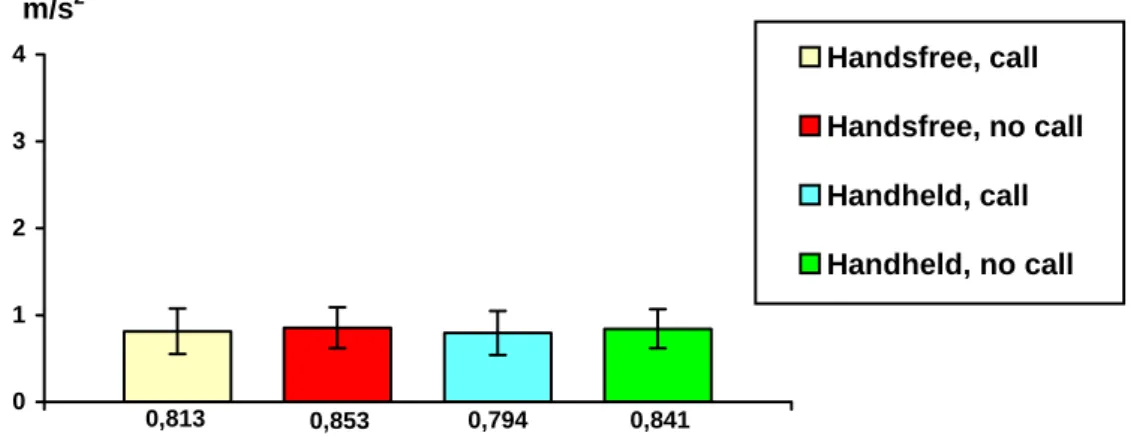
2.4.6 Longitudinal acceleration 77
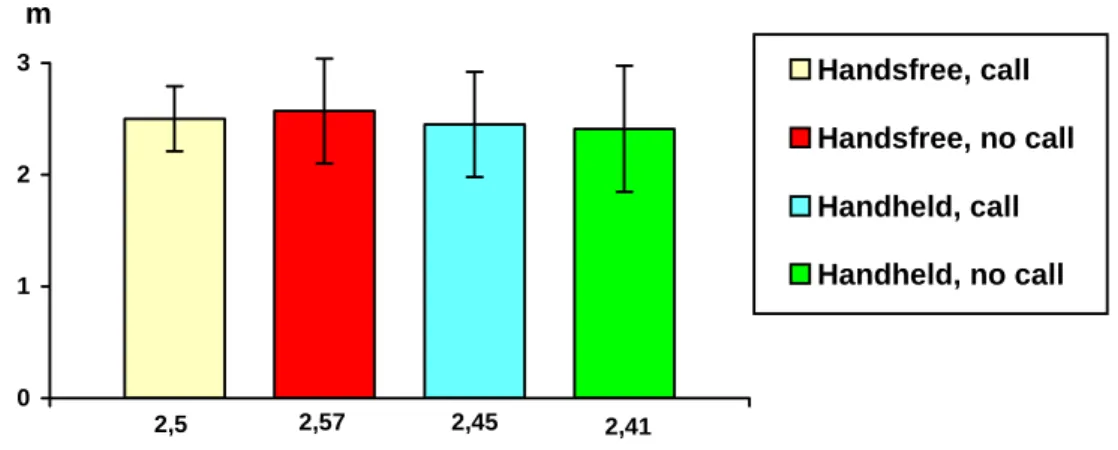
2.4.7 Distance headway 80
2.4.8 Minimum time headway 84
2.4.9 Minimum time to collision 86
2.4.10 Number of participants stopping at events 86
2.4.11 PDT performance 86
2.4.12 Secondary task performance 99
2.4.13 Other results 99
2.4.14 Learning effects on PDT 99
2.5 Plots 100
2.6 Results mobile phone experiment – subjective effects 103
2.6.1 Perceived mental effort 103
2.6.2 Perceived mental effort (phone call during MC situation) 103 2.6.3 Opinion of handsfree and handheld phone 104
2.6.4 Mobile phone use 105
2.6.5 Effects of using mobile phone while driving 108
2.6.6 Performance 111
3 SMS experiment 113
3.1 Participants 113
3.2 Design 113
3.3 SMS task 113
3.4 Results SMS experiment – behavioural effects 114 3.4.1 Brake reaction time performance at events 115 3.4.2 Maximum longitudinal deceleration 116 3.4.3 Number of participants stopping at events 116
3.5 Plots 117
3.6 Results SMS experiment – subjective effects 119
3.6.1 Perceived mental effort 119
3.6.2 Perceived mental effort (SMS during last motorbike
situation) 119
3.6.3 Opinion of SMS 120
3.6.4 SMS use 120
3.6.5 Effects of receiving SMS message while driving 121
3.6.6 Performance 123
3.6.7 Traffic environment 124
3.6.8 Summary of results – Subjective effects 124
4 DVD experiment 125
4.1 Participants 125
4.2 Design 125
4.3 DVD task 125
4.4 Pilot study preceding the DVD experiment 127 4.5 Results DVD experiment – behavioural effects 128
4.5.1 Driving speed 128
4.5.2 Brake reaction time performance at events 132 4.5.3 Maximum longitudinal deceleration 132
4.5.4 Distance headway 132
4.5.5 Minimum time headway 134
4.5.6 Minimum time to collision 135
4.5.7 Number of participants stopping at events 135
4.5.8 PDT performance 136
4.6 Plots 142
4.7 Results DVD experiment – subjective effects 144
4.7.1 Perceived mental effort 144
4.7.2 Perceived mental effort (DVD during last motorbike
situation) 144
4.7.3 Opinion of DVD 144
4.7.4 DVD use 144
4.7.5 Effects of watching DVD while driving 146
4.7.6 Performance 148
4.7.7 Traffic environment 148
5 Dialling experiment 150
5.1 Participants 150
5.2 Dialling task 150
5.3 Questionnaire 152
5.4 Results dialling experiment – behavioural effects 153
5.4.1 Analyses 153
5.4.2 Driving speed 153
5.4.3 Lateral position variance 156
5.4.4 Results for PDT 157
5.5 Results dialling experiment – subjective effects 160
5.5.1 Perceived mental effort 160
5.5.2 Mobile phone use for dialling 160
5.5.3 Effects of using mobile phone while driving 164
5.5.4 Performance 166
5.5.5 Validity 166
5.5.6 Summary of results – Subjective effects 167 6 Comparison between HH, HF, SMS and DVD
experiments 168
6.1 PDT reaction time 168
6.2 Perceived mental effort 169
6.2.1 Perceived mental effort – total route 169 6.2.2 Perceived mental effort at motorbike situation 169
6.3 Reported effort 170
6.4 Reported opinion about the device 171
6.5 Reported driving style change while using the device 172
7 Discussion 173
7.1 Mobile phone conversation experiment 173
7.2 SMS experiment 176 7.3 DVD experiment 177 7.4 Dialling experiment 177 7.5 General points 179 8 Conclusions 181 9 References 182 10 Appendices 185 10.1 Instructions 185
10.1.1 Instruction handsfree phone 185
10.1.2 Instruction handheld phone 186
10.1.3 Instruction SMS 187
10.1.4 Instruction DVD 188
10.1.5 Instruction Handsfree dialling 189
10.1.6 Instruction Handheld dialling 190
10.2 Questionnaires 191
10.2.1 Questionnaire handsfree phone 191
10.3 SMS messages 208
10.4 DVD movie description 208
10.5 Handsfree and handheld phone 209
10.5.1 Questionnaire – perceived mental effort 209 10.5.2 Questionnaire – opinion of handsfree and handheld
phone 209
10.5.3 Differences in opinion between participants using
handsfree and handheld phone 209
10.5.4 Driving speed 210
10.5.5 Brake reaction time performance at events 217
10.5.6 Lateral position variance 218
10.5.7 Lateral acceleration 220
10.5.8 Longitudinal acceleration 223
10.5.9 Distance headway 227
10.5.10 Minimum time to collision 230
10.5.11 Number of participants stopping at events 231
10.5.12 PDT performance 232
10.5.13 Secondary task performance 237
10.5.14 Result summary 238
10.6 SMS 240
10.6.1 Brake reaction time performance at events 240 10.6.2 Maximum longitudinal deceleration 241 10.6.3 Number of participants stopping at events 242
10.6.4 Result summary 242
10.7 DVD 242
10.7.1 Driving speed 242
10.7.2 Brake reaction time performance at events 247 10.7.3 Maximum longitudinal deceleration 248
10.7.4 Distance headway 249
10.7.5 Minimum time headway 250
10.7.6 Minimum time to collision 251
10.7.7 Number of participants stopping at events 251
10.7.8 PDT performance 251
10.7.9 Result summary 255
10.8 Dialling 256
List of tables
Page
Table 1 Technical data of the VTI driving simulator 40Table 2 An example of the complex telephone task 47
Table 3 Performed analyses for the handsfree or handheld mobile phone conversation experiment. The grey fields demarcate those scenes in
which an event occurred 48
Table 4 Description of the two events tested in the pilot study 126
Table 5 Different possibilities to present the phone number for the ring up
experiment 152
Table 6 Effects of phone use on perceived mental effort at last motorbike
situation 209
Table 7 Opinion on phone modes 209
Table 8 Effect of phone use on average speed – paired t-tests 210
Table 9 Comparisons between handsfree and handheld phone – t-tests for
independent samples 210
Table 10 Effect of phone use on average speed – paired t-tests 210
Table 11 Comparisons between handsfree and handheld phone – t-tests for
independent samples 210
Table 12 Effect of phone use on average speed – paired t-tests 210
Table 13 Comparisons between handsfree and handheld phone – t-tests for
independent samples 211
Table 14 Effect of phone use on average speed – paired t-tests 211
Table 15 Comparisons between handsfree and handheld phone – t-tests for
independent samples 211
Table 16 Effect of phone use on average speed – paired t-tests 211
Table 17 Comparisons between handsfree and handheld phone – t-tests for
independent samples 211
Table 18 Effect of phone use on average speed – paired t-tests 212
Table 19 Comparisons between handsfree and handheld phone – t-tests for
independent samples 212
Table 20 Effect of phone use on speed variance – paired t-tests 212
Table 21 Comparisons between handsfree and handheld phone – t-tests for
independent samples 212
Table 22 Effect of phone use on speed variance – paired t-tests 212
Table 23 Comparisons between handsfree and handheld phone – t-tests for
independent samples 213
Table 24 Effect of phone use on speed variance – paired t-tests 213
Table 25 Comparisons between handsfree and handheld phone – t-tests for
independent samples 213
Table 26 Effect of phone use on speed variance – paired t-tests 213
Table 27 Comparisons between handsfree and handheld phone – t-tests for
independent samples 213
Table 28 Effect of phone use on speed variance – paired t-tests 214
Table 29 Comparisons between handsfree and handheld phone – t-tests for
Table 32 Effect of phone use on maximum speed – paired t-tests 214
Table 33 Comparisons between handsfree and handheld phone – t-tests for
independent samples 215
Table 34 Effect of phone use on maximum speed – paired t-tests 215
Table 35 Comparisons between handsfree and handheld phone – t-tests for
independent samples 215
Table 36 Effect of phone use on maximum speed – paired t-tests 215
Table 37 Comparisons between handsfree and handheld phone – t-tests for
independent samples 215
Table 38 Effect of phone use on maximum speed – paired t-tests 216
Table 39 Comparisons between handsfree and handheld phone – t-tests for
independent samples 216
Table 40 Effect of phone use on maximum speed – paired t-tests 216
Table 41 Comparisons between handsfree and handheld phone – t-tests for
independent samples 216
Table 42 Effect of phone use on maximum speed – paired t-tests 216
Table 43 Comparisons between handsfree and handheld phone – t-tests for
independent samples 217
Table 44 Effect of phone use on brake reaction time – paired t-tests 217
Table 45 Comparisons between handsfree and handheld phone – t-tests for
independent samples 217
Table 46 Effect of phone use on brake reaction time – paired t-tests 217
Table 47 Comparisons between handsfree and handheld phone – t-tests for
independent samples 217
Table 48 Effect of phone use on brake reaction time – paired t-tests 218
Table 49 Comparisons between handsfree and handheld phone – t-tests for
independent samples 218
Table 50 Effect of phone use on brake reaction time – paired t-tests (bus) 218
Table 51 Comparisons between handsfree and handheld phone – t-tests for
independent samples (bus) 218
Table 52 Effect of phone use on lateral position variance – paired t-tests 218
Table 53 Comparisons between handsfree and handheld phone – t-tests for
independent samples 219
Table 54 Effect of phone use on lateral position variance – paired t-tests 219
Table 55 Comparisons between handsfree and handheld phone – t-tests for
independent samples 219
Table 56 Effect of phone use on lateral position variance – paired t-tests 219
Table 57 Comparisons between handsfree and handheld phone – t-tests for
independent samples 220
Table 58 Effect of phone use on lateral acceleration variance – paired t-tests 220
Table 59 Comparisons between handsfree and handheld phone – t-tests for
independent samples 220
Table 60 Effect of phone use on lateral acceleration variance – paired t-tests 220
Table 61 Comparisons between handsfree and handheld phone – t-tests for
independent samples 221
Table 62 Effect of phone use on lateral acceleration variance – paired t-tests 221
Table 63 Comparisons between handsfree and handheld phone – t-tests for
independent samples 221
Table 65 Comparisons between handsfree and handheld phone – t-tests for
independent samples 222
Table 66 Effect of phone use on maximum lateral acceleration – paired t-tests 222
Table 67 Comparisons between handsfree and handheld phone – t-tests for
independent samples 222
Table 68 Effect of phone use on maximum lateral acceleration – paired t-tests 222
Table 69 Comparisons between handsfree and handheld phone – t-tests for
independent samples 223
Table 70 Effect of phone use on longitudinal acceleration variance – paired
t-tests 223
Table 71 Comparisons between handsfree and handheld phone – t-tests for
independent samples 223
Table 72 Effect of phone use on longitudinal acceleration variance – paired
t-tests 223
Table 73 Comparisons between handsfree and handheld phone – t-tests for
independent samples 224
Table 74 Effect of phone use on longitudinal acceleration variance – paired
t-tests 224
Table 75 Comparisons between handsfree and handheld phone – t-tests for
independent samples 224
Table 76 Effect of phone use on longitudinal acceleration variance – paired
t-tests 224
Table 77 Comparisons between handsfree and handheld phone – t-tests for
independent samples 225
Table 78 Effect of phone use on maximum longitudinal deceleration – paired
t-tests 225
Table 79 Comparisons between handsfree and handheld phone – t-tests for
independent samples 225
Table 80 Effect of phone use on maximum longitudinal deceleration – paired
t-tests 226
Table 81 Comparisons between handsfree and handheld phone – t-tests for
independent samples 226
Table 82 Effect of phone use on maximum longitudinal acceleration – paired
t-tests 226
Table 83 Comparisons between handsfree and handheld phone – t-tests for
independent samples 226
Table 84 Effect of phone use on maximum longitudinal deceleration – paired
t-tests 227
Table 85 Comparisons between handsfree and handheld phone – t-tests for
independent samples 227
Table 86 Effect of phone use on mean distance headway – paired t-tests. 227
Table 87 Comparisons between handsfree and handheld phone – t-tests for
independent samples 227
Table 88 Effect of phone use on distance headway variance – paired t-tests 228
Table 89 Comparisons between handsfree and handheld phone – t-tests for
Table 93 Comparisons between handsfree and handheld phone – t-tests for
independent samples 229
Table 94 Effect of phone use on minimum time headway – paired t-tests 229
Table 95 Comparisons between handsfree and handheld phone – t-tests for
independent samples 229
Table 96 Effect of phone use on minimum time headway – paired t-tests 229
Table 97 Comparisons between handsfree and handheld phone – t-tests for
independent samples 230
Table 98 Effect of phone use on minimum time to collision – paired t-tests 230
Table 99 Comparisons between handsfree and handheld phone – t-tests for
independent samples 230
Table 100 Effect of phone use on minimum time to collision – paired t-tests 230
Table 101 Comparisons between handsfree and handheld phone – t-tests for
independent samples 231
Table 102 Number of participants stopping at events 231
Table 103 Number of participants stopping at events 231
Table 104 Effect of phone use on PDT reaction time – paired t-tests 232
Table 105 Comparisons between handsfree and handheld phone – t-tests for
independent samples 232
Table 106 Effect of phone use on PDT reaction time – paired t-tests 232
Table 107 Comparisons between handsfree and handheld phone – t-tests for
independent samples 232
Table 108 Effect of phone use on PDT reaction time – paired t-tests 233
Table 109 Comparisons between handsfree and handheld phone – t-tests for
independent samples 233
Table 110 Effect of phone use on PDT reaction time – paired t-tests 233
Table 111 Comparisons between handsfree and handheld phone – t-tests for
independent samples 233
Table 112 Effect of phone use on PDT reaction time – paired t-tests 234
Table 113 Comparisons between handsfree and handheld phone – t-tests for
independent samples 234
Table 114 PDT missed signals – effect of phone use 234
Table 115 PDT missed signals – comparisons between handsfree and handheld
phone 234
Table 116 PDT missed signals – effect of phone use 235
Table 117 PDT missed signals – comparisons between handsfree and handheld
phone 235
Table 118 PDT missed signals – effect of phone use 235
Table 119 PDT missed signals – comparisons between handsfree and handheld
phone 235
Table 120 PDT missed signals – effect of phone use 236
Table 121 PDT missed signals – comparisons between handsfree and handheld
phone 236
Table 122 PDT missed signals – effect of phone use 236
Table 123 PDT missed signals – comparisons between handsfree and handheld
phone 236
Table 124 Comparisons between handsfree (n=24) and handheld phone
(n=22) – Mann Whitney U test 237
Table 126 Results handsfree mobile phone study. Difference between phone
condition and control condition. Statistically significant results (bold), and non-significant results (in parenthesis) 238
Table 127 Results handheld mobile phone study. Difference between phone
condition and control condition. Statistically significant results (bold), and non-significant results (in parenthesis) 239
Table 128 Effect of SMS on brake reaction time – paired t-test 240
Table 129 Effect of SMS on brake reaction time – paired t-test 240
Table 130 Effect of SMS on brake reaction time – paired t-test 240
Table 131 Effect of SMS on brake reaction time – paired t-test 240
Table 132 Effect of SMS on maximum longitudinal deceleration – paired t-test 241
Table 133 Effect of SMS on maximum longitudinal deceleration – paired t-test 241
Table 134 Effect of SMS on maximum longitudinal acceleration – paired t-test 241
Table 135 Effects of SMS on maximum longitudinal deceleration – paired t-test 241
Table 136 Number of participants stopping at events 242
Table 137 Results SMS study. Difference between SMS condition and control
condition. Statistically significant results (bold), and non-significant
results (in parenthesis) 242
Table 138 Effect of DVD use on average speed – paired t-tests 242
Table 139 Effect of DVD use on average speed – paired t-tests 243
Table 140 Effect of DVD use on average speed – paired t-tests 243
Table 141 Effect of DVD use on average speed – paired t-tests 243
Table 142 Effect of DVD use on average speed – paired t-tests 243
Table 143 Effect of DVD use on average speed – paired t-tests 244
Table 144 Effect of DVD use on average speed – paired t-tests 244
Table 145 Effect of DVD use on speed variance – paired t-tests 244
Table 146 Effect of DVD use on speed variance – paired t-tests 244
Table 147 Effect of DVD use on speed variance – paired t-tests 244
Table 148 Effect of DVD use on speed variance – paired t-tests 245
Table 149 Effect of DVD use on speed variance – paired t-tests 245
Table 150 Effect of DVD use on speed variance – paired t-tests 245
Table 151 Effect of DVD use on speed variance – paired t-tests 245
Table 152 Effect of DVD use on maximum speed – paired t-tests 245
Table 153 Effect of DVD use on maximum speed – paired t-tests 246
Table 154 Effect of DVD use on maximum speed – paired t-tests 246
Table 155 Effect of DVD use on maximum speed – paired t-tests 246
Table 156 Effect of DVD use on maximum speed – paired t-tests 246
Table 157 Effect of DVD use on maximum speed – paired t-tests 247
Table 158 Effect of DVD use on maximum speed – paired t-tests 247
Table 159 Effect of DVD use on brake reaction time – paired t-test 247
Table 160 Effect of DVD use on brake reaction time – paired t-test 247
Table 161 Effect of DVD use on brake reaction time – paired t-test 248
Table 162 Effect of DVD use on brake reaction time – paired t-test 248
Table 163 Effect of DVD use on maximum longitudinal deceleration – paired
t-test 248
Table 166 Effect of DVD use on maximum longitudinal deceleration – paired
t-test 249
Table 167 Effect of DVD use on mean distance headway – paired t-test 249
Table 168 Effect of DVD use on distance headway variance – paired t-test 249
Table 169 Effect of DVD use on minimum distance headway – paired t-test 250
Table 170 Effect of DVD use on minimum distance headway – paired t-test 250
Table 171 Effect of DVD use on minimum time headway – paired t-test 250
Table 172 Effect of DVD use on minimum time headway – paired t-test 250
Table 173 Effect of DVD use on minimum time to collision – paired t-test 251
Table 174 Effect of DVD use on minimum time to collision – paired t-test 251
Table 175 Number of participants stopping at events 251
Table 176 Effect of DVD use on PDT reaction time – paired t-tests 251
Table 177 Effect of DVD use on PDT reaction time – paired t-tests 252
Table 178 Effect of DVD use on PDT reaction time – paired t-tests 252
Table 179 Effect of DVD use on PDT reaction time – paired t-tests 252
Table 180 Effect of DVD use on PDT reaction time – paired t-tests 252
Table 181 Effect of DVD use on PDT reaction time – paired t-tests 252
Table 182 PDT missed signals – effect of DVD use 253
Table 183 PDT missed signals – effect of DVD use 253
Table 184 PDT missed signals – effect of DVD use 253
Table 185 PDT missed signals – effect of DVD use 253
Table 186 PDT missed signals – effect of DVD use 254
Table 187 PDT missed signals – effect of DVD use 254
Table 188 Results DVD study. Difference between DVD condition and control
condition. Statistically significant results (bold), and non-significant
results (in parenthesis) 255
Table 189 Results dialling study. Difference between phone condition and control
condition. Statistically significant results (bold), and non-significant
List of figures
Page
Figure 1 Route, events and one setup of phone calls for the study used inthe mobile phone conversation and SMS experiments. The same
route and events were used in the DVD experiment 37
Figure 2 Design of the four experiments (number of participants in parentheses) 39
Figure 3 Inside of the driving simulator with PDT and mobile phone visible 41
Figure 4 PDT response button 42
Figure 5 RSME scale in Swedish and English. The Swedish form was used in the
experiments 44
Figure 6 Mobile phone used in the experiment 46
Figure 7 Average speed at the six situations combined (± SD) 49
Figure 8 Average speed at 90 km/h rural: car following (± SD) 50
Figure 9 Average speed at 90 km/h rural: no event (± SD) 51
Figure 10 Average speed at 70 km/h rural: no event (± SD) 51
Figure 11 Average speed at 50 km/h urban complex: no event (± SD) 52
Figure 12 Average speed at 50 km/h urban medium: no event(± SD) 52
Figure 13 Average speed at 50 km/h urban simple: no event (± SD) 53
Figure 14 Speed variance at the six situations combined (± SD) 53
Figure 15 Speed variance at 90 km/h rural: car following (± SD) 54
Figure 16 Speed variance at 90 km/h rural: no event (± SD) 55
Figure 17 Speed variance at 70 km/h rural: no event (± SD) 55
Figure 18 Speed variance at 50 km/h urban complex: no event (± SD) 56
Figure 19 Speed variance at 50 km/h urban medium: no event (± SD) 56
Figure 20 Speed variance at 50 km/h urban simple: no event (± SD) 57
Figure 21 Maximum speed at the six situations combined (± SD) 57
Figure 22 Maximum speed at 90 km/h rural: car following (± SD) 58
Figure 23 Maximum speed at 90 km/h rural: no event (± SD) 59
Figure 24 Maximum speed at 70 km/h rural: no event (± SD) 59
Figure 25 Maximum speed at 50 km/h urban complex: no event (± SD) 60
Figure 26 Maximum speed at 50 km/h urban medium: no event(± SD) 60
Figure 27 Maximum speed at 50 km/h urban simple: no event (± SD) 61
Figure 28 Brake reaction time at the four situations combined (± SD) 62
Figure 29 Brake reaction time at motorbike situation (± SD) 62
Figure 30 Brake reaction time at bicycle situation (± SD) 63
Figure 31 Brake reaction time at traffic light situation (± SD) 63
Figure 32 Brake reaction time at bus situation (± SD) 64
Figure 33 Lateral position variance at the six situations combined (± SD) 65
Figure 34 Lateral position variance at 90 km/h rural: car following (± SD) 66
Figure 35 Lateral position variance at 90 km/h rural: no event (± SD) 66
Figure 36 Lateral position variance at 70 km/h rural: motorbike (± SD) 67
Figure 37 Lateral position variance at 70 km/h rural: no event (± SD) 67
Figure 38 Lateral position variance at 50 km/h urban simple: bus (± SD) 68
Figure 39 Lateral position variance at 50 km/h urban simple: no event (± SD) 68
Figure 40 Lateral acceleration variance at the six situations combined (± SD) 69
Figure 41 Lateral acceleration variance at 90 km/h rural: car following (± SD) 70
Figure 46 Lateral acceleration variance at 50 km/h urban simple: no event (± SD) 72
Figure 47 Lateral acceleration variance at the six situations combined (± SD) 73
Figure 48 Maximum lateral acceleration at 90 km/h rural: car following (± SD) 74
Figure 49 Maximum lateral acceleration at 90 km/h rural: no event (± SD) 74
Figure 50 Maximum lateral acceleration at 70 km/h rural: motorbike (± SD) 75
Figure 51 Maximum lateral acceleration at 70 km/h rural: no event (± SD) 75
Figure 52 Maximum lateral acceleration at 50 km/h urban simple: bus (± SD) 76
Figure 53 Maximum lateral acceleration at 50 km/h urban simple: no event
(± SD) 76
Figure 54 Longitudinal acceleration variance at the four situations combined
(± SD) 77
Figure 55 Longitudinal acceleration variance at motorbike situation (± SD) 78
Figure 56 Longitudinal acceleration variance at bicycle situation (± SD) 78
Figure 57 Longitudinal acceleration variance at traffic light situation (± SD) 79
Figure 58 Longitudinal acceleration variance at bus situation (± SD) 79
Figure 59 Maximum longitudinal acceleration at the four situations combined
(± SD) 80
Figure 60 Mean distance headway at car following situation (± SD) 81
Figure 61 Minimum distance headway at the two situations combined (± SD) 82
Figure 62 Minimum distance headway at car following situation (± SD) 83
Figure 63 Minimum distance headway at bus situation (± SD) 83
Figure 64 Minimum time headway at the two situations combined (± SD) 84
Figure 65 Minimum time headway at car following situation (± SD) 85
Figure 66 Minimum time headway at bus situation (± SD) 85
Figure 67 Minimum time to collision at the two situations combined (± SD) 86
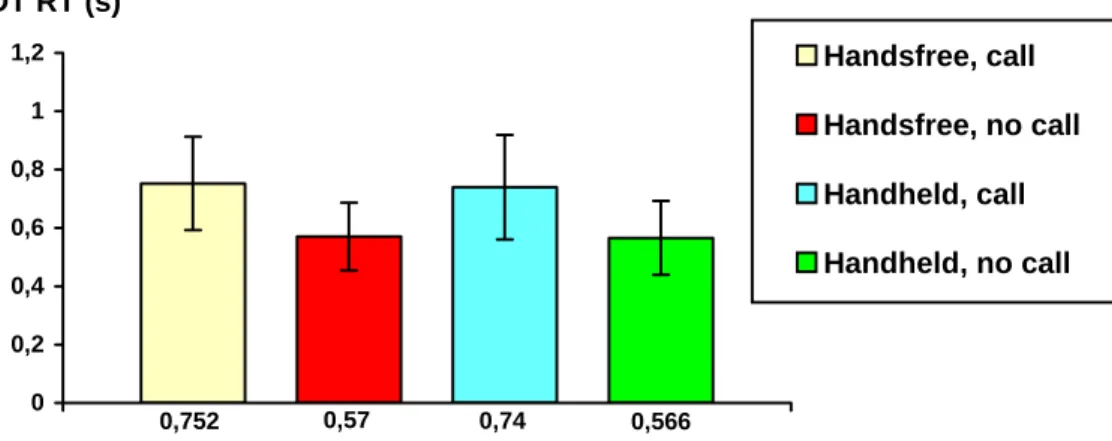
Figure 68 PDT reaction time at the ten situations combined (± SD) 87
Figure 69 PDT reaction time at 90 km/h rural: car following (± SD) 88
Figure 70 PDT reaction time at 90 km/h rural: no event (± SD) 88
Figure 71 PDT reaction time at 70 km/h rural: motorbike (± SD) 89
Figure 72 PDT reaction time at 70 km/h rural: no event (± SD) 89
Figure 73 PDT reaction time at 50 km/h urban complex: bicycle (± SD) 90
Figure 74 PDT reaction time at 50 km/h urban complex: no event (± SD) 90
Figure 75 PDT reaction time at 50 km/h urban medium: traffic light (± SD) 91
Figure 76 PDT reaction time at 50 km/h urban medium: no event(± SD) 91
Figure 77 PDT reaction time at 50 km/h urban simple: bus (± SD) 92
Figure 78 PDT reaction time at 50 km/h urban simple: no event (± SD) 92
Figure 79 Percentage missed signals at the ten situations combined (± SD) 93
Figure 80 PDT Missed signals at 90 km/h rural: car following (± quartile
deviation) 94
Figure 81 PDT Missed signals at 90 km/h rural: no event (± quartile deviation) 94
Figure 82 PDT Missed signals at 70 km/h rural: motorbike (± quartile deviation) 95
Figure 83 PDT Missed signals at 70 km/h rural: no event (± quartile deviation) 95
Figure 84 PDT Missed signals at 50 km/h urban complex: bicycle (± quartile
deviation 96
Figure 85 PDT Missed signals at 50 km/h urban complex: no event (± quartile
deviation) 96
Figure 86 PDT Missed signals at 50 km/h urban medium: traffic light (± quartile
deviation) 97
Figure 87 PDT Missed signals at 50 km/h urban medium: no event (± quartile
Figure 88 PDT Missed signals at 50 km/h urban simple: bus (± quartile
deviation) 98
Figure 89 PDT Missed signals at 50 km/h urban simple: no event (± quartile
deviation) 98
Figure 90 PDT reaction time at different traffic environments 99
Figure 91 Average speed plot for the handsfree part. The event plotted is the traffic light turning to amber when the car approached 100
Figure 92 Average speed plot for the handsfree part. The event plotted is the
bicycle crossing the road 101
Figure 93 Speed development for the handsfree drivers at the traffic light event 101
Figure 94 Average speed plot for the handheld part. The event plotted is the
bicycle crossing the road 102
Figure 95 Speed development for the handheld part in the bus event 102
Figure 96 Perceived mental effort during total route (± SD) 103
Figure 97 Perceived mental effort at last motorbike situation (± SD) 103
Figure 98 Opinion about handsfree phone and handheld phone (± SD) 104
Figure 99 Opinion on handsfree and handheld phone (± SD) 104
Figure 100 Phone use while driving 105
Figure 101 Frequency of phone use 105
Figure 102 Perceived effort (0-100) when talking on the phone (± SD) 106
Figure 103 Preference of phone mode for participants using a handsfree phone 106 Figure 104 Preference of phone mode for participants using a handheld phone 107
Figure 105 Concentration during the phone calls 107
Figure 106 Reported speed change as a result of talking on the phone 108
Figure 107 Headway change as a result of talking on the phone 109
Figure 108 Change of lateral position as a result of talking on the phone 110
Figure 109 Perceived driving performance (± SD) 111
Figure 110 Traffic environment and mobile phone use 111
Figure 111 Pictures of the telephone with two example messages in Swedish
(“Which month comes before November?” and “Which day follows
Wednesday?”) 114
Figure 112 Brake reaction time at motorbike situation (± SD), n=9 115
Figure 113 Brake reaction time at bicycle situation (± SD), n=9 115
Figure 114 Brake reaction time at traffic light situation (± SD), n=5 116
Figure 115 Brake reaction time at bus situation (± SD), n=5 116
Figure 116 Speed of a typical driver in the SMS group at the bus event 117
Figure 117 Speed (black) and side acceleration (red) for a typical driver in
the 90 km/h environment 118
Figure 118 Speed (upper curves) and lateral position (lower curves) of five
drivers in the SMS part. Time when they read the SMS is marked 118
Figure 119 Perceived mental effort at last motorbike situation (± SD) 119
Figure 120 Opinion about SMS (± SD) 120
Figure 121 Reported speed change as a result of reading the SMS message 121
Figure 122 Headway change as a result of reading SMS message 122
Figure 123 Change of lateral position as a result of reading SMS message 123
Figure 126 A screen-shot of an ongoing Tetris game as used in the pilot study.
The sound was turned off and the level of difficulty was set to remain the same throughout the game, even though the speed of the falling
blocks accelerated over time 127
Figure 127 Speed variance (± SD) 129
Figure 128 Speed variance at car following situation (± SD), n=7 129
Figure 129 Speed variance at 90 km/h rural: no event (± SD), n=8 130
Figure 130 Speed variance at 70 km/h rural: no event (± SD), n=8 130
Figure 131 Speed variance at 50 km/h urban complex: no event (± SD), n=3 131
Figure 132 Speed variance at 50 km/h urban medium: no event(± SD), n=7 131
Figure 133 Speed variance at 50 km/h urban simple: no event (± SD), n=7 132
Figure 134 Mean distance headway at car following situation (± SD), n=7 133
Figure 135 Minimum distance headway at car following situation (± SD), n=7 134
Figure 136 Minimum distance headway at bus situation (± SD), n=7 134
Figure 137 Minimum time headway at car following situation (± SD), n=7 135
Figure 138 Minimum time headway at bus situation (± SD), n=7 135
Figure 139 PDT reaction time (± SD), n=8 136
Figure 140 PDT reaction time at 90 km/h rural: car following (± SD), n=6 137
Figure 141 PDT reaction time at 90 km/h rural: no event (± SD), n=7 137
Figure 142 PDT reaction time at 70 km/h rural: motorbike (± SD), n=7 138
Figure 143 PDT reaction time at 70 km/h rural: no event (± SD), n=7 138
Figure 144 PDT reaction time at 50 km/h urban complex: bicycle (± SD), n=7 139
Figure 145 PDT reaction time at 50 km/h urban complex: no event (± SD), n=6 139
Figure 146 PDT reaction time at 50 km/h urban medium: traffic light (± SD), n=6 140 Figure 147 PDT reaction time at 50 km/h urban medium: no event(± SD), n=6 140
Figure 148 PDT reaction time at 50 km/h urban simple: bus (± SD), n=6 141
Figure 149 PDT reaction time at 50 km/h urban simple: no event (± SD), n=6 141
Figure 150 Speed development and average speed for all drivers in the DVD
experiment for the motorbike event 142
Figure 151 Speed development and average speed for all drivers in the DVD
experiment for the bus event 143
Figure 152 Speed development and average speed in the complex urban
environment 143
Figure 153 Perceived mental effort at last motorbike situation (± SD) 144
Figure 154 Reported speed change as a result of watching DVD 146
Figure 155 Headway change as a result of watching the DVD movie 147
Figure 156 Change of lateral position as a result of watching the DVD movie 148
Figure 157 Mobile phone for the dialling experiment 150
Figure 158 Box plot of the mean speed for handsfree and handheld mode 153
Figure 159 Comparison mean speed for handsfree and handheld condition in
the dialling experiment. The red boxes represent where the drivers ring up. Note that the y axis (speed) does not start at zero 154
Figure 160 Speed development in the handsfree condition for all drivers and
averaged curve 155
Figure 161 Speed development in the handheld condition for all drivers and
averaged curve 155
Figure 162 Variance of lateral vehicle position for handsfree and handheld
situation 156
Figure 163 Box plot showing mean PDT reaction time for handsfree and
Figure 164 Box plots showing the number of PDT misses [%] for handsfree and
handheld mode 157
Figure 165 Average PDT reaction over the whole 15 km drive. The boxes
represent when “most” of the drivers ring up, some drivers took longer time to ring up, which explains why the average PDT
reaction is longer also after the red boxes 159
Figure 166 Perceived mental effort (± SD) 160
Figure 167 Dialling while driving 160
Figure 168 Frequency of dialling 161
Figure 169 Perceived effort (0–100) when talking on the phone (± SD) 161
Figure 170 Frequency of looking at the phone while dialling 162
Figure 171 Frequency of dialling errors 162
Figure 172 Frequency of looking at the road while dialling 163
Figure 173 Concentration during dialling 163
Figure 174 Reported speed change as a result of dialling 164
Figure 175 Change of lateral position as a result of dialling 165
Figure 176 Perceived driving performance (± SD) 166
Figure 177 Reported validity 166
Figure 178 Mean PDT reaction time in two experiments in the study – phone
conversation (handsfree vs. handheld phone), DVD (± SD) 168
Figure 179 Perceived mental effort during total route (± SD) 169
Figure 180 Perceived mental effort at motorbike situation (± SD) 169
Figure 181 Box plots of reported effort for mobile phone conversation, SMS
and DVD experiments. The mean values are written in each box
[0 = very low, 100 = very high] 170
Figure 182 Participants’ opinion about the devices studied [0 = very negative,
100 = very positive] 171
Figure 183 Box plots of the participants’ opinion of how well they drove. The
mean values are written in each box (0 = much worse than without device, 50 = equal to without device, 100 = much better than
without device) 172
Figure 184 Typical position in which the mobile phone was held for dialling
Mobile telephone simulator study
by Albert Kircher, Katja Vogel, Jan Törnros, Anne Bolling, Lena Nilsson, Christopher Patten∗, Therese Malmström∗ and Ruggero Ceci∗
Summary
The study consists of four separate experiments that were conducted in the VTI driving simulator. The common theme was to investigate in which way driver behaviour and traffic safety are influenced when the driver attends to another technical device while driving.
The experiments were concerned with handsfree or handheld mobile phone conversation and dialling, receiving mobile phone SMS, and watching a DVD film (the latter two being pilot experiments). In total 66 drivers took part in the experiments: 24 in the handsfree parts (conversation, dialling), 24 in the handheld parts (conversation, dialling), 10 in the SMS experiment, and 8 in the DVD experiment.
In three of the experiments (mobile phone conversation, SMS, DVD), the participants drove a route which led through both urban and rural environments as well as through some transitional passages. The driving distance was about 70 km, and the driving time was about 1 hour and 10 minutes. The traffic environments ranged from 90 km/h rural to 50 km/h urban environment. The urban environ-ments varied in complexity (three levels from slightly to very demanding). In each traffic environment there was an event of special interest: a car following in the 90 km/h rural environment, a motorbike entering the road in the 70 km/h rural environment, a bicycle crossing the road in the complex urban environment, a traffic light turning to red in the urban environment of medium complexity, and a bus entering the road in the urban environment of low complexity. The dialling experiment used a rural environment with a speed limit of 110 km/h, where the participants were required to dial a phone number three times. The driving distance was about 15 km.
In the main experiment dealing with mobile phone conversation a number of driving performance measures were analysed: driving speed, variation in lateral position, deceleration, brake reaction time, headway, time to collision, etc. PDT (Peripheral Detection Task) was used as a measure of mental workload. A number of subjective measures were also analysed. Fewer analyses were made in the other experiments.
Mobile phone conversation experiment
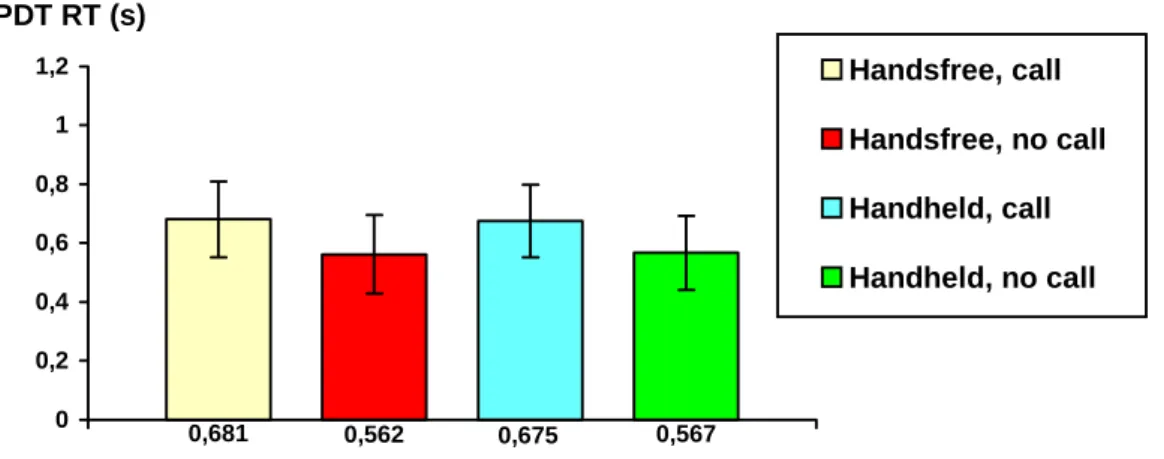
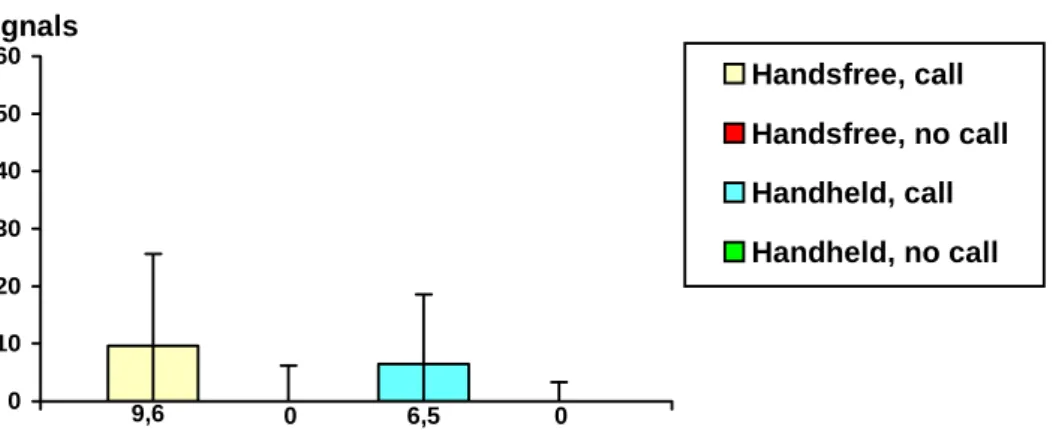
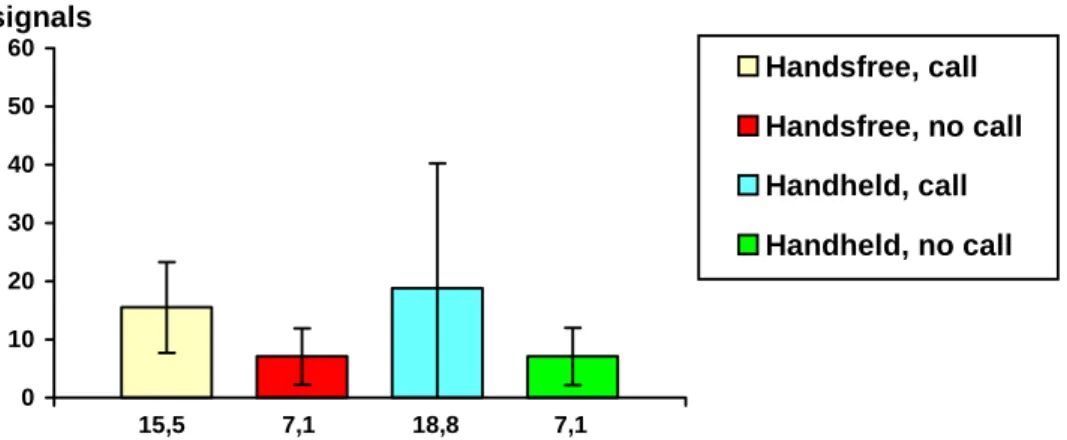
The phone task was a combined calculation and memory task which was experienced as demanding. The main result was that mental workload as mea-sured by PDT (Peripheral Detection Task) – reaction time and missed signals – increased with mobile phone conversation for both handheld and handsfree modes in all traffic environments and in all events. The effects were very similar for the two phone modes.
Lateral control of the vehicle was affected by phone conversation. The lateral position variance decreased for both handsfree and handheld modes. Maximal lateral acceleration decreased for handsfree mode and similar tendencies also appeared partly for the handheld mode. The effects might be interpreted as attempts to compensate for the increased workload. An alternative interpretation is that the decreased lateral position variance is an effect of increased driver alertness. Other explanations seem plausible, however. It might be related to the reduced driving speed, or might be an effect of the steering becoming less prioritised during the phone conversation.
Speed was also affected by phone use. It was reduced for both phone modes in two traffic situations: the rural environment with the highest speed limit (90 km/h) and the urban environment with the highest complexity. Speed was also reduced in the handheld phone mode in two other traffic environments. Although the speed-reducing effect was not significantly different for the two phone modes for any of the traffic situations analysed separately, the speed reduction across all studied traffic environments was different for the two phone modes – it was greater for handheld phone mode. The speed reduction is assumed to be an attempt to compensate for the increased workload caused by the phone conversation. Speed variance across all analysed traffic environments was influenced – it decreased – for handsfree mode only.
Longitudinal interaction with other vehicles was also affected by phone conversation. The brake reaction time in the bus event increased for handheld phone mode. No similar effects were found, however, for the other events that required a reaction from the driver, a result which may be related to reduced speeds in these situations when being engaged in phone conversation, thus giving the driver more time to react to prevent a collision. Minimum time headway and minimum distance headway, measures of longitudinal risk margin, increased as an effect of phone use for both phone modes, a result that can also be interpreted as a compensatory behaviour.
In spite of the attempts to compensate for the increased workload caused by the mobile phone conversation (speed reduction, headway increase), mental workload was still markedly increased by phone use. It is reasonable to assume that the increased mental workload caused by the phone conversation would have negative effects from a traffic safety perspective in terms of reduced readiness to respond should a risky situation suddenly arise. To what extent the reduced speed and/or increased headway would compensate for the reduced readiness is unclear.
Questionnaire answers did not reveal any differences in perceived effort between the handsfree and handheld phone modes, an outcome which supports the results for PDT data showing no difference between the two modes. The opinion of the participants was, however, far more positive towards handsfree phone use than handheld phone use. The subjective driving performance was also rated lower for handheld than for handsfree mode.
SMS experiment
In the SMS pilot experiment the participants read and answered short questions delivered as SMS messages. Brake reaction times in four situations were analysed. The brake reaction time when a motorbike entered the rural road from the right was more than 35% longer when the driver was reading the SMS.
Questionnaire answers showed that the participants had a negative opinion of sending SMS messages from mobile phones in cars, but were more positive to receiving SMS.
The strategy for reading the SMS varied: some participants took the phone as soon as the SMS message arrived and read it, while others waited until they were in a less demanding situation to read the SMS (for example after a crossing). The strategy for reading the SMS is probably very important in terms of traffic safety, for example if the driver waits and takes the phone after a complex situation, or if he or she feels urged to read the message as soon it arrives regardless of the prevailing traffic situation.
DVD experiment
In the DVD pilot experiment the participants were required to watch part of a DVD film (lasting 40 min) and observe certain events which appeared in the film.
It was found that watching the DVD film increased the mental workload of the drivers in most traffic environments.
Longitudinal control was affected by watching the DVD movie. Speed variance over the whole route decreased as an effect of watching the film, thus the participants kept to a more constant speed. The mean speed did not, however, show any effects as a result of watching the DVD film.
Some effects were also found for longitudinal interaction with other vehicles. The mean distance headway and the minimal distance headway in the car following event increased when watching the film, which could be interpreted as a compensatory behaviour.
Questionnaire answers did not reveal any difference between the experienced mental effort when driving while watching the film and driving with the DVD player off. The participants had a very negative opinion about watching films when driving. The participants also reported that they drove worse when watching the DVD movie.
Dialling experiment
In the dialling experiment, the participants were requested to dial a nine-digit phone number on three occasions.
Mental workload increased when dialling a phone number.
Lateral and longitudinal control were affected by dialling. Lateral position variance increased in the handsfree mode, and a similar (non-significant) trend appeared in the handheld mode. In direct comparison between the two modes, however, no difference in lateral position variance was apparent. The result is an indication of reduced safety.
Conclusions
Mobile phone conversation while driving caused increased mental workload. Drivers tried to compensate for the increased workload caused by phone conversation by slowing down and increasing the headway to a lead vehicle in car following. The decreased lateral deviation might also be interpreted as attempts to compensate.
Handsfree and handheld mobile phone use had similar effects on driving performance.
Receiving SMS messages while driving had major negative effects on brake reaction time in the motorbike situation. The effects of a short SMS message from a safety point of view are, however, expected to depend to a significant extent on the strategy used for reading the message.
Watching a DVD movie while driving caused increased mental workload. Drivers tried to compensate for this by increasing the headway to a lead vehicle in car following. There was, however, no tendency to compensate by speed reduction, in spite of the fact that DVD received the highest effort ratings of the studied devices.
The present study concentrated on the analysis of effects of mobile phone conversation on driving. Effects of dialling were studied in a driving session of short duration. Other aspects of mobile phone use while driving, such as starting or finishing a call, looking for a phone number to dial, mishaps like dropping the phone, etc. still remain to be analysed in more detail. A mobile phone with a screen showing black-and-white still images was used. There are, however, newer more advanced types of mobile phone on the market with the capacity to transmit moving images in colour. The risk of interference with the driving task may well increase further with these new phones. This issue would also require detailed study.
The SMS and DVD experiments were pilot studies. These should be followed up by more extensive studies, enabling a more comprehensive analysis of effects of relevance to traffic safety.
Körsimulatorstudie – mobiltelefon
av Albert Kircher, Katja Vogel, Jan Törnros, Anne Bolling, Lena Nilsson, Christopher Patten∗, Therese Malmström∗ och Ruggero Ceci∗
Sammanfattning
Studien består av fyra separata experiment utförda i VTI:s personbilssimulator. Det gemensamma temat var att undersöka hur körbeteendet och trafiksäkerheten påverkas när föraren ägnar sig åt annan teknisk utrustning under färd.
Experimenten gällde samtal och uppringning med handsfree eller handhållen mobiltelefon, mottagande av SMS-meddelanden på mobiltelefonen samt att se på en DVD-film (de två sistnämnda små pilotstudier). Totalt 66 personer deltog i experimenten: 24 i handsfree-delarna (samtal, uppringning), 24 i handhållen-delarna (samtal, uppringning), 10 i SMS-experimentet och 8 i DVD-experimentet.
I tre av experimenten (samtal med mobiltelefon, SMS, DVD) körde deltagarna en rutt som ledde genom både tätort och landsbygd samt genom några över-gångspassager. Körsträckan var ca 70 km, och körtiden var omkring 1 tim 10 min. Trafikmiljöerna varierade från 90-väg på landsbygd till 50-väg i tätort. Tätorts-miljöerna varierade i komplexitet (tre nivåer). I varje trafikmiljö inträffade en händelse av specifikt intresse: en följesituation (car following) på 90-väg i landsbygdsmiljö, en motorcykel som svänger in på en 70-väg i landsbygdsmiljö, en cykel som korsar vägen i den komplexa tätortsmiljön, en trafiksignal som slår om till rött i tätortsmiljön av medelhög komplexitet samt en buss som svänger ut i tätortsmiljön med låg komplexitet. Uppringningsexperimentet använde sig av en landsväg med hastighetsbegränsningen 110 km/h, där deltagarna slog ett telefon-nummer tre gånger under färd. Körsträckan var ca 15 km.
I huvudförsöket som gällde samtal med mobiltelefon analyserades ett antal kör-prestationsmått: hastighet, sidolägesvariation, deceleration, bromsreaktionstid, tidlucka (time headway), följeavstånd (distance headway), tid till kollision, etc. PDT (Peripheral Detection Task) användes som mått på mental belastning. Ett antal subjektiva mått analyserades även. Färre analyser gjordes för övriga experiment.
Experimentet angående samtal med mobiltelefon
Telefonuppgiften var en kombinerad additions- och minnesuppgift som upplevdes krävande.
Huvudresultatet var att den mentala belastningen mätt med PDT (Peripheral Detection Task) – reaktionstid och missade signaler – ökade som en effekt av telefonsamtalet för såväl handhållen som handsfree telefon i samtliga trafikmiljöer och för samtliga händelser. Effekterna var mycket likartade för handhållen och handsfree telefon.
Lateral kontroll av fordonet påverkades av telefonsamtalet. Sidolägesvaria-tionen minskade för såväl handsfree som handhållen telefon. Maximala sido-accelerationen minskade för handsfree telefon och liknande tendenser erhölls
sidolägesvariationen är en effekt av ökad vakenhet. Andra förklaringar är också tänkbara. Effekten kan vara relaterad till den minskade hastigheten eller att styrningen blir mindre prioriterad under samtalet.
Hastigheten påverkades av samtalet. Den minskade för såväl handhållen som handsfree telefon i två trafiksituationer: på 90-väg i landsbygdsmiljö och i tätortsmiljön med den största komplexiteten. Hastigheten minskade även för handhållen telefon i två andra trafikmiljöer. Även om den hastighetsreducerande effekten inte var olika för de två telefonslagen för någon av trafiksituationerna när dessa analyserades separat, var hastighetsminskningen över samtliga trafikmiljöer olika för de två telefonslagen – den var större för handhållen telefon.
Hastighetsminskningen antas vara ett försök att kompensera för den ökade mentala belastningen orsakad av samtalet. Hastighetsvariationen över samtliga analyserade trafikmiljöer påverkades – den minskade – endast för handsfree telefon.
Longitudinell interaktion med andra fordon påverkades även av telefon-samtalet. Bromsreaktionstiden vid busshändelsen ökade för handhållen telefon. Inga liknande effekter erhölls dock för övriga händelser som krävde en reaktion från föraren, ett resultat som kan vara relaterat till minskad hastighet i dessa situationer under samtalet, vilket skulle ge föraren mer tid att hinna reagera för att undvika kollision. Tidluckan (time headway) och följeavståndet (distance headway), mått på longitudinell riskmarginal (risk margin), ökade som effekt av samtalet för såväl handsfree som handhållen telefon, ett resultat som också kan tolkas som ett kompensatoriskt beteende.
Trots försöken att kompensera för den ökade mentala belastningen orsakad av telefonsamtalet (hastighetsminskning, ökad tidlucka och följeavstånd), ökade den mentala belastningen påtagligt som en effekt av samtalet. Det är rimligt att anta att den ökade mentala belastningen orsakad av samtalet skulle ha negativa effekter trafiksäkerhetsmässigt i termer av minskad beredskap att reagera om en riskabel situation plötsligt skulle inträffa. I vilken utsträckning den minskade hastigheten och/eller den ökade tidluckan eller följeavståndet skulle kompensera för den minskade beredskapen är oklart.
Svaren på frågeformulären gav inga skillnader mellan handsfree och hand-hållen telefon, ett resultat som stöder resultaten för PDT-data, som inte visade några skillnader mellan handsfree och handhållen telefon. Deltagarnas åsikter var dock betydligt mer positiva för handsfree än för handhållen telefon. Den upplevda körprestationen bedömdes också vara sämre för handhållen än för handsfree telefon.
SMS-experimentet
I pilotförsöket med SMS läste och besvarade deltagarna korta frågor i form av SMS-meddelanden. Bromsreaktionstiden i fyra situationer analyserades. Broms-reaktionstiden när en motorcykel svängde in på landsvägen från höger var mer än 35 % längre då föraren läste ett SMS.
Svaren på frågeformulär visade att deltagarna hade en negativ inställning till att sända SMS-meddelanden från mobiltelefoner i bilar, men var mer positiva till att ta emot SMS-meddelanden.
Strategin för att läsa ett SMS varierade: vissa deltagare tog telefonen så snart meddelandet anlände och läste det, medan andra väntade tills man befann sig i en mindre krävande situation innan men läste meddelandet (t.ex. efter av korsning).
Strategin för att läsa ett SMS-meddelande är förmodligen mycket viktigt från trafiksäkerhetssynpunkt, t.ex. om man väntar med att ta telefonen tills efter en komplicerad situation eller om man känner sig manad att läsa meddelandet direkt när det anländer oavsett vilken trafiksituation man befinner sig i.
DVD-experimentet
I pilotförsöket beträffande DVD fick deltagarna se på en DVD-film (längd 40 min) och observera speciella händelser som dök upp i filmen.
Det visade sig att den mentala belastningen ökade i de flesta situationer när man tittade på filmen.
Longitudinell kontroll påverkades när man tittade på filmen. Hastighets-variationen över hela sträckan minskade, dvs. deltagarna höll mer konstant hastighet. Medelhastigheten påverkades dock ej.
Vissa effekter erhölls även för longitudinell interaktion med andra fordon. Följeavståndet (distance headway) ökade i följesituationen när man tittade på filmen, vilket kan tolkas som ett kompensatoriskt beteende.
Svaren på frågeformulären visade inga skillnader beträffande upplevd mental ansträngning mellan när man tittade på filmen och när DVD-spelaren var av-stängd. Deltagarna hade mycket negativ inställning till att titta på film medan man kör. Deltagarna rapporterade även att de körde sämre när de tittade på filmen.
Uppringningsexperimentet
I uppringningsförsöket slog deltagarna ett niosiffrigt telefonnummer vid tre till-fällen.
Den mentala belastningen ökade när man slog numret.
Lateral och longitudinell kontroll påverkades av uppringningen. Sidoläges-variationen ökade med handsfree telefon och en liknande (icke-signifikant) trend erhölls för handhållen telefon. I direkt jämförelse mellan handsfree och hand-hållen telefon erhölls dock ingen skillnad vad gäller sidolägesvariation. Resultatet är ett tecken på försämrad säkerhet.
Slutsatser
Samtal med mobiltelefon under körning medför ökad mental belastning.
Deltagarna försökte kompensera för den ökade mentala belastningen orsakad av samtalet genom att sakta ner och öka tidluckan och följeavståndet till fram-förvarande fordon i följesituationen. Den minskade sidolägesvariationen kan också tolkas som försök att kompensera.
Uppringning med mobiltelefon föreföll mer kritisk från trafiksäkerhets-synpunkt. Även om förarna försökte kompensera för den ökade mentala belast-ningen genom att sakta ner, ökade sidolägesvariationen.
Handsfree och handhållen mobiltelefon hade liknande effekter på körpresta-tionen.
Mottagandet av SMS-meddelanden under körning hade klara negativa effekter på bromsreaktionstiden i motorcykelsituationen. Effekterna av ett kort SMS-meddelande trafiksäkerhetsmässigt kan dock förväntas till stor del bero på vilken strategi man använder för att läsa meddelandet.
kompensation genom hastighetsminskning, trots att tittandet på DVD-filmen gav de högsta skattningarna beträffande upplevd ansträngning av de studerade utrust-ningarna.
Föreliggande studie koncentrerade sig på att analysera effekter av samtal med mobiltelefon på bilkörning. Effekter av att ringa upp studerades i en körsession av kort varaktighet. Andra aspekter av mobiltelefonanvändning under körning, som att påbörja eller avsluta ett samtal, att leta efter ett telefonnummer, missöden som att tappa telefonen etc. återstår att analyseras mer i detalj. En mobiltelefon som presenterar svart-vita stillbilder användes. Det finns dock nyare, mer avancerade mobiltelefoner på marknaden som kan sända och motta rörliga bilder i färg. Risken för störande inverkan på köruppgiften kan mycket väl öka med dessa nya telefoner. Även denna frågeställning skulle kräva ett detaljerat studium.
SMS- och DVD-försöken var pilotstudier. Dessa bör följas upp med större studier som möjliggör en mer omfattande analys av effekter av relevans för trafik-säkerheten.
Abbreviations and explanations
VTI The Swedish National Road and Transport Research Institute (Statens väg- och transportforskningsinstitut).
DVD Digital Versatile Disc. SMS Short Message Service.
TTC Time to Collision. A parameter denoting the remaining time until two objects collide when neither of the objects takes evasive action. The objects have to be on a collision course for this parameter to exist. TH Time Headway. The time necessary for a vehicle to reach the point
where the preceding vehicle is. In the present study, however, it is defined as the time necessary for the front of the following vehicle to reach the point of the rear of the preceding vehicle. To calculate the time headway the distance between the two vehicles is divided by the speed of the following vehicle.
Distance Headway
The distance between the front part of a vehicle and the front part of the preceding vehicle. In the present study, however, distance headway denotes the distance between the rear of the preceding vehicle and the front of the following vehicle.
Handheld (HH)
When the mobile phone is held with one hand to the ear of the user. Handsfree
(HF)
A system of an external microphone and loudspeaker making it unnecessary for the user to hold the mobile phone. This allows a conversation to be held without holding the receiver. In this study, “handsfree” indicates that the telephone was placed in a holder mounted on the dashboard.
Standard Deviation (SD)
A measure of dispersion around the mean. In a normal distribution, 68% of cases fall within one SD of the mean and 95% of cases fall within 2 SD.
For example, if the mean age is 45, with a standard deviation of 10, 68% of the cases would be between 35 and 55, and 95% of the cases would be between 25 and 65 in a normal distribution.
Variance A measure of dispersion around the mean, equal to the sum of squared deviations from the mean divided by one less than the number of cases.
∑
= − − = n i i x x n 1 2 2 ) ( 1 1 σwhere n is the number of samples, xi is the value of sample i, x is the
mean of the samples, and σ2 is the variance.