School of Innovation Design and Engineering
V¨asterås, Sweden
Thesis for the Degree of Master of Science in Engineering
- Dependable Systems 30.0 credits
RELIABILITY OF DISCERNING HUMANS
USING MICROWAVE POLARISATION AND
DIFFRACTION PHENOMENA
Susanne Lindgren
sln14013@student.mdh.se
Examiner:
Nikola Petrovic
M¨alardalen University, V¨asterås, Sweden
Supervisor:
Per Olov Risman
M¨alardalen University, V¨asterås, Sweden
Abstract
Presented here is an examination of the feasibility to utilise basic microwave phenomena for reliable human discernment. Being able to distinguishing a person from other objects is essential around society. For example, near railway tracks where lives could be saved if a system could alert the driver. Microwave technology has several benefits over other detection systems. For example, it allows completely anonymous detection. Microwaves are also insensitive to darkness, bright sunlight, and rain. The principles of antenna polarisation and diffraction phenomena have been investigated with the purpose of locating parameters that can reliable discern a human. By modelling analysis, calculations, examination of related work and measurements, it has been seen that a large number of parameters affect the diffracted fields that occurs around an object under some circumstances. For impartial comparison and the ability to change single parameters at a time, a human phantom has been investigated and constructed. Modelling analysis has been performed in order to visualise how the diffraction changes due to the relationship between object circumference and wavelength, and also due to the dielectric properties of the object. The diffracted fields caused by two different frequencies has been compared, giving a difference signal that in a certain range is potentially reliable for human discernment. Analysis of the measurements conducted in an anechoic chamber show some similarities between the real measurements and the modelled scenarios, and also that the phantom was a successful substitute for a pair of human legs.
Acknowledgement
This thesis is based om an idea from Per Olov Risman. My biggest gratitude to him, without him, I would know nothing regarding diffraction fields, dielectrics of human tissue or, why the sky are blue. I am also grateful that you have modeled all scenarios in Quickwave, for your patience and clear explanations and, for your instant feedback. I would also like to give my gratitude to Ulf Bjurman at DELTA for letting me do measurements in the fantastic anechoic chamber, for sharing his support and knowledge. Vielen Dank to the anonymous human model for standing with your arms straight out for quite a while (things you do for science), and for assisting with the experimental setup. Thanks to my family for love, support and understanding. And, lastly, great gratitude to the VNA-expert for all support.
Table of Contents
1. Introduction 2
1.1 Motivation . . . 2
1.2 Thesis structure . . . 3
2. Overview of relevant concepts 4 2.1 Microwave technology . . . 4
2.2 Basic physics of EM waves . . . 4
2.2.1 Polarisation of an electromagnetic wave . . . 4
2.2.2 Reflection . . . 5
2.2.3 Diffraction . . . 5
2.2.4 Scattering . . . 5
2.3 Doppler and micro-Doppler effect . . . 5
2.4 Microwave imaging . . . 5
2.4.1 Dielectrics . . . 6
2.4.2 Microwave tomography . . . 6
2.4.3 Imaging from scattered fields . . . 6
2.5 Antenna theory . . . 6
2.5.1 Yagi-Uda antenna . . . 7
2.5.2 Antenna polarisation . . . 7
2.5.3 Far-field . . . 7
2.5.4 Reciprocity theorem . . . 8
2.6 The principles to be examined . . . 8
3. Related Work 9 3.1 Human detection and classification . . . 9
3.2 Discernment of human characteristics . . . 10
3.2.1 Imaging of Scattered fields . . . 10
3.2.2 Imaging tomography . . . 10
3.3 Wholebody phantom . . . 11
3.4 Summary of related work . . . 12
4. Problem Formulation 13 4.1 Principle sketch . . . 13 4.2 Reliability . . . 13 4.3 Research hypothesis . . . 13 4.4 Research questions . . . 14 4.5 Expected Outcome . . . 14 5. Method 15 5.1 Literature study . . . 15 5.2 Research methodology . . . 15
5.3 Modeling method and analysis . . . 15
5.4 Measurements . . . 15
6. Phantom 16 6.1 Phantom substance . . . 16
6.2 Permittivity measurements . . . 18
6.2.1 Penetration depth . . . 19
6.3 Permittivity of an estimated body composition . . . 19
7. Test measurements 21
7.1 The antenna used . . . 21
7.2 Test setup . . . 22
7.3 Setup data . . . 22
7.4 Calibration of antenna cables . . . 23
7.5 Polarisation test . . . 23
7.6 Data collection . . . 23
8. Modelling and image analysis 25 8.1 Modelling procedure . . . 25
8.2 Analysis of modelled scenarios . . . 26
8.3 Analysis procedure . . . 26
8.4 Different scenarios . . . 27
8.4.1 Object size:∅320 mm . . . 28
8.4.2 Object size:∅160 mm . . . 28
8.5 An additional modelling scenario . . . 30
9. Measurements 31 9.1 Setup . . . 31 9.2 Expectations . . . 32 9.3 Preparations . . . 32 9.4 Measurements procedure . . . 32 10. Results 33 10.1 Phantom . . . 33 10.2 Test setup . . . 33
10.3 Modelling and image analysis . . . 34
10.4 Experimental Setup . . . 35 10.5 Data extraction . . . 35 10.6 Analysis . . . 37 11. Discussion 39 11.1 Related research . . . 39 11.2 Antennas . . . 39 11.3 Antenna polarisation . . . 39 11.4 Phantom . . . 40 11.5 Difference signal . . . 40 11.6 Modelling analysis . . . 40 11.7 Experimental setup . . . 41 11.8 Data extraction . . . 41 12. Conclusions 42 12.1 Summary . . . 43 12.2 Future . . . 43 References 47
Appendix A Excerpt from work documentation - Image analysis 48
Appendix B Experimental setup scenarios 50
Appendix C Real vs modeled scenarios 52
Appendix D Related work - summary (1/2) 54
List of symbols
α
object position relative incident wave
ϕ
dangle of di
ffracted field
ϕ
dmax
strongest angle of di
ffraction
E
zfield strength in z-direction in V
/mm or dB
θ
receiver position relative object
λ
0free space wavelength
λ
wavelength
∅
diameter
C
circumference
d
distance
d
Ffar-field distance o far-field limit
S
11reflection parameter
i.e transmitter antenna to transmitter antenna
S
22reflection parameter
i.e receiver to receiver
S
12transmission parameter
i.e transmitter to receiver
S
21transmission parameter
i.e receiver to transmitter
ε
complex permittivity
ε
′permittivity
ε
′ ′loss factor
σ
conductivity
1.
Introduction
Compared to other countries in Europe, mortality in the railway traffic in Sweden is low. In 2018, 20 pedestrians where involved in accidents, and two lost their lives. The same year, 79 persons committed suicide in the Swedish railway system, 11 of them at level crossings [1]. And during the years 2009 to 2015 more than 2500 suicides where committed annually on Europe’s railways. In addition to this, about 2000 serious accidents per year has occurred at railway crossings or caused by train in movement around Europe, and about half of these was fatal [2].
A way to avoid or minimise these accidents is to detect human presence at or near the railway tracks. There are various techniques for human detection. Methods using radar and microwaves have advantages over other sensor techniques. Microwaves enables anonymous detection in different environments and weather conditions, and provide stable detection despite of sun, rain and fog. Compared to camera sensors the detection range of radar is longer [3] and compared to infrared light sensors microwaves are able to discern humans regardless of temperature difference between human and environment [4]. Obstacle de-tection radars that will detect all kind of static and dynamic obstacles are on the market [5], but in many applications it is not possible to discern a human. There is research where humans are detected, positioned [6], classified [7], distinguished from objects [8] and located under concrete [9]. Common for these studies is that the number of tests is relatively small, and that the reliability has not yet been evaluated.
Different frequencies correspond to different wavelengths and makes them suitable for different ap-plications. Wavelengths can be selected so that the influence of particles become negligible. Therefore, microwaves can propagate through atmosphere with negligible attenuation, even through obscurities [10]. The wavelength also affects the penetration depth in different materials. By analysing the scattered signal around an irradiated object, an image can be created, and object properties be analysed. The information obtained from these images indicates not only the physical characteristics as shape, size and orientation, but moisture content and salinity of the object. The non-ionising radiation produced by a microwave imaging system is considered safe for medical applications [11]. Another benefit is that the detection and determi-nation of characteristics can be performed without revealing personal information.
In this thesis the aim is to examine how certain microwave phenomena can be utilised for human dis-cernment in a limited area, e.g. a level-crossing. The proposed principles are not visible in related research, the subject of this thesis is interpreted as somewhere in between the state of art of detection and classifica-tion of humans and human properties using microwave technology. Differences in the distinct diffraction that occurs when a cylindrical vertical object is irradiated by electromagnetic waves in the microwave fre-quency range is examined. The diffracted fields are strongly dependent of the relationship between object circumference and wavelength. The direction and strength of the diffraction also depend of the material of the object, distances and how the transmitter and receiver antenna are polarised, and positioned relative each other. Some of the various aspects that affects the direction and strength of this diffracted field are investigated by analysis of modelled images and measurements in an anechoic chamber. For impartial mea-surement a human-leg phantom has been evaluated and created. And by utilising the difference in strength and direction between the fields that two different frequencies cause, a difference parameter is suggested for further analysis.
1.1
Motivation
Monitoring of people is increasing in society. Different existing microwave detection systems have different strengths, but no system performs perfectly at all times. For systems where a missed detection could be devastating, a combination of several techniques must be used, increasing complexity, and computational resources [6]. This thesis investigates the feasibility of distinguishing humans, harmless and anonymously, using what seems to be a new approach of interpreting the difference signal of the diffracted field which occurs under certain conditions when irradiating a human body.
A future system could also be a useful a contribution for decision-making self-driving vehicles, or alert driver and therefore save lives near railway track or crossings around Europe. The system could also be used elsewhere in the community, wherever anonymous detection of humans is wanted. Because usually, there is no need to register personal information, only to discern the human.
1.2
Thesis structure
Presented in section 2. is a brief and broad foundation of concepts and terms needed to get started in the field of human detection using electromagnetic waves in microwave frequencies. The concepts introduced are based on the related work and on the principles that are subject of investigation, and are an attempt to provide the information needed to comprehend the three principles presented at the end of section 2. In section 4. the research questions and expected outcome are presented, together with a motivation and perception of the subject area of this thesis. These principles has not previously been used for human detection, or discernment, why the focus of the related work in section 3. is to perception of how microwave technology can be utilized for detection, classification and imaging. Section 6. provides an examination of how the human body composition affects the diffracted fields when irradiated with an electromagnetic wave, and present the constructed phantom. Section 7. includes initial work in an anechoic chamber. The modelling procedure is presented in section 8. followed by a description of how the analysis of the diffracted fields of different modelled scenarios was conducted. This all led to the proposed measurement setup and the final measurements, as for this thesis, are described in section 9. After that is the result section 10. with a summary over conducted research followed by a description of subsequent data analysis together with analysis of the measurements. The discussion section 11. is divided into the various sections that compose this thesis. Lastly, the conclusion section 12. where the research questions are addressed, followed by future applications and research recommendations.
2.
Overview of relevant concepts
In this section an overview of relevant basic physical concepts and methods are explained in purpose to get an understanding of the principles under investigation.
2.1
Microwave technology
Microwaves are electromagnetic radiation usually defined as electromagnetic waves in the frequency range from 300 MHz to 300 GHz, this corresponds to wavelengths between 1 m and 1 mm. The relationship between wavelength and frequency are shown in Eq. 1, where λ is wavelength in meters, c0is the speed of light in free space in m/s and f the frequency in hertz.
λ= c0
f (1)
Within the microwave frequency range, phenomena such as diffraction and scattering (propagation away from an obstacle, being a subset of diffraction) occurs when the wave interacts with obstacles [12]. The waves are often concentrated into certain directions, allowing them to reach large distances making mi-crowaves suitable for many applications. The waves are effectively spread and damped in non-conductive materials, in particular in humid materials [13,14]. Microwave wavelength is decisive for the interaction with an object or surface. Different frequencies corresponds to different wavelengths, and makes them suit-able for specified applications. Wavelengths can be selected so that some particles become non-interacting. The wavelength also affects the penetration depth in different materials, and may provide information of underlying layers. Microwave sensing can be used to measure sea-surface temperatures and salinity, shapes of green leaf, moisture in soil and structure of plants [15]. Microwave sensing and imaging is considered risk due to the non-ionising nature of electromagnetic waves. The technology is a non-invasive, low-cost and portable way of detecting discrepancies in different parts of the human body. It also provides a relatively good temporal resolution. The basis of microwave sensing and imaging is the variations in the scattered fields around different types of tissue. This fields is due to the disparity in electrical properties, which in turn depends on difference in the water content of various tissues [11].
2.2
Basic physics of EM waves
2.2.1 Polarisation of an electromagnetic wave
An ordinary, unaffected electromagnetic wave is considered unpolarised. The electrical field of such a wave oscillates randomly at high speed, in all possible directions perpendicular to radiation direction. To be polarised, the wave must be affected by some kind of element or phenomenon resulting in that the electrical field of a polarised wave has a distinct direction. The electromagnetic wave can be polarised by reflection. This occurs when a natural, unpolarised wave incident on a surface reflection occurs. This polarisation is affected by incident angle and the material of the surface of the object [16]. The strength of this polarisation depends on the frequency and magnitude of the electrical field applied, and the equivalent angle of incidence, in relationship to the irradiated object size and dielectric properties [17].
2.2.2 Reflection
The return of an electromagnetic wave that appears when if hits a surface. This phenomenon occurs only when the object diameter are several wavelengths. At a large flat surface, the angle of reflection is equal to the angle of incidence. If the surface is irregular, the reflected waves will be random [16].
2.2.3 Diffraction
Diffraction is the general term for all electromagnetic phenomena inside and outside an object when sub-jected to an electromagnetic wave, but is typically used only when the object size is similar to the wave-length, or smaller. The diffraction of waves that occurs when an electromagnetic wave encounters an object with similar dimensions as the wavelength. The interaction gives raise to a deflected wave that is not in-terpretable by geometrical optics [19]. This deflected wave causes increased energy in certain direction resulting in larger side-lobes, which are as most distinct when the incident wavelength is comparable to the circumference of the object. Diffraction of waves on a smooth surface gives a clearer direction of the deflected fields [10,16].
2.2.4 Scattering
Scattering is the subset of diffraction phenomena resulting in a wave propagation away from the object. In general, three types of scattering are considered, all giving different patterns depending on wavelength and diameter of particle or object [15,16].
- Rayleigh scattering occurs when the circumference of irradiated particles is much smaller than the length of the radiated wave. This occurs in the atmosphere, when small particles irradiate by sunlight. The shorter blue light is scattered more strongly than the colours with longer wavelength, the blue sky originates in this fact.
- Mie scattering by spherical objects occurs when the dimension of the interacting particles are about a wavelength.
- When particles are much larger than wavelength non-selective scattering or just reflection occurs. In the optical range the phenomenon is visible as the white clouds due to scattering and reflection of white light by water droplets.
2.3
Doppler and micro-Doppler e
ffect
The Doppler effect is commonly used to detect movement and compute distance and speed of an object. The Doppler effect measures the change in frequency between the transmitted and received signal. This phenomenon can be used to measure moving objects and physical properties, such as respiration and heart-beat. Analysing the power levels of the return signals can also be used to discern different materials due to its reflectively [10,15]. Micro-Doppler effect refers to frequency sidebands on a reflected radar signal. For example, when a person is irradiated, the body usually gives the largest reflection and the reflection from arms and legs has a lower amplitude. However, the variation in these smaller scattered signals are distinct and periodic, enabling usage for detection and classification [10].
2.4
Microwave imaging
In an active microwave imaging system the reflection of the transmitted signal is collected and analysed. The water content of different tissues affects the dielectric properties, which results in differences in the images. The attenuation increases with frequency, because increased conductivity gives less penetration depth [20]. Therefore, the choice of frequency is decisive. Microwave imaging usually includes some kind of matching medium, in which the tissue phantom is immersed when illuminated to reduce the reflections [11]. Tomographic and back scattered methods are two active methods that exploits contrasts in dielectrics of an object.
2.4.1 Dielectrics
Electromagnetic properties and polarisability of a material, depends on frequency, and can be described by the dielectric permittivity. This complex permittivity is a measure of the relationship between the relative permittivity εrof the material and the permittivity of free space ε0and how these are related to electric flux density and the electric field strength:
D =ε0εrE. (2)
where: ε0 ≈ 8.85×10⁻¹²F/m. The expression for the relative permittivity contains the real permittivity ε′ and the dielectric loss factor ε′′: εr= ε′r− jε′′r. The loss factor is frequency dependent and can be considered to consist of two terms in materials such as human tissue: the loss factor caused by the properties of pure water, and the conductivity due to dissolved ions. These are often combined into a conductivity term σ:
ε′′
=
σ 2π fε0
(3)
Further in this thesis this will be referred to as dielectric data or permittivity of the material, and is expressed as ε= ε′− jε′′ [21,22].
2.4.2 Microwave tomography
Microwave tomography is a quantitative imaging method. The technique combines images from different angles, creating an 3D reconstruction of an object. Unlike the conventional tomography used in for example X-ray, the concept of diffraction tomography encounter the diffraction phenomenon enabling use of lower frequencies [23]. The tomographic image is based on the electrical properties of the irradiated object, the complex permittivity and the conductivity, as described in section 2.4.1. In medical imaging the human body is irradiated by one or more transmitter antenna and the scattered signal is collected by the receiver antennas, and analysed using iterative using inverse scattering. Usually the tissue is immersed in a homogeneous medium with a certain permittivity which reduces the reflection [11].
2.4.3 Imaging from scattered fields
In some studies, the aim is not to obtain the dielectric characteristics of the tissue for 3D reconstruction of whole tissue areas, but to find the deviating area, such as a haemorrhage inside a head, or a tumour in a breast. In examinations where only location of deviating tissue is desirable, different back-scattering methods can be utilised. The difference in dielectric properties makes the scattered field stronger, for example when the irradiation encounters a tumour [24].
2.5
Antenna theory
The first half-wave dipole antenna was demonstrated by professor Hertz 1886 [25]. After that moment, numerous antenna types has been invented, and humanity are surrounded by electromagnetism, transmitted and received by antennas all over. In Figure 2, Heinrich Hertz’s antenna model is shown, and the leftmost patterns is the dipole he ended up with when bending the plates of a capacitor. The curved shape of the wave fronts is also visible in the leftmost figure. Depending on length of antenna in relationship to wavelength, different lobe patterns are obtained, as shown in Figure 3. To adjust the radiation pattern, there is several ways of modifying the dipole to get the radiation in the desirable direction, for example by building a Yagi-Uda antenna [26].
Figure 4: The main components of a Yagi-Uda antenna [27]
Figure 5: Gain vs beamwidth a polar diagram for a Yagi-Uda [27]
2.5.1 Yagi-Uda antenna
A Yagi-Uda antenna has at least three elements. The driven element is typically an energized halfwave dipole. The slightly longer reflector is attached on one side, reduces the back-lobes and provides a better front to back ratio. One or more directors are on the other side, each director slightly shorter than the previous one. Figure 4 shows a Yagi-Uda with two directors. This will provide a gain of approximately 8 dB. Adding more directors will give more gain with less beamwidth. In the upper part of Figure 5 gain vs beamwidth visualised, and in the lower part, a polar diagram shows a typical beam spread from a Yagi-Uda antenna, with a relatively good front to back ratio, and the minor side-lobes [27].
2.5.2 Antenna polarisation
An electromagnetic wave emanating from an antenna consists of perpendicular fluctuating magnetic and electrical fields, as shown in Figure 1. The polarisation of an electromagnetic wave is defined as the direc-tion of the electrical field. In Figure 1 the wave is vertically polarised. A Yagi-Uda with the driven element positioned vertically, as shown in Figure 4 is linearly vertically polarised [26].
2.5.3 Far-field
The far-field region is usually defined as the region where the angle of radiation is not affected by the distance from the antenna i.e. the field lines are straight. For antennas with larger dimensions than the wavelength the far-field region is usually given by:
dF= 2D2
λ (4)
where D is the diameter of the antenna and dF is the distance from the antenna where the far-field region begins [25]. For smaller antennas the far-field region depends less of the antenna dimensions because of the electromagnetic waves becomes nearly parallel at a smaller distance than for the large antennas. Therefore, the far-field limit is approximated to:
dF= 2λ (5)
This is the case in this thesis, the patch antennas described in Section 7.1 have the dimensions of approximately λ/2, and are considered small antennas, thus, in this thesis, the far-field distance equals 2λ [26]. This limit is relevant because of the complicated bent field lines i.e. the near-field that exists around an antenna. Outside, in the far-field area the field lines become almost parallel and the field force decreases according to inverse square law (see Eq. 6).
I1 I2 = d22 d2 1 (6)
2.5.4 Reciprocity theorem
The reciprocity theorem describes the relationship of interchangeability between an antenna pair in trans-mitter, and receiver mode. This interchangeability entails that using two antennas would give the same transmission characteristics, regardless of which of the antennas is the transmitter, i.e. S12= S21[28].
2.6
The principles to be examined
The following is assumed:
- For a cylindrical object, there is a 90° polarised diffracted field component relative to the incident field. This means that the field sent out by for example a horizontally polarised transmitting antenna will not be received directly by a vertically polarised antenna, only the field deflected by the object will be detected under otherwise undisturbed ideal conditions.
- The reciprocity theorem applies, see section 2.5.4.
Principle #1 By sending microwaves with a certain linear polarisation at an adapted beamwidth a partic-ular, 90° polarised diffracted field will occur in the immediate vicinity of the object. This diffracted field will cause a strong scattered signal which can be perceived by a receiver antenna that is rotated so it is 90° polarised relative the transmitted antenna.
Principle #2 The strength of the scattered signal varies with the length of the microwave and the circum-ference of the object. A distinct scattering occurs when the object has a circumcircum-ference of a wavelength ±15%. Thus, using a 400 MHz signal, would cause a distinct diffraction field around an average human, since the circumference is similar to the wavelength.
Principle #3 The strength of the scattered field can be compared to the scattered field caused at another frequency. The difference signal varies with object size and properties, thus could be utilized for human discernment.
3.
Related Work
Presented in this section are previous work within the area of detection and discernment of humans using microwave technology in general. The microwave detection technology is old and the number of appli-cations are endless. In more recent days the research has been focusing more on classification of human movements with aid of algorithms and detection of small deviations in physical parameters. Here follows a presentation of different experiments and studies utilising microwaves for some kind of human detection, classification, or of movements, or characterisation of human properties. The variety of experimental setups and investigations shows that microwaves behave very differently depending on operating frequency, water content of materials, and antenna characteristics.
Some research applications related to detection and classification of objects and humans are summarised in section 3.1. In section 3.2 an attempt to summarise research utilising the electrical field that arises when different tissues are irradiated with microwave frequencies, and how this field deviates with tissue properties.
3.1
Human detection and classification
K.M. Chen et al. [9] implemented a life detection system for detection of humans behind concrete barri-ers. Two systems where constructed, operating at different microwave frequencies, one at 1150 MHz and the other at 450 MHz. During the tests, concrete plates with, and without reinforcements where used to simulate earthquake rubble. When the probe antenna was aimed on concrete rubble was possible to detect small movements from a persons respiration or heartbeat. To accomplish this, a stable 1150 MHz wave is generated by a phase-locked oscillator which is radiated by the probe antenna. The radiating element of the antenna is a half wave dipole. To increase bandwidth a passive radiator was placed next to the dipole. The length of this was empirically selected using a network analyser. The wave penetrates the concrete and the reflected wave consists of clutter from the concrete, which is canceled out by the noise cancellation system. When encountering a human the reflected signal is slightly modulated due to human movements, and this small reflection can be analysed. Extensive testings of the two systems was conducted, using humans under concrete plates to simulated earthquake rubble. The main differences of the two chosen frequencies was that the 1150 MHz signal penetrated the reinforced concrete easier than the 450 MHz signal, but the lower frequency could travel deeper in concrete without metallic reinforcement. The power levels used was 300 mW for the 450 MHz signal and 400 mW for the higher frequency.
There is research in the area of detection and classification of humans in line-of-sight, behind walls, in different angles with respect to the microwave propagation direction. Y. Kim and H. L. Ling [29] tested a Support Vector Machine (SVM) algorithm for classification of different human activities. With a Doppler radar operating at 2.4 GHz (about 12 cm), measurements where made when 12 different people performed various activities, such as walking, moving arms and crawling. The micro-Doppler signatures of the re-flected signals where analysed and classified by the algorithm, and the different activities where confidently determined in line of sight and with a angle of 30° with respect to the beam path between radar and object. The classification accuracy was over 90% with in these range. J. Bryan and Y. Kim [30] continued the testing of the SVM algorithm using the time-variation of the signature of the reflection of a human using a UWB1system. These tests shows a classification accuracy just below 90%, but the authors emphasizes the difficulties of distinguish between different similar movements. D. Fairchild and R. Narayanan [32] provides a way to classify human motions by detecting micro-Doppler signatures using multiple antennas. Using a frequency of 4 GHz (about 7.5 cm), with the transmitting antenna located between the two receiving antennas, all separated with 45°. The result of this experiment showed that their algorithm was sufficient for ideal conditions but when doing the experiments on an actual human the errors increased due to the need of exact angular position in relation to the antennas. The simple motions (e.g. swinging arms) are detected with more confidence than the more complex movements, that were more difficult to distinguish. They also showed that classification is possible when the movements are perpendicular to the radar beam direction.
J. Nanzer [10] discusses how microwave radar systems is utilised in the security area for human de-tection, classification and contraband detection. The human presence detection relies on detecting the movement using Doppler shift. Movement of arms and legs causes micro-Doppler shift, and can be used to discern of humans from non-humans. Y. Kilink et al. [33] present a detection and ranging method for 1UWB or Ultra Wide Band is a system that uses perceptibly greater frequency bandwidth than conventional systems, greater than 500 MHz [31].
indoor unknown environments. Using off-the-shelf UWB antenna operating in a frequency range of 3–5.5 GHz. The method utilises that human presence induce low frequency variations, which differs from the background noise. Only the humans in line of sight where considered when developing the signal model that captures the deviations of the radar signal which occurs if human are present. The model was then tested in a furnished room verifying that the method detects if a person is present in most cases. Z. Sun et al. [34] propose three parameters from the micro-Doppler reflection to determine the motion of a walking human and S. Chen et al. [35] has examined an algorithm to determine walking speed of a human using a pulse-Doppler radar together with a Kinect sensor.
3.2
Discernment of human characteristics
Research in the field of microwave imaging is increasing. During the last decade, several reports addresses microwave imaging for detection of deviations in human tissue. In a review of how microwave technol-ogy is used in medical applications R. Chandra et al. [11] concludes that the applicability of microwave imaging are versatile. The review summarises a number of relevant research areas, providing information of how microwave sensing and imaging has been examined to provide information of physical structures. The paper includes examples of how microwave sensing and imaging an is used for detection and discern-ment of body parts, unhealthy tissue in brain and breast imaging and analysis of blood, bones and even a whole body animal. The difference in dielectric properties of healthy and unhealthy tissue is used to find deviations. For different organs the permittivity either increases, or decreases when the tissue deviates from the normal condition, depending on type of tissue. Most of these uses the dielectric properties to recreate the illuminated tissue, in order to locate deviations. Other investigations shows the possibility to locate the strongest scattered field of, using the same basic technique as ground penetrating radar, as described in [9].
3.2.1 Imaging of Scattered fields
A confocal system uses UWB pulses to irradiate the object from different positions, aiming to locate the strongest scattered field, rather than recreating the whole breast image, such as tomography. E. Fear et al. [24] presents how to utilise confocal microwave imaging for detecting breast tumors. The proposed method uses two confocal systems to scan the breast and locating a modelled tumour in the simulated scenario. The scattered signal is reconstructed using FDTD2 and to different breast models, with the dielectric data of a human breast.
D. Ireland and M. Bialkowski [36] describes an algorithm for detection of cerebral haemorrhage, which is tested by using a head phantom and analysing the scattering of a 2 GHz signal. To predict the scattered fields, a FDTD approach was used to simulate the electromagnetic waves. The confocal algorithm is based on predictions of how the wave interacts with the object, when the assumption is correct the difference signals are added. To determine the correctness, several parameters must be taken into account, for example the dielectric properties of the phantom.
3.2.2 Imaging tomography
I. Dilman et al. [37] investigates the possibility of discerning a simulated haemorrhage in a head phantom with microwave imaging. The head phantom used in the experiment was made based on images from real humans. The dielectric properties of different types of tissue was used for the classification of a various tissues. Different frequencies (500 MHz, 800 MHz and 1000 MHz), together with carefully chosen sur-rounding medium where tested. The results showed that in certain conditions it is possible to discern a accumulation of blood from other tissues. The feasibility of detecting an large collection of blood, sized 2.3× 2.3 cm was shown, and also that the medium was needed to decrease the reflections, in order to in-crease the penetration depth. I. Dilman et al. [38] continues on previous research and presents an robust algorithm for detection of deviations in human tissues using microwave imaging. They describe how signal technology is utilised during measurements of the scattered field around a human head phantom at different times. The proposed method of compressive sensing with differential imaging to detect how the electrical properties changes of blood regions in the simulated phantom, require less time than other methods.
A. Mobashsher et al. [39] presents an evaluation of a portable microwave imaging system for stroke detection, using a UWB antenna as both transmitter and receiver, capturing the scattered signal after signal
interaction with object. The analysis include different head phantoms, simulating various scenarios to estimate the scattering pattern of a haemorrhage. They show that it is possible to detect deviations as small as 1 cm3, depending on the location and the size of the target inside the phantom. The two chosen frequencies operate from 1.1 GHz to 3.2 GHz corresponding to a free space wavelength of 27 cm to 10 cm. Using FDTD for simulation, several aspects of scattering was considered, such as different depth, different sized targets, and radiation from different directions. From the experimental setup, they analysed and reconstructed the various scenarios. By using a method for quantification of correctness in locating haemorrhage in the phantom, it was possible to determine that even though the bigger target provided larger scattered signals than the smaller target, all reconstructed scenarios placed the haemorrhage in the correct position. Also, it was found that for the larger sets of measurements, the correctness was higher.
K. Ren and R. Burkholder [40] has formulated an uniform imaging algorithm for layered structures, ap-plicable to planar structures. The experimental setup contained of a horn antenna transmitting frequencies between 2 and 12 MHz (about 3-15 cm) and a moving antenna receiving the reflected signal. The experi-ment compared this uniform method to conventional diffraction tomography and shows the differences in the images due to dielectric characteristics.
Microwave imaging systems are suggested for detection and early diagnosis of breast cancer in several research papers. S. Luo et al. [41] presents a new system to increase the resolution of microwave imaging. Experiments on a breast phantom provided a resolution comparable with x-ray tomography.
Research in the field of utilising microwave imaging systems to determine biological characteristics is also done at M¨alardalen University. Several papers addresses steps towards biomedical applications; An experimental setup of a robot data acquisition system is validated by comparing computed data with the scattered field collected by a robot [42]. Studies have been performed to determine permittivity of materials to simulate biological tissue [43]. Microwave imaging tests is performed on breast phantoms [44] and constructed head phantoms using appropriate liquids and materials to simulate realistic dielectric properties is described in[45]. Comparative studies on how different antenna setups affects the error between simulated and measured values in a microwave tomography system is described in [46]. A small concept antenna has been developed to evaluate the possibilities of microwave tomography imaging with increased performance together with reduced external impact of the breast. The concept antenna showed promising result of enhance some types of wave while reduce other fields [47]. Some of these, and other research are found in the doctoral dissertations by N. Petrovic [48] and by T. Henriksson [49].
3.3
Wholebody phantom
Phantoms of varying complexity and content are utilized in microwave imaging research. Many research projects use tissue-emulating phantoms to ease the research and to quantify their measurements, and are used both physically to facilitate numerous measurement, and in computer modeling. In order for these phantoms to react to microwaves the way as real tissue does, different methods are used to obtain the fillings depending on the tissue. A. Mobashsher and A. Abbosh [50] summarises a comprehensive part of extensive research in the area, and describe the advantages and disadvantages of different approaches to construct the phantom filling. To simulate tissues with high water content, water constitutes a suitable base. The tissues with lower permeability, for example fat, also contain a much smaller proportion of water, which is why other components are used, such as oil mixtures. It is desirable to be able to use the phantom since the substance retains its dielectric properties many experiments. But water evaporates, mold growth changes electrical properties and, some of the substances do not remain in homogeneous solutions but are separated, which also changes the properties. The containers must also be carefully chosen, some of the containers used to keep the chemicals employed are not suitable for microwave imaging and can cause unwanted scattering. Gel-type substances make it possible to build layers of different tissues, but these cannot change the properties of post-production, such as possible with liquid where one can add, for example, water to increase permittivity. C. Gabriel [51] has performed a comprehensive number of measurements that D. Andreuccetti et al. [20] shares in
their comprehensive database, covering the wide range between 10 MHz and 100 GHz. The data is sorted by frequency or name of tissue and gives information of the permittivity, and the conductivity of most human tissues.
Phantoms are also used in modelling of how microwave interact with human body-parts. For example, in an extensive modelling project where T. Nagaoka et al. [52] have modelled a realistic woman phan-tom which is segmented into 56 tissues and organs. The research presents specific absorption rate (SAR)
characteristics for both vertically and horizontally polarised plane waves in a range from 10 MHz to 2 GHz. T. Hikage et.al [53] proposes a realistic human whole-body phantom after a investigation of the SAR of a silicone phantom, using 2.1 GHz horizontally polarised plane wave in FDTD simulation. The dielectric data used for the homogeneous whole-body phantom was ε’= 39.82, σ = 2.98 1/Ωm at 4200 MHz. D. Sullivan et al.[54] created a whole-body model analysing the SAR using 100 MHz and 350 MHz, respectfully. For the average homogeneous body model they used dielectric data ε’= 38, σ = 0.95 1/Ωm.
3.4
Summary of related work
Microwave technology is a wide area. Detection and classification of human movements can be performed by using micro-Doppler signals, and changes in the reflected signal due to different arm and leg movements. Different frequencies and algorithms can characterise human postures and movements with different amount of accuracy. By analysing the scattered fields around various tissue, other research shows the possibility of locating deviations inside the human body. In the field of microwave imaging phantom substances with different dielectric properties has been evaluated for different applications.
4.
Problem Formulation
The aim of this research is to evaluate the possibility of reliable discernment of humans using microwave technology. This is going to be investigated by examination of how electromagnetic waves interact with objects. When an object is irradiated by an electromagnetic wave, various measurable physiological phe-nomena occurs. In this thesis three specific phephe-nomena is going to be investigated. These are briefly summarised here, and further described in section 2.6.
#1 The strongest diffraction will in general deflect perpendicularly to the direction from the transmitter antenna to object. This field is to be detected by a receiver antenna, 90° polarised relative transmitter.
#2 A distinct diffraction and by that deflected scattering occurs when the object has a circumference of about a wavelength.
#3 Discernment of humans is possible by utilising the difference between the scattered fields that two different frequencies causes.
4.1
Principle sketch
The investigation of the parameters and the diffracted fields are based on the following setup. The principle scenario in Figure 6 could be for example a railway crossing. The transmitter antenna is horizontally polarised, sending out signals at two different frequencies. In this research, two pair of antennas are utilised, sending out signals around 200 MHz and around 400 MHz. The principles to be examined states that the strongest diffraction will be seen approximately perpendicular from an object with circumference of about an wavelength, and that the diffracted field is possible to receive if the receiver antenna is 90° polarised relative the transmitter antenna. The red and blue lines represent the signals from the two frequencies, and the direction of the strongest diffracted field, for each frequency is the angle ϕd
max. As seen in the figure, the deflection angles are shown to be less than 90°. This is due to the finding that ϕd
maxbecomes smaller for larger object circumferences in relation to the free space wavelength, and thus allows the discerning of two frequencies are used.
When a person moves across the area, or in the area of the antenna lobes3the person is, in each moment, located at a variable angle α with respect to the transmitter antenna. The angular deviations of the scattered lobes from this will depend of position of the person, and the relationship between the free space wavelength (i.e. the frequency) and the dimensions of irradiated body parts. These geometries provide the basis for determination of the sensing area. Elaborations of these factors are presented in section 8.2.
4.2
Reliability
To provide a basis for a future reliable system, the parameters obtained from the measurements must be evaluated and chosen with care. In the context of utilising these three principles (see section 2.6) for human discernment, reliability is defined as the extent to which a certain parameter is within a defined interval for a large number of tests. The aim is to quantitatively evince that some parameter, based on these principles will indicate human within a certain interval.
When potential feasible parameters for human discernment are orientated, the measurement of relia-bility can be performed based on these. According to principle #3 (section 2.6) a potential discernment factor will be the difference in strength between the diffracted field that two frequencies causes. And this difference will be a function of, at least, incident angle, angle of diffracted field as well as the properties of the person or object.
4.3
Research hypothesis
Reliable human discernment is possible utilising di
fferences in the distinct
di
ffraction patterns, depending on certain phenomena, and when the receiver and
transmitter fields are 90° polarised.
Figure 6: Principle diagram of the transmitted, diffracted and received fields. The polarisation of the transmitting antenna is y-directed and the diffracted field by the object becomes z-directed, with the lobe direction α+ ϕd
maxin relation to the x-directed lobe direction of the transmitting antenna. The angle is different at 200 and 400 MHz, which provides a discerning function of the overall system; as drawn here will be a relative reduction of the received 200 MHz signal strength by the antenna with its y-directed lobe.
4.4
Research questions
In order to place the three principles described in section 2.6 in context, the following research questions was stated:
RQ 1: How is microwave technology used for detection and characterisation of humans and human proper-ties?
RQ 2: Which measurement parameters are of most importance to discern a human using the three principles stated in section 2.6?
RQ 3: Are there any reasons for reduction of the reliability of microwave discernment of humans?
4.5
Expected Outcome
- Review of the existing research in the field of discernment of humans with aid of microwaves.
- A proposed position pattern of antennas and the frequencies used for the measurements to distinguish a moving human from other objects with aid of microwave technology.
- Analysis of conducted tests and experiments together with a discussion of some of the parameters that affects the dependability of the microwave discernment system.
5.
Method
To perceive the huge area of microwave based detection and discernment of humans, the first step was to obtain adequate knowledge of microwaves, basic antenna technology, measurement equipment and how to analyse the data. To compile an overview of various applications where microwave technology is used for detection and characterisation of human features, the starting point was three comprehensive literature reviews of J. Nazer [6], R. Chandra et al. [11], and A. Mobashsher and A. Abbosh [50].
5.1
Literature study
A non-systematic qualitative literature study was performed, in order to get an understanding of existing research, problems and benefits with different approaches regarding microwave discerning of humans. The literature study answers RQ1, provides a basis for RQ2 and addresses part of the reliability aspect of RQ3. The literature study started with the aforementioned literature summaries. The spreadsheet shown in Appendix Tables D.1 and E.1 was filled in as work progressed.
5.2
Research methodology
For the experimental phase an interpretation of a deductive approach was chosen. According to J. Du-dovskiy [55], the advantages of such a method is the opportunity to quantify concepts, and make connec-tions between variables and concept. At first research hypothesis, stated in section 4.3 was deduced from the three principles in section 2.6. To test the hypothesis different quantitative methods was used to compre-hend the parameters. The image analysis was performed systematically by following the steps described in section 8. The hypothesis was then evaluated doing the final measurement series. Results were interpreted and compared to the analysis and theories.
5.3
Modeling method and analysis
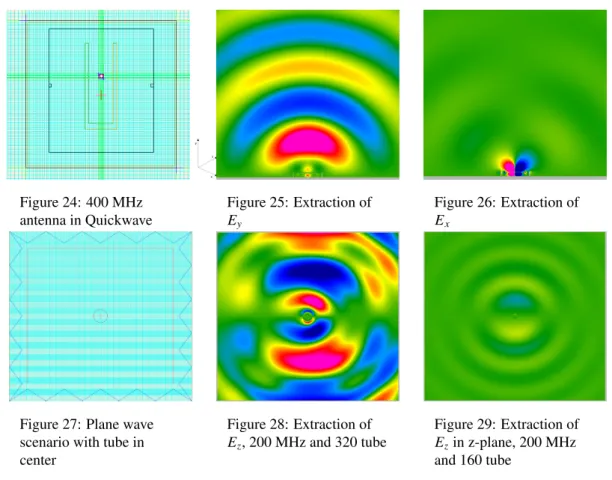
Finite-difference time-domain (FDTD) based commercial software (Quickwave) [56] was utilised for mod-elling of the antennas and different scenarios. Although some scenarios became computationally heavy, this is an acknowledged method for simulating antennas, diffraction, and scattering.. The extracted images were analysed utilising the image toolbox in MATLAB. RGB information of the pixels which was compared to the scales of relative field strength, in relative V/m and in dB, with the chosen input data. The angles towards this strongest point of direction were calculated and verified using a digital protractor.
The procedure utilised during the analysis is described in section 8.3 in context of the parameters de-scribed.
5.4
Measurements
Real scenario measurements has been performed in a large anechoic chamber, where the measurements condition were as ideal as possible. The experimental setup was based on angles extracted from the analysis of the modelled diffracted fields. For the ability to repeat the measurement settings, all parameters were thoroughly documented. These parameters included temperature, distance and angles for the setup, and which antenna inputs and cables that were used. To facilitate repeatability a phantom was also developed.
6.
Phantom
The construction of a phantom was evaluated in order address RQ2 and to assess parameters of importance while investigating the three principles (section 2.6). In most of the literature mentioned, some kind of phantom is used, either only for simulation, or physically constructed and utilised during the experimental measurements. To have the possibility to quantify and validate the measurements, a phantom is a necessary. A phantom will also provide the ability to change one parameter at the time and ease for repeatability of the measurement scenario. For the ability to address the reliability concept in RQ3, many measurements of similar scenarios need to be performed, this also formed the basis for the decision to evaluate a phantom. In order to limit the number of parameters that affect the selection of parameters, the following was considered: - To get a clearer direction of the diffracted fields, and to minimise eventual diffuse random reflection
(section 2.2.2) a container with a smooth surface was chosen to enclose the phantom substance.
- Plastic is to some extent invisible to microwaves at the chosen frequencies [21], so a PVC-tube was chosen as a container.
According to the phenomena under investigation, presented in section 2.6, two major aspects affect the microwave image; the size, and the characteristics of the irradiated object. Principle #2 states that the wave-length should be approximately equal to the circumference, for distinct diffraction. Two∅160 mm PVC pipes was chosen as containers, giving the circumference of approximately 0.5 m each, and an opportunity to elaborate with the setup and object orientation. One of these pipes could simulate a human thigh, which is assumed containing mostly muscles, so the starting point was to use dielectric data for human muscle as a reference for the determination of phantom substance. A mixture of sawdust and saltwater was chosen as the phantom content for mainly two reasons:
- A human contains of mostly water, fat, and muscles. If the water is removed, both fat and muscles has low dielectric data, just like sawdust.
- The supervisor suggested sawdust, because its cheap and easy to handle, unlike other substances used within microwave imaging.
6.1
Phantom substance
Related research shows that the electrical characteristics affects the diffraction when irradiating human tissue. To evaluate the content of the phantom, the dielectric properties of human tissue properties were investigated. The proposed phantom substance of sawdust and salt water, was analysed. Prior to the analysis of the sawdust mixture, some computations were made. The Eq. 7 to Eq. 9 was used to compute dielectric properties for the water at 20°C and, the formula for mixtures Eq. 10 was used to determine the relationship between the two components [21]. For the sawdust permittivity ε′ = 4.0 was used for the calculations and the loss factor ε′′ was determined to be negligible in the water mixture, therefore the permittivity for sawdust was approximated to ε= 4 − j0 .
εs(t) = 1 0.0112844+ t ⋅ 5.81145 ⋅ 10−5+ t3⋅ 9.8178 ⋅ 10−10 (7) ε= ε∞+εs− ε∞ 1+ jff D (8) fD= exp 2.18787+ t ⋅ 0.05247 1+ t ⋅ 0.0073768 (9) where: ε∞= 5.00 The frequency, f is GHz fDis given by Eq. 9
To determine a theoretical proportion between water and sawdust, the dielectric data for water at 20°C, 400 MHz was computed using Eq. 7: εs = 80.291. Eq. 9 gives fD= 16.79 and was inserted in Eq. 8, giving the permittivity for water at 20°C and 400 MHz: ε= 80.252 − j1.79. The permittivity of the mixture εmin given by Eq.10:
ε1/2m = ε1/2c (1 − vi) + ε1/2i ⋅ vi (10) where:
εcis the permittivity of sawdust εiis permittivity for water viis the percentage of water
Applying Eq 10, assuming dry sawdust data of ε= 4 − j0 gives a permittivity at almost εm= 60 − j1.29, using 80% water. This permittivity is comparable with a human muscle according to Table 1.
Tissue Permittivityε Equivalent
Conductivity σ Loss factor ε”
Penetration depth [57] 400 MHz Bone (cancellous) 22.443 0.23459 10.5469 Bone (cortical) 13.147 0.091336 4.1063 Body fluid 69 1.5293 68.7558 32 mm Fat 5.5898 0.041119 1.84867 350 mm Muscle 57.129 0.79631 35.8013 53 mm Skin (dry) 46.787 0.68806 30.9345 57 mm Blood 64.183 1.3496 60.6767 Liver 51.235 0.65385 29.3565
Brain (white matter) 42.072 0.44463 19.9901
Brain (grey matter) 57.435 0.73748 33.1564
Lung (deflated) 54.584 0.68347 30.7281 Heart 66.099 0.96463 43.3688 200 MHz Bone (cancellous) 24.416 0.19591 17.6158 Bone (cortical) 13.948 0.074081 6.66122 Body fluid 1.5094 69037 135.722 39 mm Fat 5.7384 0.038067 34.2291 310 mm Muscle 60.228 0.74307 66.8154 62 mm Skin (dry) 55.716 0.58229 52.3584 74 mm Blood 68.474 1.2802 115.113 Liver 57.724 0.55852 50.2210
Brain (white matter) 47.064 0.37686 33.8865
Brain (grey matter) 65.068 0.63873 57.4334
Lung (deflated) 59.15 0.61031 54.8779
Heart 75.205 0.83276 74.8802
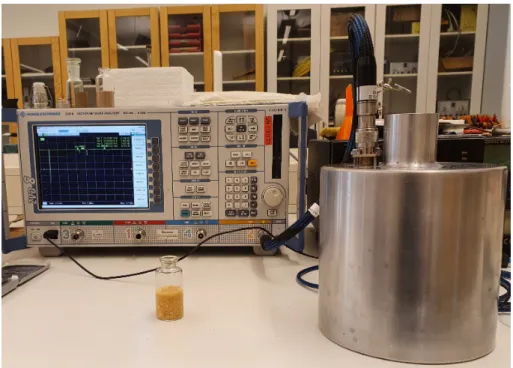
Figure 7: The lab scene, with the network analyser, the container and the vial with sample.
6.2
Permittivity measurements
In order to verify the theory and computations, and to determine if the mixture of sawdust and saltwater is a suitable content for the phantom, an experiment was performed. The method used is suitable for the examination of in-homogeneous samples like this. In the center of Figure 7 the sample is inside the vial. The sample contains of 5.4 g sawdust, 19.6 g water, and 0.2 g salt= tot 25.1 g. The vial is carefully placed inside the container, seen at the rightmost side in Figure 7 and was irradiated using the vector network analyser. The reflected signal for the sample inside the container is shown in Figure 8 and evaluated using retro- modelling. Cables, container, and vial has been thoroughly modelled in a program, and the only uncertainty is the dielectric data of the sample. Different combinations of the parameters that describes the dielectric properties i.e. σ and ε′, was altered until the output from the modelling was similar to the experimental output.
Figure 8: Plot for sample containing sawdust and saltwater
Figure 9: S11as a function of the frequency for ε′= 57, σ = 1.5 1/Ωm
In Figure 9 the final retromodelled reflection factor is shown as a function of the frequency for ε′= 57, σ = 1.5 1/Ωm, which is approximately equal to the measurement result of the actual sample shown in Figure 8. Therefore, the sample was determined to have the following dielectric properties at 2.56 GHz: ε′= 56, 5±0.7 and σ = 1.6±0.2 1/Ωm. Using the relationship between the conductivity σ and loss factor ε′′ from Eq. 3, gives ε′′= 1.6/2π×2.56GHz×ε0= 11.2397, thus the permittivity for the sample at 2.56 GHz is
approximately ε= 57− j11. After recalculation to 400 MHz, the permittivity for the sample is ε = 56− j47, a good approximation for a human muscle at 400 MHz, which has the approximate permittivity ε= 57− j36 according to Table 1.
6.2.1 Penetration depth
Microwaves at chosen frequencies used are going to penetrate the human body to some extent. The pene-tration depth dpfor biological tissue is given by Equation 11 :
dp= −λ 0
4πIm√ε (11)
where ε is complex permittivity ε′− ε′′for the tissue. The penetration depth can be considered inversely proportional to the loss factor, the higher the loss factor the lesser penetration depth [21]. In Table 1, the penetration depth for some of the tissues shows that most human tissues are going to be affected by the incident wave. To further investigate how the dielectric properties of various tissues affects the human body, an average body composition was estimated.
6.3
Permittivity of an estimated body composition
Even though the body composition varies widely between different humans, depending on age, gender and habits, an average human was roughly estimated to be made up of a few tissues, as shown in Figure 10.
Figure 10: Estimated human body composition
Comments on Figure 10:
This rough estimation is based on an article in the Bariatric Center of Kansas City about Body Com-position[58], the fact that the average Swedish woman is 68 kg and a man 84 kg [59], and an pop-ular science article in BBC Science Focus Mag-azine describing some organs by their average weight [60]. This gives that an average person is 76 kg, and this weight is used to compute the con-tribution of some average sized organs.
The permittivity for the estimated body composition in Figure 10, is calculated using the mixture for-mula from Kraszewski, Eq. 10 [21] on the dielectric data extracted from Table [20]. The permittivity is given by:
ε1/2m = ∑ viε1/2i (12)
where:
εmis the permittivity from Table 1
viis the percentage distribution of the estimated body composition according to Figure 10
If applying Eq. 12 at the average estimated human, assuming to fill up the last 5% with body fluid, the complex permittivity is computed to ε = 39.8418 − j18.8979. Using dielectric data for 400 MHz from Table 1. The body composition was alternated to an average overweight person, using 50% fat, and the corresponding proportion less in muscle giving ε= 23.0261 − j8.91541. For comparison, a muscle content of 50% gave the permittivity of ε= 46.6802 − j23.1471.
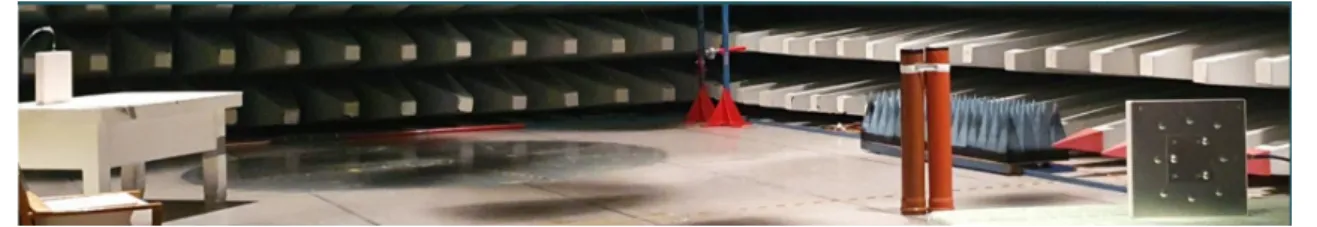
Figure 11: The two human leg phantoms in the anechoic chamber
6.4
Construction of phantom
Related research and the estimated average body-model, described in section 6.3 shows that the sawdust and saltwater mixture that was analysed in section 6.2 is a good approximation for a human muscle at the chosen frequencies, but not for the whole body. Therefore, a tube was chosen to simulate a human leg, which consists of mostly muscles. Here follows a description of how the physical phantom used for the final measurements, described in section 9., was created. Two plastic tubes with phantom substance where constructed. Each tube has an outside diameter of 160 mm, material thickness equals 4.7 mm, and the height is approximately 1.10 m. The tubes was filled with phantom substance containing the saturated sawdust and saltwater mixture that was analysed in section 6.2. The substance was tightly packed to minimize the risk of air pockets. At the time of the measurements the mixture had been airtight for two days, and after removing as much of the excess water as possible, the ratio became quite close to the sample in vial. Applying the mixture formula in Eq. 10 gave the complex permittivity: ε= 69 − j40.
7.
Test measurements
7.1
The antenna used
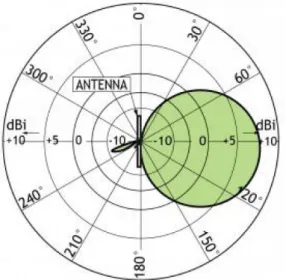
In the experimental setup two pair of patch antennas are used. They have some advantages over Yagi-Uda, for example, they are less sensitive to weather, and ice formation. Also, the physical format makes it more suitable to use in a real application. Basically, a patch antenna acts as a folded dipole, but instead of a metallic rod, the patch antennas has a probe-fed plate, and a metallic cover that work as a ground plate, minimising the back-lobes [61]. The 400 MHz antenna pair is a linearly polarised antenna and has a frequency range of 380 to 470 MHz. The physical size is approximately half a wavelength, almost 0.4 m× 0.4 m. The radiation pattern for the electrical-field is visualised in Figure 12. Figure 13 shows the radiation pattern in the horizontal plane. Note the small back lobes due to an aluminium cover to increase the front to back ratio [62]. The second antenna-pair is larger, operating in a frequency area of approximately 200 MHz, corresponding to 1.5 m wavelength, thus the plate in the antenna is approximately 0.75 m× 0.75 m. The 200 MHz antenna is a scaled up version of the 400 MHz antenna. The basis is the same and the radiation pattern similar as the one shown in Figure 12 and 13. Minor differences makes the 200 MHz antennas operating on a slightly narrower bandwidth. In this thesis the antenna pair are called 200 and 400 MHz antenna, respectively. The 200 MHz antennas are visualised in use in Figure 14 and 15.
Figure 12: Antenna lob, E-plane [62] Figure 13: Antenna lob, H-Plane [62]
Figure 14: Front of 200 MHz antenna Figure 15: The feed on the back of the 200 MHz antenna
7.2
Test setup
Figure 16: The anechoic chamber. Transmitter antenna is located to the right, 90° polarised in relation to the receiver antenna
Early in the investigation, the concepts of antenna polarisation, where examined in an large anechoic chamber at DELTA4. In this section a description of this setup is presented, together with a analysis of the outcome.
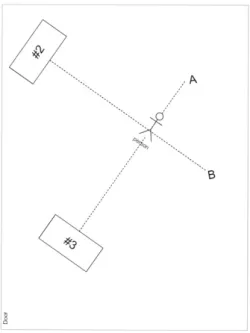
During these orienting early investiga-tions a human model was used, standing in different positions, at different spots in rela-tion to the antennas. The intenrela-tion was do find deviations in the reflections for some fre-quencies. In Figure 17, the receiver antenna #2 and the transmitter #3 are positioned to the left, the person is located in position X facing the transmitting antenna. Point A, B are lo-cated on the outer circle. Distances shown in Table 17. Note that the scene is slightly offset, so that the wave propagation becomes oblique to the room walls.
7.3
Setup data
Figure 17: Setup, person facing transmitter antenna
In order to replicate the measurements, information of various things that may affect the outcome of the measurements were noted. The temperature and humidity were noted, as well as the marking on the cables. In Table 2 the distances for the setup in Figure 17, i.e. the distances between antennas and measurement positions in the chamber.
Humidity: 37% Temperature: 21°C.
Circumference of test person≈ 1.2 m.
Center of antennas is placed≈ 1 m up from the floor.
d (m) #2 - #3 6 #2 - X 4.24 #3 - X 4.24 #3 - A 6.24 #2 - B 6.24 Table 2:
Distances for Figure 17
Antenna Chamber Control room #2 w53.07 w64.01 #3 w64.02 w18.03
Table 3: Labeling on cables used
4DELTA Development technology AB, V¨asterås, is an accredited test and consulting company with focus on EMC tests and environmental certifications.
Figure 18: Metal rod vertically orientated in front of the 400 MHz antenna.
Figure 19: The s11parameter for the rod, rotated horizontally an vertically, respectively. The higher signal at 400 MHz implies that the horizontally rotated short-circuited the E-field.
7.4
Calibration of antenna cables
When changing the setup scene, moving antennas, switching cables or antennas, new calibration must be performed due to ensure the correctness of the measurements. The calibration is performed using the calibration menu of the vector network analyser (VNA). Prior the measurements, calibration for reflection parameters s11, s22and for transmission parameters s12, s21was performed using calibration tools for open, through, match, and short. A one-port calibration using open and short to ensure that the measurement error caused by mismatch in the analyser source port and reflection tracking error are taken in to account. To account for transmission tracking error the through calibration tool is used [63].
7.5
Polarisation test
To determine how the fields propagates from the 400 MHz antenna, a test was performed. A thin metal rod was orientated in two distinct directions, right in front of the antenna. With the rod vertically placed, the s11 signal was nearly identical to the empty room scenario, as seen in Figure 19. When capturing the signal with the rod horizontal, the signal is significantly larger. This implies that the metal rod short-circuit the E-field. The antenna in Figure 18 is placed with the electrical field propagating in horizontal plan i.e. horizontal polarisation.
7.6
Data collection
Some different scenarios where chosen during the initial measurement session. First, the empty room as seen in Figure 16, was captured with both antennas assumed horizontally polarised, i.e. 0° antenna polarisation. When placing a person in this scenario, no change in the S21was seen, but when rotating the receiver antenna to vertical polarisation, i.e. the antennas being 90° polarised relative to each other, the signal behaved differently.
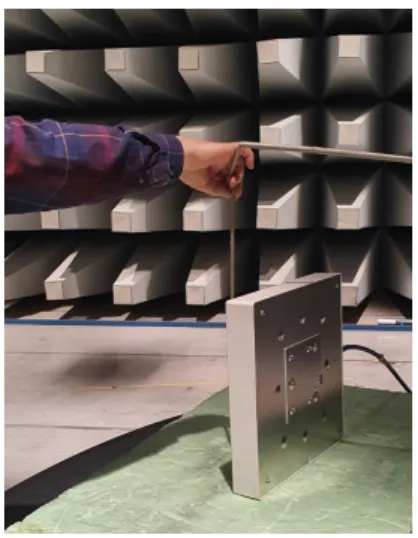
A reference for empty room with 90° antenna polarisation was captured. The graphs below shows the reflection when a person standing in different orientations and locations. In Figure 20 the human object stands with the legs wide apart, facing the transmitter antenna. A distinct drop in dB is seen just below 360 MHz. But, more interesting is the about 4 dB increase at 400 MHz. The wavelength at 400 MHz is about 0.75 m, the human object has a circumference of 1.2 m around the shoulders. But, the vertical center of antenna is about 1 m, so it can be assumed that the increased signal is diffracted from irradiation that encounters the upper thigh. This indicates that a strong diffracted field is captured by the transmitter, thus is this an indication of that principle #1 and #2 in section 2.6 are demonstrable.
In Figure 21, when raising the arms straight out to the sides, the signal strength increased even more at 400 MHz, almost 6 dB from the empty scenario. This can be interpreted as at the height, where the
Figure 20: Person facing transmitter antenna, standing with spread legs, causing the signal increment at 400 Mhz
Figure 21: Person facing transmitter antenna, standing with spread legs and arms straight out to the sides, note the signal increment at 400 MHz
Figure 22: Person standing straight, side towards transmitting antenna, causing an amplitude drop at 400 Mhz
Figure 23: Person standing at position A and B, facing receiver antenna. Note the different output (antenna bandwidth 380 to 430 MHz) for different positions, see Figure 17 for reference
transmitting wave encounters the human object now is even more equal to a wavelength, therefore a stronger diffraction is intercepted by the receiver antenna. Standing with the side towards the transmitter antenna, gives a distinct increment of approximately 3 dB around 350 MHz in Figure 22, a frequency associated with a shorter wavelength of 0.85 m. This may because the human is not circular, and with the side towards the transmitter, the diffraction spreads as from a thinner object. In Figure 23 it is also seen that the strongest diffraction not only depends in the circumference, but on also on the area where the incident wave encounter. The side to the transmitter gives a similar signal as in Figure 22, even when the person is placed in the non-center. This implicates that the strongest diffraction not necessarily needs to be captured at a 90° angle from transmitter. A comparison of the three different body positions, standing at position X (Figure 17), is visualised in Figure 43 and clarifies that the attenuation of the signal is much lower with the narrow side to the transmitter, than when rotated.

![Table 1: Dielectric data for some chosen tissues at 400 MHz and 200 MHz [20, 57]](https://thumb-eu.123doks.com/thumbv2/5dokorg/4807025.129182/22.892.172.726.417.956/table-dielectric-data-some-chosen-tissues-mhz-mhz.webp)