Mälardalen University School of Sustainable Development of Society and Technology MIMA-International Marketing EFO705, Master Thesis Tutor: Tobias Eltebrandt Examiner: Ole Liljefors
CONSUMERS’ SWITCHING BEHAVIOR
IN THE NEW SWEDISH ENERGY MARKET
Group 2512 :
Thuy Linh Nguyen-860109
Acknowledgement
For our final Master’s project, we would like to express special gratitude to our supervisor and adviser Tobias Eltebrandt who guided us through the advancement of our thesis. By giving us suggestions to improve our work, our survey got more intellectual weight and value. Our regards go as well to our friends who have been reading our study step by step and came up with advices in developing our final thesis. Therefore we thank Saksakaow Katekaew , Niramol Meemooltong , Rong Pan, Jittranuch Lertchaiworakul, Songsathit Lorgunpai, Ha Luong Ngoc, Waqas Anis, Akmal Mehmood Kalair and Himmet Baran. For reviewing our questionnaire sheet, we express gratitude to Laura Karpowicz, Olivia Sutter and Chayanut Phuaksawat who helped us in distributing it. Lastly we dedicate this acknowledgement page to all the persons who took part in our survey for the time they offered answering our questions which built our thesis.
Abstract
Date: May 28th, 2010
Course: Master Thesis EFO705, International Marketing Tutor: Tobias Eltebrandt
Author: Maite Menuet
Thuy Linh Nguyen
Title: Consumer’s switching behavior in the new Swedish energy market
Problem: Sweden is well-known to be a clean and environmental friendly country. Its inhabitants try as well to be involved in this matter. Indeed, the government invests intensively in institutes and universities to develop the new electricity market but the population has to be willing to switch its supplier. Previous surveys show us the consumer’s desire in being part of the renewable energy project and in helping the government to reach its goal. However, ambitions and reality still have a gap between them and not that many Swedish citizens switched electricity suppliers or acquired household equipments which consume less. Therefore, there is one problem should be researched is that what would increase the number of Swedish consumers switching to green electricity suppliers.
Purpose: The purpose of this study is to investigate elements which influence Swedish consumers switching or not switching between electricity suppliers and then to find out the factors could increase the potential Swedish customers of green electricity suppliers.
Method: This study is primarily based on quantitative research using survey method. The Push- Pull- Mooring migration model is applied. The data collection comes from two sources, primary and secondary.
Conclusion: The factors which motivate the Swedish customer of switching electricity suppliers are the low prices at an important level, the green energy market and having a supplier which is social responsible. The lack of information concerning the renewable electricity suppliers seems to be an obstacle to take into consideration which leads to say that providing more information to the consumers would be an advantage and influenced their switching intentions. Key word: Customers’ switching behaviour, green energy market, Swedish energy market,
Table of Contents
List of Figures ... 1 List of Tables ... 1 1. Introduction ... 3 1.1 Background ... 4 1.2 Strategic Question ... 4 1.3 Research Question ... 4 1.4 Contribution ... 5 2. Methodology ... 6 2.1 Topic selection ... 6 2.2 Literature review ... 62.3 Theoretical framework selection ... 7
2.4 Research method ... 8 2.4.1 Data Collection: ... 8 2.4.2 Analysis plan ... 11 2.5 Obstacle in research: ... 11 2.6 Limitation: ... 11 3. Theoretical framework: ... 12
3.1 The PPM (push, pull, mooring) migration model: ... 12
3.2 Conceptual Frameworks Model ... 12
3.2.1 Concepts in PPM Migration Model ... 12
3.2.2 The PPM Migration Model of Service Switching ... 15
3.2.3 The connection between the concepts ... 16
4. Findings ... 17
4.1 Renewable electricity suppliers and Swedish consumer’s overview ... 17
4.1.1 The different methods used to provide renewable energy ... 17
4.1.2 Sweden shows the best result in the renewable energy ... 18
4.1.3 How many electricity suppliers produce from green resources? ... 18
4.1.4 The cost of dealing with one of these suppliers ... 19
4.1.5 The switching cost ... 21
4.1.6 Swedish customers in electricity market ... 21
4.2 Survey results ... 24
4.2.1 General information about the respondents ... 24
4.2.2 Motivation in choosing their current electricity supplier ... 24
4.2.3 Perception of the current supplier ... 25
4.2.4 Attitude and Intentions towards switching ... 27
4.2.5 Influence ... 29
4.2.6 Price perception ... 31
4.2.7 Obstacles ... 33
4.3 The survey results in brief ... 35
5. Analysis ... 36
5.1 Determinants of the choice to switch electricity supplier: ... 36
6. Conclusion ... 41 7. Recommendations ... 42 Reference List ... 44 APPENDIX 1 ... 48 QUESTIONNAIRE IN SWEDISH ... 48 APPENDIX 2 ... 50 QUESTIONNAIRE IN ENGLISH: ... 50 APPENDIX 3 ... 53
List of Figures
Figure A: The PPM migration model p. 13
Findings Part
Figure 1: Renewable electricity production in relation to gross use of electricity in 2007 p 18
Figure 2: Retail price of electricity in 2009 p 21
Figure 3: Proportion of end customer of electricity who have renegotiated their contracts or switched to a new
supplier. p 22
Figure 4: Attractive factors of the current supplier p 24
Figure 5: Quality and Value of the current supplier p 25
Figure 6: Confidence in the current supplier p 25
Figure 7: The bill p 26
Figure 8: Commitment p 27
Figure 9: A good idea p 27
Figure 10: A wise decision p 27
Figure 11: Unpleasant p 27
Figure 12: Desirable p 27
Figure 13: Probability p 28
Figure 14: Subjective norms p 29
Figure 15: Paying 2 bills p 29
Figure 16: Motivation p 30
Figure 17: Past behaviour p 31
Figure 18: Price comparison p 31
Figure 19: Price comparison with green electricity p 32
Figure 20: Extra cost for green energy p 33
Figure 21: Obstacles p 33
List of Tables
Table A: Survey Questionnaire Structure p.9
Table B: Estimating margin of error on sample survey results p.10 Findings and Analysis Parts
Table 1: The suppliers of renewable electricity in Sweden p 19
Table 2: Electricity price (category house) for Alingsås Energi AB p 19 Table 3: Electricty price for Nynäshamn Energi Försäljning AB p 20 Table 4: Change in electricity supplier during 2005 and 2007 p 22
Table 5: Nationnality p 52
Table 6: Gender p 52
Table 7: Accommodation p 52
Table 8: Motivation p 52
Table 10: Confidence p 53
Table 11: Bill studied p 53
Table 12: Commitment p 53
Table 13: A good idea to switch p 53
Table 14: A wise idea to switch p 53
Table 15: Switching is unpleasant p 54
Table 16: It is desirable to switch p 54
Table 17: Probability p 54
Table 18: Subjective norms p 54
Table 19: Paying 2 bills p 54
Table 20: Motivation for a particular supplier p 55
Table 21: Past behaviour p 55
Table 22: Price perception and competitors p 55
Table 23: Price perception and green market p 55
Table 24: Extra cost for green energy p 55
Table 25: Obstacles p 56
Table 26: Variables included in the analysis: definitions and descriptive statistics p 36 Table 27: The determinants of the choice to switch electricity supplier: using probit model p 38 Table 28: The determinants of the choice to switch electricity supplier: using LP model p 40
1.
Introduction
In an important number of countries, the electricity market has been deregulated few years ago. It is the case in Sweden and means that the consumers have total control in the choice of their electricity suppliers. Indeed, the electricity market is clearly focusing on renewable energy in our days and the consumers are involved in this matter. It had been observed that Swedish households started to switch suppliers regarding their environmental issue’s concern. However even the consumers’ desire of switching suppliers is high, Swedish population is still not doing it actively. (Ek & Söderholm, 2008)
The process of switching electricity’s suppliers does not seem easy. In fact, in Sweden, the consumers have first to see if their electricity network operator and the electricity supplier are part of the same organization. If it is not the case they will have two different invoices which means two contract as well. Selecting a supplier take also time as the consumer should evaluate the offer and compare it with what he beneficiates actually. When the decision of switching suppliers is made, it is time to renegotiate the contracts. First of all the consumers have to be aware that, as in every kind of contracts, they must have a period of notice. Many suppliers extend automatically the contract so the consumers should contact their suppliers and ask for information regarding the way to cancel their old contract in time. However, before taking the decision of cancelling the previous contract, the consumers might contact the new supplier as the electricity network operator has to be informed of the situation. It takes appreciatively 15 days. Moreover, the consumers should know exactly the cost of their switching decision. It does not only concern the energy’s consumption. In fact, they will have to pay taxes to the authorities. In addition, they should take into consideration the RECS fee which is: ―Renewable Electricity Certificate System‖ fee and which varies from one supplier to another. (Svensk energi, 2007)
Our thesis will observe the different offers present on the Swedish market and will determine why the consumers are willing to switch electricity suppliers but do not do it. Is it a matter of time, interest, lack of information or the cost?
Background
Sweden consumes a large amount of electricity per capita. However, Swedish carbon emission is below EU average since 90 percent of electricity of Sweden comes from nuclear power and hydroelectric power. They put a lot of effort into developing renewable energy and alternative fuels. The government also invests heavily in information and advice on how to save energy for households. In the report from 2008 of the International Energy Agency, Sweden is ranked highly on most counts by low carbon dioxide emissions, a high proportion of renewable fuels and an efficient electrical power market. (Swedish Institute, 2008)
The Swedish Energy Agency plays as well an important role in this area; Indeed it works in collaboration with authorities; universities; research institutes. Through them they can acquire knowledge and look for solution and new technologies to develop sustainable energy in the Swedish market and in other markets. The agency processes and tries to commercialize new energy systems. The agency deals as well with the European ambitions which are to develop wind power; solar energy; bio energy; CO2 capture, transport and storage. (Swedish Energy Agency, 2009)
Furthermore, Swedish institutes also developed the energy power acquired by the Baltic Sea waves. In Uppsala, searchers are working on a unique technology to create energy over the last 6 years. It is now ready and appeal scientists and governmental representative from everywhere. This technology consists in using the power of the waves; the pressure is not that strong compared to solar energy or wind power. However these two represent respectively availability, in hours, of 1,000 per year, 2,200 hours per year and the wave power an availability of 4,000 hours per year. (Wiles, 2008)
Strategic Question
What would boost the number of Swedish consumers switching to green electricity suppliers?
Research Question
What factors influence Swedish consumers switching or not switching between electricity suppliers?
Contribution
The final objective of our thesis is to evaluate the obstacles that the consumers face regarding the switching decision so our work is based to help the electricity suppliers as well as the government. With our questionnaire analysis, it will be easy for the suppliers to understand the consumers’ fears and adapt their offers according to them. As the government plays as well an important role in the development of this new market by investing money in institutes and universities, our data will give it more understanding about the consumers’ expectations and the way they should tax these new offers.
2.
Methodology
In order to describe how our research is developed, this chapter will start with the topic selection and literature review. Subsequently, we would like to present how theoretical framework selection, research method, data collection and analysis plan are developed.
2.1 Topic selection
We chose to work on the new energy market for several reasons. First of all, we do not know that much about this market and it is for us an opportunity to increase our knowledge. Secondly, we are exchange students in Sweden and discovered quickly that being environmental friendly is an important matter for everyone here. Moreover, Swedish people have control on the choice of their electricity suppliers which is not the case in our countries (Vietnam and France). Having the possibility to get renewable energy is a chance to contribute in the climate change and environment saving. Finally, reading articles regarding these issues and the offers given to the consumers to counteract them made us confused with the low numbers of consumers involved in this matter. That is why we want to base our thesis on Swedish inhabitants’ behaviour in order to understand what are the reasons stopping them from switching electricity suppliers to become more environmental friendly.
2.2 Literature review
The literature searches has been conducted in order to support us making the decision of the area to focus, the core theory for the framework and gaining the sufficient knowledge.
First of all, we started looking for existing articles and researches from university databases and website including Emerald, ScienceDirect and the main search engine website such as Scholar Google. The keywords we used in searching are ―Electricity suppliers in Sweden‖ ―Consumer behaviour‖ as well as ―Switching behaviour‖.
There are many articles studying about consumer switching behaviour and we found a useful one that is ―Customers switch behaviour – a case of travel agencies‖ (Wen-Yi, 2009). This article is not totally correspondent to our topic but somehow facilitate us finding the theories we need for our research. From this article, we are interested in some theories of Bansal, H.S, Taylor, S.F and James, Y.S studying about consumers’ switching behaviour. Their theories have been studied in not only travel industry but also banking service, hair styling service or auto repair services (Wen-Yi, 2009). We will discuss in detail about how the conceptual framework developed in the following section.
In order to gain in-depth knowledge about consumer switching supplier in Sweden, we continued to look for other articles. With the same authors, two articles are ―Barriers to consumer switching in the Swedish electricity market‖ (Gamble, Juliusson, Garling, 2007) and ―Consumer attitudes towards switching supplier in three deregulated markets‖ (Gamble, Juliusson, Garling, 2009) giving us an insight in consumer attitudes in the Swedish electricity market. They also introduce us to the other approach of consumer switching behaviour analysis that is binary probit model.
While studying about econometric model, we found that the great way to apply a binary probit model for our thesis is to use the statistical software named Stata. Subsequently, we went through ―Introduction to Stata‖ (Baun, 2009) to learn more about Stata software. As Baun said, Stata is a full-featured statistical programming language which is used by many users working in research, especially in the fields of economics, sociology or political science. Stata is excellent software for data analysis; therefore, it would be a useful tool for our thesis.
2.3 Theoretical framework selection
Since service provider switching can impact considerably on a company, the theory of service provider switching plays a vital role to understand why customers want to switch their service providers. There are many previous studies aiming at explaining differences in consumer switching behaviour by finding out determinants that might influence switching such as the perceived cost of switching (e.g., Ping, 1993), alternative attractiveness (e.g., Jones, Mothersbaugh, and Beatty, 2000) attitudes toward switching (e.g, Bansal and Taylor 1999b) trust (e.g, Chaudhuri and Holbrook 2001) commitment (e.g Hennig – Thurau, Gwinner and Gremler 2002) and so on. To date, attempts in order to provide a theoretical framework for the relationships of these determinants have been limited (Bansal, Taylor and James, 2005). In order to answer the research question, we found out a unifying framework for understanding consumers’ switching behaviours that is the Push-Pull-Mooring model of service switching of Havir S.Bansal, Shirley F. Taylor and Yannik St. James. The advantage of this model comparing with previous studies is that embraces both economic and psychological influences on switching behaviour (Ek & Söderholm, 2008). We are interested in this model since it can be used to identify key moderating relationships among drivers of service provider switching, suggest new predictors of switching and understand other facets of switching (Bansal, Taylor and James, 2005).
2.4 Research method
2.4.1 Data Collection:
We acquired information from two sources which are primary data and secondary to accomplish our research as follow:
Primary data:
Since information from Swedish customers are certain important for our research in order to investigate about Swedish switching behaviour in electricity market, we chose the quantitative research as our main research method and questionnaires are data collection tool.
Questionnaire format:
As suggested by Fisher (2006, p 193), the question format must be appropriate with the aim of data collection. We selected the main questionnaire format as follow:
Multiple choice questions used in the questions about background provide respondent with selection of the provide options deployed
Dichotomous questions offer respondent just two alternative answers to choose between. This format is used when the issues is straightforward. Especially, the dichotomous question 2 and 5 are applied to filter Swedish customers.
Checklists are also applied in this questionnaire in order to allow respondents to choose as many answers as they want
Open questions are used in question 20 and 28 since they allow respondent to give his/her opinions and perceptions
The last but playing the most important kind of question format in this survey is Rating and Likert scale in order to gain respondent’s evaluation or attitude towards specific issues.
(Fisher, 2006, p 193 – 197)
Questionnaire design:
Since the data will be collected from Swedish customers, the questionnaire will be translated from English to Swedish. The questionnaire’s length is two pages which could be considered as suitable to a Master’s thesis from the view of Fisher (2006, p 192).
The structure of the survey questionnaire principally follows the conceptual framework of this research as follow:
Issues Section Question Content Swedish consumer switching behaviour in electricity market Background Questions 1-8 (and Question 29) General information of Swedish respondent Respondent’s current electricity supplier Questions 9-14 - Satisfaction evaluation - Quality - Trust - Value - Commitment - Price perception
Personal factor Questions 15-22
- Attitude towards switching - Subjective norms - Past behaviour - Switching intension - Price Perception New energy market Questions 23 - 28 - Alternative attractiveness
Table A: Survey Questionnaire Structure
Some examples of questions: Price perception:
15. Compare to its competitors, I believe that my electricity supplier’s prices are: � Lower � The same / average � Higher � Don’t know
Trust:
12. ―I have confidence in my present electricity supplier‖
� Strongly disagree � Partly disagree � Do not know � Uncertain � Partly agree �
Strongly agree
Switching intentions:
21. What is the probability that you would switch from your current electricity supplier to a new one
� Unlikely � Likely � Improbable � Probable � No chance � Certain Sample size:
Concerning the sample size, we decided the population and the margin of error as suggestion in Fisher book. It is said that the expected response could be approximately predicted by the margin of error and population. Non-probability sampling that is respondents are chosen from
the population in some non-random manner is used in our thesis as sampling methods. (Fisher, 2006, p 190)
Table B: Estimating margin of error on sample survey results Source: Fisher (2006, p 190)
The target population of this research is consumers who live in Sweden and have possibility to make decision of selecting electricity supplier. Therefore, the population size should be all residents of Sweden. The lasted number published by Statistics Sweden estimate that the population of Sweden is 9.34 million at 1st January 2010. The margin of error on the sample survey results should be 5%. As can be seen from the table above, with the population is nearly 10,000,000 and the margin of error is 5%, the number of completed questionnaires necessary is 384.
Distributing questionnaire:
Since the questionnaire has been translated from English to Swedish, in advance, we wanted to make a pilot on 20 respondents in order to make sure Swedish people do not have any problem to answer our questions. At the same time, we asked them to give us suggestions to improve our questionnaires.
Afterward, we continued to distribute our questionnaire to respondents. We intended to hand out them in central station and bus stop in Västerås, Stockholm and Linköping. We also distributed in the train from Västerås to Stockholm, Västerås to Linköping, Västerås to Eskilstuna, Linköping to Stockholm (and the ways back) since people in the train are more willing to give cooperation.
Secondary data:
We collected data to acquire information about the overview of Swedish consumers in electricity market from secondary sources. The websites of Emerald, ScienceDirect provide us
a useful data about Swedish consumer after electricity market deregulated and previous studies about Swedish consumers switching behaviour. Some elements of conceptual framework such as switching cost and prices for green electricity compared to basic one, we decided to find from secondary data as well. Moreover, secondary data also give us clues to do the research of primary data.
2.4.2 Analysis plan
We interpreted our questionnaire by using the software application package named Stata. Firstly, in order to input the data we collect to the software, we have to set up the code in the questionnaire. Subsequently, we use the software to sum up and present our result by number, percent and graph. Furthermore, by applying probit and LP model, we can present the results of the econometric analyses to explain the differences of consumers in electricity switching behaviour. Eventually, we will combine the result from the finding to find out the determinants of the choice to switch or not switch electricity supplier.
2.5 Obstacle in research:
As we mentioned above, we planned to distribute our questionnaire in the train and busses since people are more willing to give cooperation and could spend their time to fill our questionnaires. However, we faced with a problem that distribution questionnaire for any purpose is not allowed by SJ Company if we did not have their permission from their administrator before. Therefore, we were stopped by the ticket checker in the trains and it wasted a lot of our time in managing and getting enough 384 questionnaires.
Furthermore, we coped with other difficulties from our limitation of Swedish language skills. It occurred when we distributed to Swedish who do not know English and gathered information in Swedish from open questions in our questionnaires.
2.6 Limitation:
393 is the number of completed questionnaires we collected which is considered to be sufficient as Fisher (2006, p190). However, we had to sort out any questionnaire including ―do not know‖ answer in term of using quantitative analysis since ―do not know‖ answer should be coded as missing data and Stata software does not use them as observation. The number of observations using in quantitative analysis therefore is 79, instead of 393, which is considered to be the limitation for our dissertation in view of the fact that we have only 10 weeks to complete this task.
3.
Theoretical framework:
The PPM (push, pull, mooring) migration model:
In order to choose the main theory we will be using, we read several books and articles such as the article ―Households’ switching behaviour between electricity supplier in Sweden‖ written by Kritina Ek and Patrik Söderholm (2008) and ―A three-component model of customer commitment to service providers‖ studied by Harvir S. Bansal P. Gregory Irving and Shirley F. Taylor (2004). In the first article, we found out that ―push‖, ―pull‖ and ―status quo‖ effects influence the consumer’s switching intentions and in the second one, the role of the ―subjective norms‖, ―satisfaction‖, ―trust‖. The PPM model is the one we finally chose to conduct our thesis as it represents the combination of these two different theories. In fact the PPM model takes in consideration the 3 factors that affect the switching intentions and explained what the determinants for each element are. (Bansal, Taylor, James, 2005)
Conceptual Frameworks Model
Colin Fisher (2004) explained in his book that the first important stage while building a conceptual framework is to define the terms and concepts used in it. Indeed we should start by describing and clarifying the elements which compose the theory and continue on their relationships and connections between each others.
3.2.1 Concepts in PPM Migration Model
As Bansal, Taylor and James (2005, pp. 96-115) explain, the ―Push‖ effects are the result of a negative experience. They can be defined as the factors which will encourage the consumer in stopping any relationship with his actual supplier. When the ―push‖ factors are strong, it means that many reasons influence the consumer in leaving the relationship where he is. To determine is the ―push‖ effects are important and can conduct to a switching behaviour, several factors are taken into consideration.
- Satisfaction: indeed a consumer dissatisfied will be pushed in considering other options to solve his problem.
- Quality: it can be physical or economical. The quality’s perception of a service will be determinant in the decision of repurchase.
- Value: it is a direct influent on the switching behaviour. Value can be defined as the ―trade-off between quality and sacrifice‖.
- Trust: it comes with honesty from the supplier. Having a relationship built on trust clearly lead to high or realistic expectations from the consumer. Indeed with trust, the consumer will expect that his supplier fulfil his promises. When it is not the case, the trust can be affected and the consumer repurchase’s intentions may change.
- Commitment: it is the result of trust. If the trust is strong, the consumer will see the investment as worth in and commit.
- Price perceptions: the past year, the economy has been quiet unstable which pushed consumers to be careful in their spending. It had been proved that pricing issues can be at the origin of a switching intention. It does not always mean that the price is high but that the consumer perceives it as high. If it is the case, it will strongly influence the ―push‖ effects.
To resume, if the satisfaction, quality, value, trust and commitment are low while the price perception is high, the consumer will tend to switch supplier.
The ―Pull‖ effects relate to positive perceptions. Indeed they correspond to the alternative attractiveness. When a consumer sees that the competitors of his supplier offer attractive service, it influences his choice in switching provider. In overall, the higher the alternative attractiveness is, the higher chance of the switching behaviour’s presence will be. (Bansal, Taylor, James, 2005, pp. 96-115)
The ―Mooring‖ effects, also called ―status quo‖ effects have a clear influence on two decisions: the one to start evaluating different services’ suppliers to know if their offers are attractive and the one leading to the decision of staying for the actual supplier or not (Ek & Söderholm, 2008)
As for the ―Push‖ effect, the ―Mooring‖ effects are influenced by various factors which are: - Switching costs: they include any kind of costs such as financial and emotional costs. It
considers as well the time spent, efforts and ability in switching.
- Attitude towards switching: it influences the switching decision. If the attitude towards switching process is favourable, the switching intentions will follow.
- Subjective norms: they are the most difficult factors to analyze as they are external to the consumer. These norms concern social pressure that is active on the consumer’s opinion. Previous researches proved that these factors have an influence on switching intentions as well as culture norms which moderate the relationship existing between the quality and the switching.
- Prior switching behaviour: as its name indicates, it corresponds to the switching behaviour that the consumer had in the past. If the consumer had already switch supplier, his positive or negative experience will strongly influence his future decisions. - Variety seeking: this factor is related to the ability of the consumer in making an approach to have more information about a new service. Someone with high variety seeking is curious on knowing what the competitors offer and like to compare with his own supplier. Therefore, if the variety seeking is low, the mooring effect will be influence in a negative way.
So if the consumer has not switch supplier by the past, the seek variety is low, consumer’s attitude and subjective norms as well and the switching costs are high, the likelihood that consumers switch provider is low. (Bansal, Taylor, James, 2005, pp. 96-115)
3.2.2 The PPM Migration Model of Service Switching
Figure A: The PPM migration model (Bansal, Taylor, James, 2005)
Low Quality Low Satisfaction Low Value Low Trust Low Commitment High Price Perceptions Push Effects Switching Behavior Switching Intentions Unfavourable Attitude towards Switching Unfavourable Subjective Norms High Switching Cost Infrequent Prior Switching Costs Low Variety Switching Alternative Attractiveness Pull Effects Mooring Effects
3.2.3 The connection between the concepts
As explained above we have 3 different effects which influence the switching intentions: - ―Push‖ effects which can encourage the consumer to leave his supplier
- ―Pull‖ effects which can attract the consumer to develop a relationship with a new supplier
- ―Mooring‖ effects which can inhibit or facilitate the switching process.
The all have a role in the switching decision. However they are not independent. Indeed, it is not because the ―push‖ effects are strong that the consumer will resign his contract with his supplier. As well as, it is not because the ―pull‖ effects are important that the consumer will definitely go to the competitors. The decision of switching will be the result of their combination: ―pull‖ and ―push‖ effects might be strong. Moreover, the ―mooring‖ effects have a direct and negative link with the switching intentions. They moderate the relationship between ―push‖ and ―pull‖ effects and if they are strong, the consumer will tend to stay with his current supplier. (Bansal, Taylor, James, 2005, pp. 96-115)
4. Findings
Our findings part will be divided into two differents sections. We will firstly describe the offer of the renewable electricity suppliers, its price and the market situation. Then we will have a Swedish consumer overview since the market has been deregulated. Secondly, we will illustrate the ―survey research‖ via our questionnaire’s results.
Renewable electricity suppliers and Swedish consumer’s overview
These overviews take place in our findings in order to give to the reader a good understanding of the market situation, its actors and provide the previous data concerning the consumers’ behaviour. This information is taken from secondary data.
The different methods used to provide renewable energy
Renewable energy is also known as ―alternative energy‖ which used only energy provided via exploiting natural resources. There are different ways to offer renewable energy to consumers; by using:
- ―Sun Solar power - Wind Eolic power
- Rivers and fresh water currents Hydraulic power - Seas and oceans Tidal power
- The heat of the Earth Geothermal power - Waves Waves power
- The movement of masses of freshwater to masses of saltwater Blue energy.‖ (Assmus, 2009)
Sweden uses most of these methods to develop a sustainable energy. In March 2010, Maud Olofsson, the Swedish Energy Minister announced that the country will focus more on developing its activities in cogeneration plants, bio fuels and wind power. In fact 2,000 wind turbines are being added in the Swedish landscape right now, which will contribute in 10 terawatt hours more, per year, of renewable energy. (Yoneda, 2010)
Moreover, in February 2010, the project of Seabased AB and Fortum (3rd Swedish electricity supplier) has been made public. With the financial support from the Swedish Energy Agency pushed by the government to develop new technologies, these companies will build the world’s largest wave power plant. The total cost of the project will reach SEK 250,000,000 in order to
build 400 to 500 units which will provide energy for industries as well as for individuals. (Eriksson, 2010)
Sweden shows the best result in the renewable energy
From recent data, it had been revealed that the European countries the most involved in developing renewable energy are: Germany, Sweden and Denmark. Indeed they all have made goals for 2020. Denmark wants to reach 30% of its energy provided from renewable energy and Sweden, 50%. Sweden’s vision is not whimsical as it has already shown its capacity. Indeed, 44% of the energy and 52% of ―Consumed‖ electricity come from renewable sources which place Sweden ahead of all the European countries. (Lejournal, 2010)
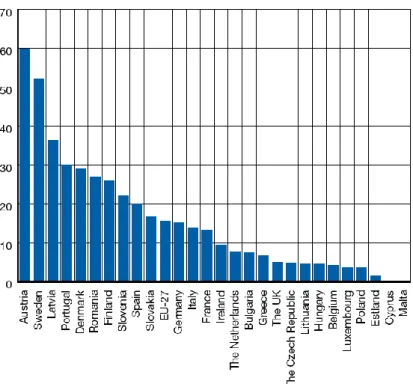
In 2007, renewable energy was already an important part of the Swedish energy production and Sweden was one of the European the most engaged in its development.
Figure 1: Renewable electricity ―Production‖ in relation to gross use of electricity in 2007 (Jacobson, Lindberg, 2009)
As we can see on this graph, in 2007, renewable electricity production represented more than 50% of the total electricity production.
How many electricity suppliers produce from green resources?
To be considered as a renewable or green electricity supplier, companies need to receive a label called ―Bra Miljöva‖ which by translating into English means ―Good environmental
choice‖. This eco-label is delivered from the institution SSNC: Swedish Society for Nature Conservation. (Naturskyddsforeningen, 2010)
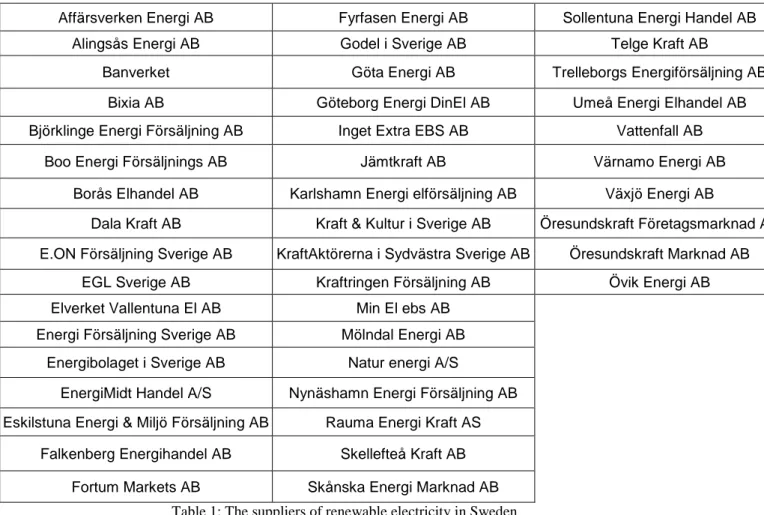
We can count 44 suppliers having this ecolabel:
Affärsverken Energi AB Fyrfasen Energi AB Sollentuna Energi Handel AB
Alingsås Energi AB Godel i Sverige AB Telge Kraft AB
Banverket Göta Energi AB Trelleborgs Energiförsäljning AB
Bixia AB Göteborg Energi DinEl AB Umeå Energi Elhandel AB
Björklinge Energi Försäljning AB Inget Extra EBS AB Vattenfall AB
Boo Energi Försäljnings AB Jämtkraft AB Värnamo Energi AB
Borås Elhandel AB Karlshamn Energi elförsäljning AB Växjö Energi AB
Dala Kraft AB Kraft & Kultur i Sverige AB Öresundskraft Företagsmarknad AB E.ON Försäljning Sverige AB KraftAktörerna i Sydvästra Sverige AB Öresundskraft Marknad AB
EGL Sverige AB Kraftringen Försäljning AB Övik Energi AB Elverket Vallentuna El AB Min El ebs AB
Energi Försäljning Sverige AB Mölndal Energi AB Energibolaget i Sverige AB Natur energi A/S
EnergiMidt Handel A/S Nynäshamn Energi Försäljning AB Eskilstuna Energi & Miljö Försäljning AB Rauma Energi Kraft AS
Falkenberg Energihandel AB Skellefteå Kraft AB Fortum Markets AB Skånska Energi Marknad AB
Table 1: The suppliers of renewable electricity in Sweden
These are all the suppliers which received the ecolabel ―Bra Miljöval‖ since 1996; Depending on their location, the consumers can easily track each of their offers and contact them to have more information. (Snf, 2010)
The cost of dealing with one of these suppliers
As it is not easy to find an average of the price applied to renewable electricity for household, a study of few suppliers’ offer will be done.
First of all, Alingsås Energi AB prices are:
KWh consumed Price in SEK per year
15 000 12854
20 000 17139
30 000 24988
40 000 32114
Table 2: Electricity price (category house) for Alingsås Energi AB (Alingsås, 2010)
For the supplier Mölndal Energi AB, the price varies from SEK 1.03 to 1.08/KWh depending on the duration the consumer has been having a contract with the supplier. (Mölndal, 2010)
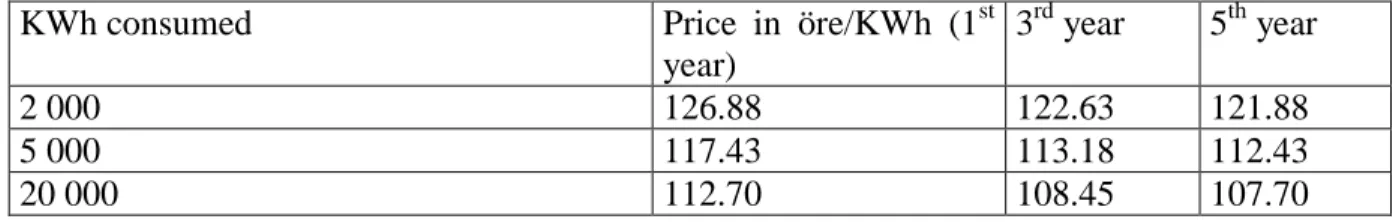
For Nynäshamn Energi Försäljning AB, it depends on the consumption and the duration:
KWh consumed Price in öre/KWh (1st
year)
3rd year 5th year
2 000 126.88 122.63 121.88
5 000 117.43 113.18 112.43
20 000 112.70 108.45 107.70
Table 3: Electricty price for Nynäshamn Energi Försäljning AB (Nynäshamn, 2010)
In overall, the price varies here between SEK 1.08 and 1.27/ KWh.
The supplier Vattenfall ABoffers electricity for the price of SEK 1.09/KWh the 1st year which is reduced to SEK 1.06/KWh the 3rd year. (Vattenfall, 2010)
We can observe here that these suppliers offer prices to individual which are close to SEK 1/KWh.
However, the taxation should not be forgotten. Indeed for renewable electricity, the consumers have to pay for the green certificate. The price depends on suppliers but in 2004, the average cost was Euro 0,26/KWh which corresponds to SEK 2,6/KWh (EAES Holmenkollen, 2005)
The average price for 1KWh for renewable electricity is then close to 3,6 SEK.
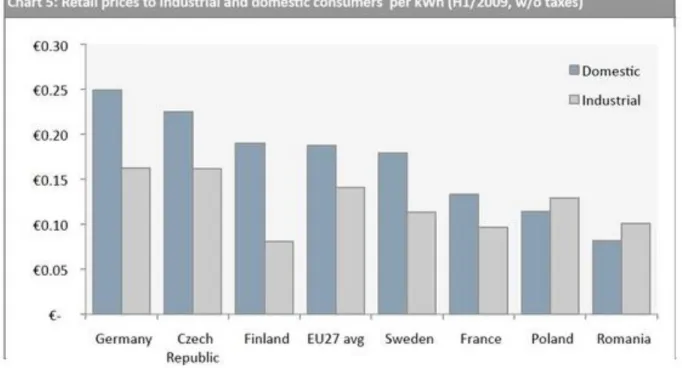
To compare with other electricity suppliers, the grid below shows the cost paid by consumers among different European countries.
Figure 2: Retail price of electricity in 2009
The cost for electricity in Sweden is approximately SEK 1,75/KWh which contributes in saying that in overall the suppliers providing from renewable sources offer electricity at a price which is 100% higher than the other offers. (Businessnew, 2009)
The switching cost
The switching cost in Sweden, like all of the Nordic countries, is free of charge but has rules to follow. Indeed in Sweden the switching process is possible only on the first day of each month. (Pakkanen, Johnsen, Olsen and Narva, n.d, p. 17)
Swedish customers in electricity market
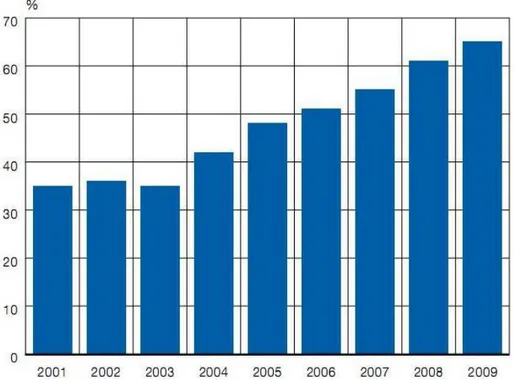
Electricity is a commodity that is invisible and completely homogenous product. It is a product which people has to buy ―all the time‖ and not often even thought of. For that reason, there are no regular buying decisions making. In general, customers are quite low interested in electricity suppliers. Many customers are not made any decision since the fact that their contract with incumbent electricity supplier have continued automatically if they do not want to renegotiate or switch to another one (Pakkanen, Johnsen, Olsen and Narva, n.d, pp. 5-7) In Sweden, customers have had the freedom to choose their electricity suppliers since January 1996. As can be seen from the graph below, between 2001 and 2003, there are a constant proportion of end customers who had switched or renegotiated their electricity contracts, at around 35%.
Figure 3: Proportion of end customer of electricity who have renegotiated their contracts or switched to a new supplier. (Source: Energy Indicators 2009, 2010, p. 55)
From 2004 onwards, the number of people who are actively choosing to change their electricity supplier rose particularly sharply.
Between 2004 and 2006, there were some remarkable issues. First of all, the price during 2004 and 2005 was much lower than the record prices during the winter of 2002 and 2003. Many customers used this opportunity to end their contracts running for several years and sign a new one with relatively low price compared with previous years. Moreover, the electricity companies have been given a great attention in the media from those years and market activity increased significantly among the electricity trading companies, therefore, the knowledge of customers about how electricity market performs enhanced as well (Scb1, 2007)
Number of contracts: 2005 2006 Change
in percent 2007 Change in percent Households 288 417 341 249 18 422 350 24 Other 53 434 59 728 12 74 809 25 Total 341 851 400 977 17 497 159 24
Compared to 2006, there are 24 percent more household customers’ switched suppliers in 2007. A number of new rules have been introduced from 2007 onwards that make it easier to switch electricity suppliers (Scb2, 2008). Since 1 January 2007, electricity suppliers have to inform the network company of supplier change no later than the 15th of the calendar month before the change is to happen. It means that time for suppliers change has been shorten, maximum one and a half month. Besides, the consumers will obtain information on who the designated electricity trader is and when an electricity delivery agreement end (Energy Indicators 2009, 2010)
By 1 January 2009, there were more 65% of end customers who had renegotiated or switched to different suppliers. Customers who had decided to choose one or two year contract continued to fall during 2008 and 2009 while the proportion of customers who signed at least three- year contract remained constantly, around 19% (Energy Indicators 2009, 2010)
Survey results
General information about the respondents
The survey concerns people who live in Sweden and pay their electricity bill. It was not focusing on Swedish people. However our findings show that 95% of the respondents are Swedish citizens (Table 5, Appendix 3)
Concerning the gender of the respondents, around 54% are male and 46% are female which shows that both genders are concerned by the electricity matter. (Table 6, Appendix 3)
Moreover, 58% of them live in an apartment and 42% in a house (Table 7, Appendix 3)
Motivation in choosing their current electricity supplier
The main reasons they had to choose their current electricity supplier 0% 5% 10% 15% 20% 25% 30%
Low prices Good services Environmentally friendly No others suppliers available Other people use them Other Factors P e rc e n ta g e o f re s p o n d e n ts
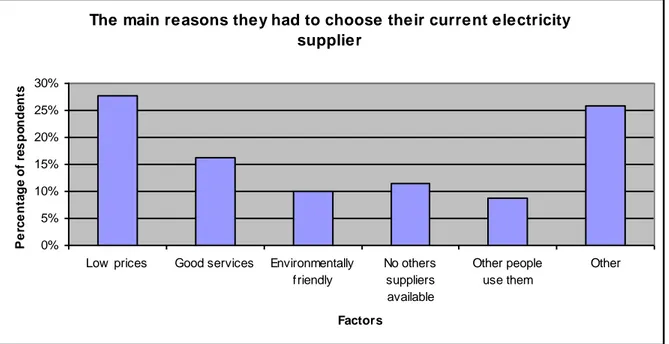
Figure 4: Attractive factors of the current supplier
The Figure 4 shows clearly that the main reason why the respondents chose their current supplier is the low price they were offering them. Indeed, 27% of the respondents noted this factor as the main reason when they signed the contract. 26% of them mentioned ―Other‖ which mainly correspond to the reason that the owner chose the supplier or the old resistant had this supplier and they did not change when they moved in. In third position, the good services have been ticked by 16% of the respondents. 11% said that they did not really have the choice. 10% of them were concern by the environment and signed with their suppliers because they were environmental friendly. Only 8% have been influenced by others and chose a supplier that other people were using. (Table 8, Appendix 3)
Perception of the current supplier
The opinion regarding the good quality and value provided by the current electricity supplier for the money spent
0% 5% 10% 15% 20% 25% 30% 35%
Strongly disagree Partly disagree Uncertain Partly agree Strongly agree
Evaluation P e rc e n ta g e o f re s p o n d e n ts
Figure 5: Quality and Value of the current supplier
As it is observed on the Figure 5, 30% and 20% of the respondents respectively party and strongly agree with the statement that their supplier provide them good value. 19% of them partly disagreed with the statement and only 8% think that their supplier does not give them a good value in comparison to the cost of the service. (Table 9, Appendix 3)
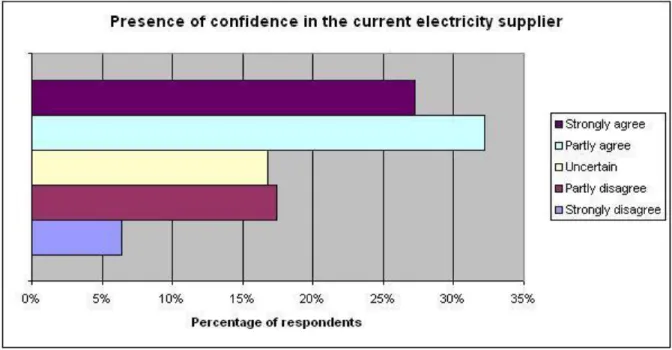
Figure 6: Confidence in the current supplier
The result on Figure 6 shows that an important proportion of respondents declared having confidence in their supplier, around 59%. 16% are uncertain and 17% do not consider having much confidence in it. Similar to the result in Figure 3, only 6% do not have confidence at all in their current supplier. (Table 10, Appendix 3)
0% 5% 10% 15% 20% 25% 30% 35% Percentage of respondents Strongly disagree
Partly disagree Uncertain Partly agree Strongly agree
Evaluation
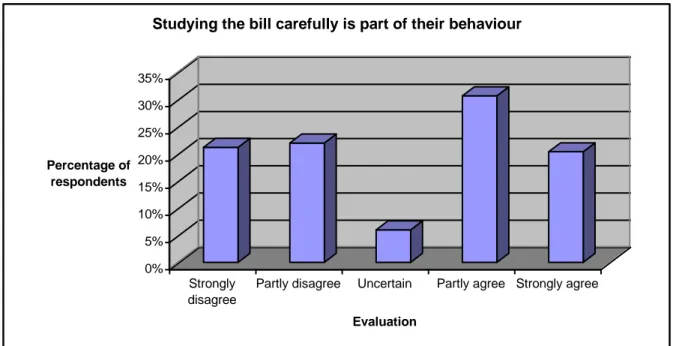
Studying the bill carefully is part of their behaviour
Figure 7: The bill
This result could be related to the previous one but is also independent as it relates more to the personality of the respondents. Indeed in the previous graph, it was shown that the respondents have confidence in their supplier. However in this figure, it is observed that 31% of the respondents affirmed that they look at the electricity bill carefully. Then the result are similar, around 20 % and 21% party agreed, strongly agreed and disagreed on this statement. (Table 11, Appendix 3)
Attitude and Intentions towards switching
The desire of changing supplier if the opportunity appears
30% 16% 31% 16% 7% Strongly disagree Partly disagree Uncertain Partly agree Strongly agree Figure 8: Commitment
The Figure 8 represents the Commitment the respondents have towards their current supplier and their desire to switch to a new one. Clearly, most of the people are uncertain about it (31%). Some (16% of them), partly agree and could switch supplier if the occasion was there. However, the majority of the respondents (around 46%) answered negatively to this statement. The people interviewed are globally committed to their actual supplier. (Table 12, Appendix 3)
The Figures 9, 10, 11 and 12 give the opinion of the respondents when it comes to switch electricity supplier. If they think it is a good idea, a wise decision, unpleasant and desirable to do it. Many of them were uncertain concerning these 4 different statements and the results are divers. Indeed 22% think it is not a good idea, neither a wise decision to change, but around 22% affirm it could be. Moreover, 28% of the people interviewed do not consider the switching as desirable. However, 61% of the respondents do not think it is unpleasant to switch. (Table 13, 14, 15, 16, Appendix 3)
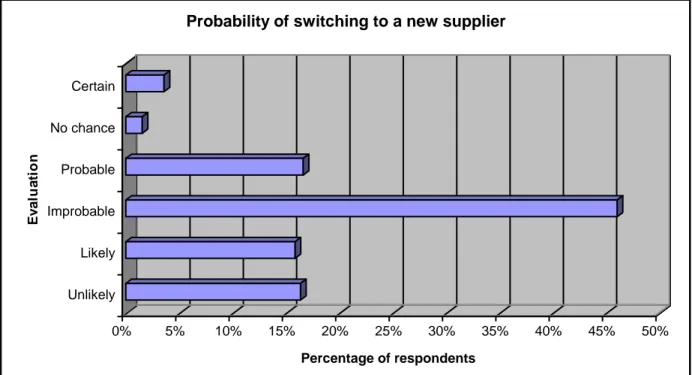
0% 5% 10% 15% 20% 25% 30% 35% 40% 45% 50% Percentage of respondents Unlikely Likely Improbable Probable No chance Certain E v al u a ti o n
Probability of switching to a new supplier
Figure 13: Probability
While it comes to the question ―What is the probability that you switch electricity supplier?‖ the result is obvious. Indeed, 46% of the respondents answered ―Improbable‖ while only 16% said it is probable that they switch in the future. The answers ―likely‖ and ―unlikely‖ have be mentioned by almost the same number of respondents (around 16%). (Table 17, Appendix 3)
Influence
Figure 14: Subjective norms
One of the factors which can influence the switching process of a consumer is the others’ behaviour in this matter. However the survey conducted reveals that 47% of the respondents are uncertain while 22% partly believe that other household in their town switched and 20% partly do not think they did. (Table 18, Appendix 3)
The idea of paying 2 bills - one for the network and one for the electricity - discourages them from finding another supplier
0% 5% 10% 15% 20% 25% 30% 35% 40%
Strongly disagree Partly disagree Uncertain Partly agree Strongly agree
Evaluation P e rc e n ta g e o f re s p o n d e n ts
Figure 15: Paying 2 bills
As explained in the introduction, the consumers may have to pay for the network and for the electricity consumption; which means having 2 bills. This could lead to a discouragement of the consumers to look for another supplier. However, the result of the Figure 15 shows that the respondents do not see it as a constraint. In fact 37% of them strongly disagree with the fact
The belief that many other households in my municipality have changed electricity supplier 47% 22% 5% 6% 20% Strongly disagree Partly disagree Uncertain Partly agree Strongly agree
that it would discourage them and 15% partly disagree. A total of 32% strongly and partly agree that paying 2 bills is a motive which stops them from switching. (Table 19, Appendix 3)
The reasons they would choose a certain electricity supplier?
17% 74% 4% 5% Social responsible Low price Innovations Greenest product Figure 16: Motivation
In the Figure 16 concerning the motives in choosing a particular supplier compared to the others, 74% of the respondents declare that the low price is the main competitive advantage. Meanwhile, 17% take into consideration the social responsibility of the supplier as a decision factor to choose it and only 4% and 5% respectively look at the innovations and greenest product that the supplier offers. (Table 20, Appendix 3)
Moreover at the question « If the electricity prices of the companies are the same, what other factors influence you to switch the company? » 59% of the respondents answered. By a majority, the answers reveal that they give importance to a company which is environmental friendly, producer of green energy and offers good services.
How many times have they switched electricity suppliers in the past? 0% 10% 20% 30% 40% 50% 60% 70% 0 1 2 3 4+ Tim es of sw itching P e rc e n ta g e o f re s p o n d e n ts
Figure 17: Past behaviour
The past behaviour is important while making a survey concerning the consumers switching behaviour. Indeed, a person who have already switched in the past would be more willing to do it again as he knows the process. In the survey, 62% of the respondents never had changed suppliers which mean that 38% have already switched, at least once. (Table 21, Appendix 3) At the question "Could you specify the reasons why you switched?‖ the respondents who previously switched electricity supplier give uppermost the reason of a ―better price‖ offered by the new supplier. The second reason is that they moved from an old accommodation to a new one. The last reason mentioned for this question is the enhanced service that was a benefit compared to the old supplier
Price perception
Figure 18: Price comparison
As observed in the Figure 16, electricity consumers are appealed by low price while looking for a supplier. However 71% of them consider that most of the electricity providers offer
Compared to the competitors, they believe that their electricity supplier's prices are:
14%
71% 15%
Lower
The same / average Higher
services at similar prices. 14% of them think that their current supplier is offering lower prices than its competitors while 15% think that other suppliers may have cheaper services. (Table 22, Appendix 3)
For green electricity the prices are:
5%
39% 56%
Lower
The same / average Higher
Figure 19: Price comparison with green electricity
When it comes to green energy, the opinion concerning the suppliers’ prices changed. As said above 71% of the respondents affirmed that the prices were the same among the electricity suppliers. When the question is asked for green electricity, only 39% of them keep affirming the prices are the same while 56% perceive them as higher. (Table 23, Appendix 3)
Then another question suppose that the price of green electricity is the same among all the suppliers to know what other reason than the price could motivate them to switch, the answers the most regularly noted were: the green electricity, the environmental friendly and the good services. They are the 3 factors which would make them switch if the price was the same than their current electricity supplier
0% 10% 20% 30% 40% 50% 60% 70% Percentage of respondents 0 0<c<=50 50<c<=100 100<c<=200 200+
Extra cost (in SEK per m onth)
The extra cost they are prepared to pay per month to get 100% renewable electricity?
Figure 20: Extra cost for green energy
Because most of the respondents perceive the prices for renewable electricity as higher, it is interesting to know if they would be willing to pay an extra cost for it and how much. The Figure 20 shows that 60% of the respondents would not pay more for renewable electricity but around 26% would be willing to pay an extra cost per month which varies from SEK 1 to SEK 100 (incl.) (Table 24, Appendix 3)
The average cost is: SEK 55.18 Obstacles 0% 5% 10% 15% 20% 25% 30% 35% Percentage of answ ers
Price too high Lack of information
Takes time Satisfied w ith the actual
supplier
Other
Factors
The main reasons, for them, not to sign a contract with a supplier providing green energy?
Figure 21: Obstacles
Studied in previous thesis, the Swedish consumers have a strong desire and interest in taking part of the green energy development. However they do not switch suppliers to others
providing electricity from renewable sources. This last figure shows the main 3 reasons which can explain this fact. Indeed 34% of the answers relate it to a lack of information while 31% explain it by the price which is too high. The satisfaction with the current supplier is as well an important factor as it represents 22% of the answers given by the respondents. (Table 25, Appendix 3)
The survey results in brief
To make it clearer for the readers, the following table summarizes the various results emerging from the survey.
Topic Results
Respondents
Current supplier
Switching to another supplier
Influences
Green electricity
Obstacles for signing with a 100% renewable green electricity supplier
Number of respondents: 393 Nationality: 95% Swedish Gender: 54% Male, 46% Female
27% chose it because of its low prices 16% chose it due to good services offer Respondents consider receiving good value 59% have confidence in it (16% uncertain) 46% are committed (31% uncertain) Majority of them study carefully the bill 71% think its supplier’s price is the same as its competitors
61% do not think it is unpleasant 22% think it is not a good idea 22% think it could be a good idea
46% say it is improbable that they switch 17% say it is probable
47% are uncertain if others switched Paying 2 bills is not discouraging them Low prices motive 74% of the respondents 62% have never switched supplier in the past
56% think green suppliers’ prices are higher 39% think it is the same
60% are not willing to pay more for green electricity
34% of the answers conclude it is due to a lack of information
31% that the price is too high
22% that the respondents are satisfied with their actual supplier
5. Analysis
5.1 Determinants of the choice to switch electricity supplier:
For the question of which elements motivates consumers switching electricity supplier, first of all, we run the probit model with switched electricity supplier as dependant variable. The reason is that the switched electricity supplier value takes only 0 to 1 (also called dummy variable). For this kind of variable, the linear probability model has disadvantages such as: the fitted probabilities could be less than 0 or greater than 1 and the partial effect of any explanatory variable is constant. However, those drawbacks can be overcome by using probit model which is also called binary response model (Wooldredge, Jeffrey M., 2003, p 582).
Table 26: Variables included in the analysis: definitions and descriptive statistics
VARIABLES CODING AND DEFINTIONS MEAN
STD.
ERR MIN MAX
Dependent variable
Switched electricity supplier One fore respondents reporting that they have switched 0.4556962 0.056391 0 1 electricity supplier before, zero otherwise
Independent variables
Children in household Number of respondent’s children 0.556962 0.104658 0 5 Using Green energy One for respondents use green energy, zero other wise 0.2911392 0.051438 0 1 Give good values One for strongly disagree, five for strongly agree 3.227848 0.122122 1 5 Confidence in the present One for strongly disagree, five for strongly agree 3.126582 0.114464 1 5
electricity supplier
Study the electricity bill One for strongly disagree, five for strongly agree 2.632911 0.125048 1 5
Carefully
Good idea to switch to One for strongly disagree, five for strongly agree 2.607595 0.137698 1 5
a new one
Wise to switch to a new one One for strongly disagree, five for strongly agree 2.594937 0.140152 1 5 Unpleasant to switch to a new
one One for strongly disagree, five for strongly agree 1.620253 0.132761 1 5 Desirable to switch to a new
one One for strongly disagree, five for strongly agree 2.56962 0.147117 1 5 Others households have
changed electricity supplier One for strongly disagree, five for strongly agree 3.21519 0.150376 1 5
Probability to switch to a new
one One for unlikely, two for likely, three for certain 2.303797 0.145644 1 3 Two bills discourage me to
find a new supplier One for strongly disagree, five for strongly agree 1.772152 0.14065 1 5
Extra money to pay for green Zero for 0, 1 for under 50, 2 for 50 to 100, 3 for 100 to 1.582278 0.197031 1 4
Energy 200, 4 for more than 200
Income One for less than 10000, two for 10000 to 20000, three 4.063291 0.186655 1 7 for 20001 to 30000, four for 30001 to 40000, five for
40001 to 60000, six for 60001 to 80000, seven for more
than 80000(SEK)
Age Respondent's self -reported age (years) 45.21519 1.699102 20 82 Price for green electricity One for lower, two for the same, three for higher 2.632911 0.074667 1 3
In this section, we would like to present the results of the econometric analyses by applying binary probit model. The dependent variables are equal to one in the case for respondents reporting that they have switched electricity supplier before. The number of observations is 79 instead of 393 which is the number of questionnaires we collected since we do not use any questionnaire which have ―do not know‖ answer. The table 26 above provides some description statistics of the variables included in the econometric analysis. For instance, min and max of age is 20 and 82, respectively, mean value is 45.21519 and standard error is 1.699102. The numbers indicate that the age of respondents is between 20 and 82, the average of respondents who answered the questionnaires is around 45 and this variable has a standard error of 1.699102. It means that on average, each magnitude of age is approximately 1.699102 points away from 45.
The results of the analysis explain differences in the probability that an average individual switched supplier. When probit is significant (*,**,***: indicates statistical significance at the 10,5 and 1 percent significance levels, respectively) with a positive sign (+) implies that an increase in the corresponding independent variable would increase the probability that an average individual switched supplier, while a negative sign (-) decreases the same probability (Greene, 2000, pp. 665-670).
First of all, the result in the table 6 indicates that the element ―children in household‖ is significant at the ten percent level with positive sign. It displays that an increase of children of respondents would raise the probability that an average individual switched electricity supplier. This result confirm previous study stating that the high number of children in household increase the level of switching behaviour (Ek & Söderholm, 2008).
The positive sign for ―using green energy‖ is expected. Our result suggests that the individual who use green energy are more likely to switch to a new electricity supplier. Clearly, this result corresponds to finding part, we could see that more than a half of respondents perceive the price for green energy as higher and selecting for a lower price is the main motivation of respondents switching electricity supplier before.
It is also interesting that the respondents who believe that it is wise to switch from their current supplier to a new one seem to be more prone to switch supplier with the positive sign at ten percent level. On the other hand, the negative sign at five percent level for the factor ―desirable to switch to a new one‖ note that the person who desire to switch to new one are less likely to switch.
This result is similar with the outcome of person who is probably to switch to a new one with negative sign at ten percent level. The framework of consumer’s switching behaviour as our conceptual framework totally could clarify for the results which seem to be unreasonable.
According to this framework, mooring effects are the strongest drivers of switching behaviour. Even if the attitude of respondents is likely to switch, the other factors represented as mooring effects could act to inhibit switching (Bansal, Taylor, James, 2005, p. 108).
VARIABLES PROBIT X
Children in household 0.178* 0.639
-0.098
Using Green energy 0.357** 0.321
-0.148
Give good values -0.0736 3.245
-0.0786
Confidence in the present electricity supplier 0.0475 3.257
-0.085
Study the electricity bill carefully -0.0381 2.693
-0.0732
Good idea to switch to a new one 0.022 2.809
-0.108
Wise to switch to a new one 0.229* 2.855
-0.122
Unpleasant to switch to a new one 0.0303 1.85
-0.06
Desirable to switch to a new one -0.247** 2.73
-0.111
Others households have changed 0.036 3.791
electricity supplier -0.0565
Probability to switch to a new one -0.181*** 2.12
-0.0691
Two bills discourage me to find -0.198*** 2.494
a new supplier -0.0659
Extra money to pay for green energy -0.0139 1.254
-0.0469
Income 0.0131 3.75
-0.0422
Age -0.00476 41.98
-0.00591
Price for green electricity -0.0209 2.556
-0.126
Observations 79 79
Standard errors in parentheses: *** p<0.01, ** p<0.05, * p<0.1
Table 27: The determinants of the choice to switch electricity supplier: using probit model
Obviously, the result in the table 27 reveals the significant impact of mooring effects on intentions to switch. The variable of ―two bills discourage me to find a new supplier‖ is highly significant at 99% confident from a statistical point of view. The interpretation of this result is that the individual who believe they have difficulties to find a new supplier when they have to pay for two bills – one for the network and one for the bill have not been inclined to change electricity supplier.