Evaluation of Ecodyn 30
Validation of a mobile instrument for measuring the
retroreflection of road markings
Sven-Olaf Lundkvist
05 a, m F'I<
<-q. 4-! h C Q a W hSwedish National Road and
anspart Research Institute
VTI rapport 444A - 1999
Evaluation of Ecodyn 30
-Validation of a mobile instrument
for measuring the retroreflection of
road markings
Sven-Olaf Lundkvist
Swedish NationalRoad and
PubHsher
Swedish National Road and
' TransportResearch Institute
Pubnca on
VTI rapport 444A
Published Project code
1999 40282
Project
Mobile instruments for measuring retrore ection Author
Sven-OlofLundkvist
Sponsor
Swedish National Road Administration
e
Evaluation of Ecodyn 30 - Validation of a mobile instrument for measuring the retrore ection of road markings
Abstract (background, aims, methods, result)
This study describes an evaluation of the Ecodyn 30. The instrument has been studied with regard to validity, reliability, mctionality and cost-e ectiveness.
In the study, measuring data from the Ecodyn 30 have been compared with data from the LTL2000. Models have been found for using retrore ection values measured with the Ecodyn 30 to predict values that would be obtained with the LTL2000.
The report also contains proposals for modifying the Ecodyn 30 and some general views on the instrument.
ISSN
Foreword
This study was mded by the Swedish National Road Administration (Vdgverket, W) and the Swedish Road Marking Association (Svenska Vc igmarkeringsforeningen, SVMF). My contacts were Jan-Erik Elg (VV) and Hans Starling (SVMF). The project leader at the VTI was S-O Lundkvist.
The following persons (in alphabetical order) participated actively in the collection ofdata, simulation and analysis,
etc.:
Joakim Dahlman, VTI, data collection LTL2000 Inger Friborg, [F Konsult, data collection LTL2000
Ib Lauridsen, Frederiksborg Municipality, data collection LTL2000
S-O Lundkvist, VTI, data collection LTL2000, analysis, documentation Goran Nilsson, LG RoadTech AB, data collection Ecodyn, documentation
Jesper Nilsson, Cleanosol AB, data collection Ecodyn
Jerker Sundstrom, VTI, data collection LTL2000 Uno Ytterbom, VTI, data collection LTL2000, simulation
So Astrom, VTI, data collection LTL2000
Special thanks are also due to the two Ecodyn drivers, Goran Nilsson and Jesper Nilsson, who made themselves available whenever and wherever requested, which involved them in many long journeys in southern and central Sweden. Special thanks are also due to lb Lauridsen, who generously made available a spare instrument of type LTL2000 (in case of need) and who, with the customary Danish enthusiasm, spurred on the exhausted Swedish colleagues to great achievements.
The scienti c content of the report was examined by Mats Wiklund, VTI, to whom my thanks are due for his sound advice.
Gunilla Sjoberg undertook nal editing of this report.
Contents
Summary ... 9
1 Background ... .. ll 2 Aims and limitations ... .. 12
3 De nitions ... l3 4 Method ... .. 14
4.1 Field measurements ... .. 14
4.2 Brief description of the instruments ... .. 14
5 Measurement programme and objects ... .. 16
5.1 Performance of measurements ... .. 16
5.2 Objects ... .. 16
5.3 Measurement programme ... .. 16
6 Output data from Ecodyn 30 ... .. 18
6.1 Conditions for recording a measured value ... .. 18
6.2 Simulation of output data from Ecodyn 30 ... .. 18
7 Analyses ... 21
8 Results of initial measurements ... 22
8.1 Reporting of average values for objects in VSO ... .. 22
8.2 Analysis of operator-dependence ... 23
8.3 Analysis of speed-dependence when measuring with Ecodyn 30 ... 24
9 Results broken down by the type of road marking ... 25
9. 1 Assumptions ... .. 25
9.2 Retrore ection for intermittent edge lines (1+2) ... .. 25
9.3 Retrore ection for continuous edge lines ... .. 25
9.4 Retrore ection for centre lines (3+9) ... .. 26
9.5 Retrore ection for warning lines (9+3) ... .. 27
10 Statistical analysis ... 28
10.1 Validity variance analyses ... 28
10.2 Validity regression analyses ... 30
10.3 Reliability ... .. 34
11 Use of models ... .. 35
12 Validation ofthe model ... .. 36
13 Time consumed for functional testing ... .. 39
14 General comments on retrore ection measurements and suggestions for changes to Ecodyn 30 ... 40
15 Discussion and conclusions ... .. 41
16 References ... .. 42 Appendices 1-3
Evaluation of Ecodyn 30 - Validation of a mobile instrument for measuring the retrore ection of road markings
by Sven-Olof Lundkvist
Swedish National Road and Transport Research Institute (VTI) SE-S 81 95 Linkoping, Sweden
Summary
This study describes an evaluation of the Ecodyn 30. In the evaluation, eld measurements were made to compare the measurements from the Ecodyn 30 with those obtained with the LTL2000.
Measurements ofretrore ection have been made on a total of 49 road sections with dry, longitudinal road markings. The measurements have used two examples of the Ecodyn 30 and two instruments of the LTL2000 type. Based on the assumption that the LTL2000 mea-sures retrore ection correctly, the measuring program-me has been used to analyse validity and reliability. De-pendence on operator and measuring speed has also been studied.
The results show that the Ecodyn 30 does not give
the same measurements as the LTL2000. However,
simulation and regression analysis can be performed to nd models for predicting values that would be obtained with the LTL2000 on the basis of values measured with the Ecodyn 30. Three models have been generated: one for intermittent edge lines, another for continuous edge lines and a third for other longitudinal road markings.
As with all predictions, errors occur when applying the above models. However, they are of such an order of size thatthey are normally acceptable. The report
VTI RAPPORT 444A
offers suggestions for ways of using the models ac-cording to the type of measurement. For example, it is suggested that in a performance test with direct econo-mic consequences for a party, a dilemma zone should be introduced within which no decision is made on acceptance or rejection. If a value is predicted to be
within this zone, measurement must be made with the
LTL2000.
In regard to time consumption, measurements on a
road section usually occupy less time with the Ecodyn 30 than those with the LTL2000 if the latter are performed in accordance with Method 599 of the National Road Administration. However, large random errors may occur with the LTL2000 if the number of measuring sites is limited.
In addition, the report contains proposals for mo-di cations to the Ecodyn 30. The two most important relate to calibration routine and measuring range.
Finally, it is emphasised that the LTL2000 and Ecodyn 30 must not be regarded as competing instruments. On the contrary, they complement each other well. The Ecodyn is suitable for status descriptions of a number of relatively long road sections, while the LTL2000 is more suitable for precise measurements.
1 Background
Various types ofportable instrument have been used until now for the functional testing of the retrore ection of road markings in Sweden. A feature common to these tests has been the simulation of the test situation under vehicle lighting; i.e. the light strikes the road marking at a small angle and is re ected back to the driver at a rather larger angle. An instrument of type LTLZOOO has been used exclusively in recent years; this simulates a lighting and observation distance of 30 metres and in other res-pects meets all the requirements of EN-l436.
A mobile re ectometer, known as Ecodyn, was
de-veloped in France at the start ofthe 90s. This is mounted on a vehicle, and measurements are taken while driving. The rst version of this instrument simulated a distance of about 15 metres on the road and as such did not meet the requirements ofEM-l 436. The instrument was mo-di ed a couple of years ago, however, so that it now
VTI RAPPORT 444A
measures with the correct geometry and is known as the Ecodyn 30.
Ecodyn 30 instruments have been purchased to date by two companies in Sweden, Cleanosol AB in
Kristianstad, and LG RoadTech AB with of ces in
Vanersborg and Kahnar. Since mobile measurement in-volves measuring a large number of large sections of road in a comparatively short time, there is a wish to use these measurements as soon as possible for func-tional testing. The instrument is still relatively unproven in service, however, and it requires to be tested and validated before being used for measurements ofa kind which may involve guarantee claims, for example. It is logical to test the instrument against the LTL2000, with which we have considerable experience in Sweden and the Nordic region as a whole.
2 Aims and limitations
The primary aim of this study is to validate the Ecodyn 30 against LTLZOOO. In other words: Does the Ecodyn 30 give the same measurements as the LTLZOOO? Other parameters of interest are repeatability and operator-dependence, if any, (for both instruments) and, as far as the Ecodyn 30 is concerned, to investigate whether there is any connection between the measurement speed and the measurement result.12
It is also wished to form a view of the calibration pro-cedures and their operation in general terms. Is it possible to measure all types of road markings with the two instruments? Finally, it is wished to compare the time taken by measurement with the two instruments.
The study was limited to dry, longitudinal road markings.
3 Definitions
This report uses the following expressions and desig-nations, which require clari cation as follows:
Swedish National Road Administration Regions
VSO
VMN VM
WA
South Eastern Region Malardalen Region Central Region Western Region
Types of longitudinal road markings
K(1+2) Kh M(3+9) V(9+3)
intermittent edge line (1 m line, 2 m gap) continuous edge line
centre line (3 In line, 9 m gap) warning line (9 m line, 3 m gap) Classi cation of road marking objects for testing
Object Road markings on part ofa section of road
selected for functional testing. Only a single type of road marking may occur in the object: an intermittent edge line or a continuous edge line or a warning line. Each object has a length of 165 metres in VSO and 180 metres in VMN, VM and WA.
VTI RAPPORT 444A
Measure- The object is divided into 5 measurement
ment site sites of 33 metres in VSO and 36 metres
in VMN, VM and VVA.
Measure- The physical location at which a reading
ment point is taken from the instrument (LTL2000), or a measured value is sampled (Ecodyn 30).
Instrument
LTLl A brand new instrument of type LTL2000
belonging to the VTI.
LTL2 A (recently checked) instrument of type
LTL2000 approximately 5 years old belonging to the VTI.
ECOl A brand new instrument of type Ecodyn
30. Belongs to Cleanosol AB.
EC02 A brand new instrument of type Ecodyn
30. Belongs to LG RoadTech AB.
4 Method
4.1 Field measurements
The evaluation of the Ecodyn essentially took the form of eld measurements. This involved making repeated measurements of a large number of road markings of different kinds with two instruments of each type. The measurement programme permitted the validity, relia-bility, operator-dependence and speed-dependence to be studied.
In the course ofthe main experiment, an attempt was made to measure entire objects as far as possible, but without making a random choice of measurement sites with the LTL2000. The aim was to try to measure pre-cisely the same road markings with all the instruments. All the measurements were performed on dry road markings and in daylight. Any loose gravel or dirt present on the marking was brushed away beforehand, however.
4.2 Brief description of the instruments
4.2.1 LTL2000
The LTL2000 is a portable (hand-held) retrore ection meter which simulates a 30-metre lighting and obser-vation distance for a passenger car. This means that the
illumination angle and the observation angle (a and or) are 124° and 2.290 respectively. The light source is a halogen lamp and meets the requirements for light sour-ce A in accordansour-ce with the CIE. The measurement range is 200 o 45 mm2 (length x width), i.e. the measure-ment area is ca. 9000 m2.
Calibration takes place at two levels, namely 0 and approximately 150 mcd/mz/lux. The former level is achi-eved by placing the instrument in a so-called light trap, and the latter level is achieved by performing measure-ment on a calibrating standard prepared in the laboratory. The instrument compensates automatically for scat-tered light up to a certain level. A warning is given ifthe scattered light exceeds this level.
The LTL2000 is powered by an internal battery, and there is accordingly no need for any connecting cables. It weighs about 11 kg. The instrument meets all require-ments in accordance with EN-l436. Figure 1 illustrates the appearance of the LTL2000.
The LTL2000 is a development of the LTL800, which is already well documented, including by the VTI (Ref. 2).
Figure 1 LTL2000
DELTALyjs& Optik *
Hjortekarvej 99 f. DK-ZSQOLYNGBY
Denmark 0 V'iFtrrther information about the LTL2000 is available from:
4.2.2 Ecodyn 30
The Ecodyn 30 is identical with the LTL2000 as far as its measurement geometry and light source are con-cerned. The measured value is obtained from whichever of the 14 photocells produces the highest measurement signal. Each photocell measures an elliptical area with
axes of 35 and 1000 mm, i.e. the measured value is
integrated over an area of about 27 000 m2. The Clea-nosol instrument samples at an interval of 0.397 metre, whereas the sampling range for the LG RoadTech in-strument is 0.525 metre.
The effect of the road surface is eliminated by setting a threshold value, which must be higher than the retro-re ection of the road surface. Any measuretro-red values below this threshold value are ignored. The threshold value in this case was set at 60 mcd/mZ/lux. A measured value is also excluded ifit deviates by more than 10 mcd/ mz/lux from the preceding and the following value.
Calibration takes place with a road marking laid out on a sheet. Calibration takes place at a single level of about 300 mcd/mz/lux.
The Ecodyn 30 compensates automatically for
scat-m"...
.--.. Air
-'J
.
z:-tered light and is powered by the electrical system of the vehicle. The instrument is operated by a single ope-rator, from the driver s position of the vehicle.
As already mentioned, the two Ecodyn instruments are unfortunately not identical. The known differences are:
0 the sampling intervals referred to above
0 Cleanosol s Ecodyn 30 is installed in a Renault,
whereas LG RoadTech s instrument is in a Chevrolet
with a shock absorber which automatically aligns the vehicle horizontally
o Cleanosol s instrument is installed behind the rear wheel, whereas LG RoadTech s instrument is
in-stalled ahead of the rear wheel.
In other respects they are identical, i.e. the electronics and the optics are the same and, most importantly, they measure with the same geometry and with the same aperture angles.
Figure 2 shows the Ecodyn 30 installed in a Chevrolet.
L
I
WW
@1775 EM
. M17/81, bld de la République BP 101 France
Further information about the LTL2000 is available from:
PROSIGN Siege social Le Debussy
FR-92252 LA GARENNE COLONIBES CEDEX
5 Measurement programme and objects
5.1 Performance of measurements
All the measurements were performed during the period from 09.08-24.09.l999. The measurements were al-ways made on dry road markings. The two LTL2000 instruments were operated by staff from the VTI, the Frederiksborg municipality and Inger Friborg Konsult. Each instrument was always operated by two persons
at the same time, at least one ofwhom had considerable
experience ofprevious measurements. The two Ecodyn instruments were operated by Jesper Nilsson of Cleano-sol and by Goran Nilsson of LG RoadTech. Both had considerable experience ofprevious measurements with this type of instrument.
Before taking the measurements, the instruments were calibrated in accordance with the manufacturer s instructions. The same calibrating standard was used for each type of instrument.
5.2 Objects
Measurements were made in four ofthe Swedish Natio-nal Road Administration s Regions. The choice of object in each region may be described brie y as follows:
VSC)
Sevenobjectswith an intermittentedge line
and one objectwith a continuous edge line. The objects were mainlysituated on smooth asphalt road surfaces which would not cause any problems during measurement. The road markings werethe thermoplastics or spray plastics that are commonly encountered in Sweden.
Eight objects with an intermittent edge line, two objects with a continuous edge line, eight objects with a centre line and ve objects with a warning line. There was considerable va-riation in the quality of both the road markings and the road surfaces. The road markings were the thermoplastics or spray plastics that are commonly encountered in Sweden.
VM Ten objects with a continuous edge line, all
of which are included in a trial into road mar-kings that are visible in the wet. The road surface is a one-year-old surface treatment with a coarse texture. Some of the objects were of a kind that are expected to be en-countered on Swedish roads in the future.
16
WA Eight objects with a continuous edge line, all
of which are included in a trial into road mar-kings that are visible inthe wet. The road sur-face is a one-year-old smooth asphalt sursur-face. Some of the objects were of a kind that are expected to be encountered on Swedish roads in the future.
Measurements were thus performed in 49 objects in total. All the objects are described in more detail inAp-pendix 1. Measurements were taken with all four
instru-ments, LTLl, LTL2, ECOl and EC02, in every case.
As can be appreciated from the above, the road mar-kings can be classi ed into four types:
0 Intermittent edge lines. This is a type of edge line encountered on ordinary Swedish two-lane roads. The length of the lines is 1 metre, and the distance between the lines is 2 metres. The line width is 0.10 metre, with one exception.
0 Continuous edge lines. These edge lines are nor-mally used in Sweden only on motorways and roads
with wide traf c lanes, and in this case are 0.30 in
width. The objects in VM and VVA are trial road
markings, however, and have a width of 0.20 metre,
as has one of the objects in VMN.
0 Centre lines. These lines are 3 metres long with a gap of 9 metres. They were 0.10 or 0.15 metre wide. 0 Warning lines. These lines are 9 metres long, and
the distance between them is 3 metres. Their width
was 0.10 or 0.15 metre.
5.3 Measurement programme
The following measurement programme was performed (in chronological sequence) in each ofthe four regions: VSO
At each ofthe objects, measurements were taken on ve
runs with each of the instruments, as follows:
Run 1 LTL2000 operator 1 measured with LTLl
LTL2000 operator 2 measured with LTL2 Ecodyn operator 1 measured with ECOl Ecodyn operator 2 measured with EC02 Measurements with the Ecodyn were per-formed at 40 km/h.
Run 2 As for Run 1
Run 3 LTL2000 operator 1 measured with LTL2
LTL2000 operator 2 measured with LTLl Ecodyn operator 1 measured with ECO2 Ecodyn operator 2 measured with ECOl Measurements with the Eeodyn were per-formed at 40 km/h.
Run 4 Eeodyn measurements only. Ecodyn operator 1 measured with ECOl, and Ecodyn operator 2 measured with ECO2, this time at 20 km/h.
Run 5 Ecodyn measurements only. Ecodyn operator
1 measured with ECOl, and Ecodyn operator 2 measured with ECO2, this time at 60 km/h.
The eight objects in VSO contained a total of 40
mea-surement sites of 33 metres. On each test site were 22
single measurements carried out in each measuring round, i.e. in case of broken edge line, two measurement
values were read on each road line with LTL2000. The measurements outlined above permit the evalua tion of the validity, reliability, operator-dependence and speed dependence.
An analysis directly after the measurements in VSO was unable to demonstrate any operator dependence or, as far as the Ecodyn 30 was concerned, any speed dependence. Different, operators were used subsequ ently, although they had to be experienced, and the
mea-surements with the Ecodyn 30 were always performed
at a speed of 40 km/h.
VMN
Run 1 Measurement with LTL1, LTL2, ECOl and
ECO2 with experienced operators.
Run 2 As for Run 1.
VTI RAPPORT 444A
The 23 objects in VMN contained a total of 115 mea-surement sites of 36 metres. On each test site were 12 measurements carried out in each measuring round, i.e.
in case of broken edge line, one measurement value was read on each road line with LTL2000.
VM
Run 1 Measurement with LTL1, LTL2, ECOl and
ECO2 with experienced operators.
The 10 objects in VM contained a total of 50 measure ment sites of 36 metres. At each measurement site, 12 measurements were made with the LTL2000, which involved a total of 600 measurements with each of the
two instruments of type LTL2000. va
Run 1 Measurement with LTL1, LTL2, ECOl and ECO2 with experienced operators.
The eight objects in VVA contained a total of 40 mea-surement sites of 36 metres. At each meamea-surement site, 12 measurements were made, which involved a total of 480 measurements with each of the two instruments of
type LTL2000.
Measurement values with LTL2000 were always read
in the centre of the 0.1 0.3 wide road line.
6 Output data from Ecodyn 30
6.1 Conditions for recording a measured value
The Ecodyn 30 displays average values from each
mea-surement site during the meamea-surement process. The length of the measurement site can be selected, and in this case 33 metres was selected at VSO and 36 metres
at VMN, VM and va.
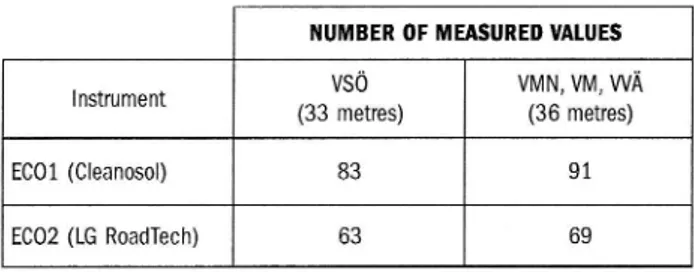
The instrument takes readings at a pre-set interval. A measured value reading is produced every 0397 metre by ECOl, and every 0.525 metre by ECOZ. This means that the number of measured values per measurement site will be as stated in Table 1. Not all of these measured
values will be recorded on every run, however.
Table 1 Number ofmeasured values per measurement site for the two instruments of type Ecodyn 30. At one object the number of measured values is 5 times that indicated in the table.
NUMBER OF MEASURED VALUES
Instr m m vso VMN,VM,WI\
e (33 metres) (36 metres)
ECOl «Heanoson 83 91
am (LG RoadTech) 63 69
The values in Table 1 thus indicate the number of
sured values that the instrument tries to record at a mea-surement site. The average value, i.e. the value displayed by the instrument to the user, is based on these individual measured values, although not all of them are always
included. Certain conditions must be met in order for a
measured value to be included in the average value
cal-culation:
Assume that we have the following measured values from a measurement site ..., R_2, R_1, R0, R1, R2,
R0 will only be included in the average value calculation if:
0 R0 = 60 mcd/mZ/lux and
-
IRO R_1l = 10 U IRO Rll = 10 mcd/mz/lux
18
In other words: the conditions for a measured value to be recorded are that it is greater than or equal to the
threshold value, 60 mod/mZ/lux. Furthermore, the dif ference from the preceding or the following measured value must be smaller than or equal to 10 mcd/mZ/lux.
Example: Assume that you have a sequence ofmea-sured values:
50 excluded because it is less than 60
78 accepted (difference from following value = 10)
88 accepted (difference from preceding value = 10)
60 excluded because the difference from the
preceding and the following value is more than 10
87 excluded because the difference from the pre
ceding and the following value is more than 10
62 accepted (difference from following value =
59 excluded because it is less than 60
Only three ofthe above seven measured values will thus
be recorded. The average value of these three measured values is thus (78+88+62)/3 = 76, which will be in-dicated as the retroreflection of the measurement site.
6.2 Simulation of output data from Ecodyn 30
Under the conditions applicable to the exclusion of
mea-sured values in accordance with 6.1, only a certain pro-portion of all the values will be included in arriving at the average value. The size of this proportion will depend
on the intermittence of the road marking, the sampling
interval of the instrument and the retrore ection of the
road marking and the carriageway.
By simulating a run with a large number of
mea-surements and retroreflection values of 100 and 300
mcd/mZ/lux on the road marking and 10 or 20 mcd/mZ/ lux on the carriageway, the number of recorded mea-sured values obtained from Ecodyn 30 will be in
ac-cordance with Table 2. The simulated values for the intermittent edge line are lower than the retrore ection
of the line because, with a length of 1 metre for the
mea-surement range, meamea-surement is almost always per-formed on a part of the line and a part ofthe carriageway. The simulated value is then a weighted value for these
two surfaces.
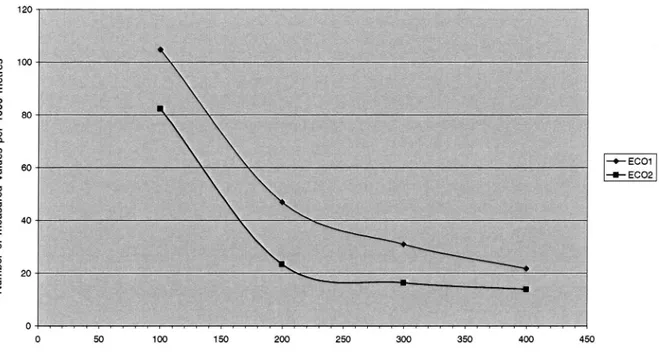
The number of measurement values recorded over a distance of 1000 metres with a road surface
retro-re ection of 20 mod/mZ/lux (medium-light road surface)
is shown in Figure 3.
Table 2 Simulation of the number of measured values (12, and n2) recorded by the Ecodyn 30 at a sampling interval of0. 397 metrefor ECO] and 0.525 metre for EC02. Rm and Rb relate to the true retrore ection ofthe road marking 2 relate to the average value that ECO] and EC02 will indicate and the road surface respectively, while RE
in theory. This will be calculated in relation to n, and n2 measured values respectively ifthe distance is 1000 metres.C01
and RECO
Rm Rb line type R5001 n1 RECOz n2
K(1+2) 82 94 76 77 100 10 Kb 100 2518 100 1905 M(3+9) 100 385 100 270 V(9+3) 100 1644 100 1222 K(1+2) 84 105 79 83 100 20 Kh 100 2518 100 1905 M(3+9) 100 391 100 276 V(9+3) 100 1646 100 1227 K(1+2) 242 29 222 17 300 10 Kb 300 2518 300 1905 M(3+9) 300 353 300 246 V(9+3) 300 1610 300 1198 K(1+2) 245 31 225 17 300 20 Kb 300 2518 300 1905 M(3+9) 300 354 300 247 V(9+3) 300 1611 300 1198
Number of measured values asa function of the retrore ection of the road marking
120 100 80 60 4O 20 Num be r of me as ur ed va lue s pe r 10 00 me tr es
Retroreflection of the road marking
+ ECO1 + ECO2
Figure 3 Number of measured values from which the Ecodyn 30 calculates the average value, assuming that the mea-sured distance is 1000 metres, the road marking is an intermittent edge line, and the retrore ection of the road surface
is 20 mcd/mZ/lux.
It can be appreciated from Table 2 that there are good
reasons to introduce a correction factor, k, when
mea-suring intermittent edge lines with the Ecodyn 30. This correction factor may vary slightly depending on the retrore ection of the road marking and the carri-ageway, although a good average value is:
kECOI = 1.20, for a sampling interval of 0.397 m
kEC02 = 1.28, for a sampling interval of 0.525 111
When measuring other longitudinal road markings,
kKDIZk vzzllm
The measured values obtained at a measurement site with intermittent edge lines thus require to be
multiplied by 1.20 for Cleanosol s Ecodyn 30 and by 1.28 for LG RoadTech s Ecodyn 30.
The fact that the two Ecodyn instruments do not have the same correction factor is attributable exclusively to their different sampling intervals.
20
It can also be appreciated from Figure 3 that, when taking measurements on short measurement sites, there is a risk of the number of measured values from which the average value is calculated being small. Figure 3 is based on a distance of 1000 metres, although the objects included in this study had lengths of 165 (VSO) or 180 metres. If the road marking has a very high retroref lection, there is a particular risk of large random errors, since the average value over the object may be based on only 2-4 measured values.
It is assumed in every case in this report that the Ecodyn s threshold value was set to 60 med/m2/
lux, even though this was not the case for some of
the initial measurements. Values below 60 med/m2/
lux were thus excluded from the analysis.
It was also assumed that it was possible to state that it was intended to measure on the intermittent
edge line, before performing the measurement, and
that the instrument accordingly corrected the out-put data as described above.
7 Analyses
When validating an instrument, there is a wish to do this against a true value. The truth is not known in the case of the retrore ection of road markings. However, the LTL2000 is a recognized and familiar instrument with
traceable calibration, and its measured values are
re-garded as true for this reason.
This report accordingly takes the value measured with the LTL2000 as the true value, which is always the measured value from the new example of the
in-strument, i.e. LTL2.
The second of the two measurement runs was used in all the regression analyses, as appropriate.
Thus, for the purpose ofvalidation, the second mea-surement run with LTL2 is compared, as appropriate, with the second measurement run with ECOl and ECOZ.
The Figures always relate to measurement run 2 in VSO and VMN, and to measurement run 1 (the sole run) in VM and VVA.
The following analyses are reported: Average values for each object Analysis of operator-dependence
Analysis of speed-dependence for Ecodyn 30 Analysis of the effect of the type of road marking Validation
Calculation ofprediction model
VTI RAPPORT 444A
0 Analysis of reliability
0 Analysis of the number of incorrect decisions when using the prediction model
0 Cost of measurement
0 Validation ofprediction models
It must be pointed out that it is almost always possible to demonstrate a signi cant effect simply by measuring a suf ciently large random sample. A signi cant effect may be unimportant, just as an insigni cant effect may be important; it may not have been possible to demon-strate the signi cance because the random sample was not suf ciently large. One should thus not be interested in the rst instance in a possible demonstrated signi-cance, and one should instead study the estimated strength of the effect. The variance analyses below use nzto quantify the estimated strength of the effects.
712 can be compared with R2 in an ordinary regression analysis; i.e. if n2 = 0.50, this may be interpreted as indicating that half of the variance in the measurements can be attributed to the actual effect. Such an effect may be said to be important. If n2 is less than 0.05, only a small part of the variance is explained by the actual
effect, and this effect is therefore often without im-portance.
All signi cance tests are carried out at the 5% level.
8 Results of initial measurements
8.1 Reporting of average values for objects In
vso
The retrore ection values presented below have
been corrected in accordance with the comments
made in section 6.2. It has been assumed that the instrument was modi ed to provide an opportunity be-fore measurement to indicate whether measurement was to be performed on an intermittent edge line.
Numerical values for each run and instrument at each
object are contained in Appendix 2.
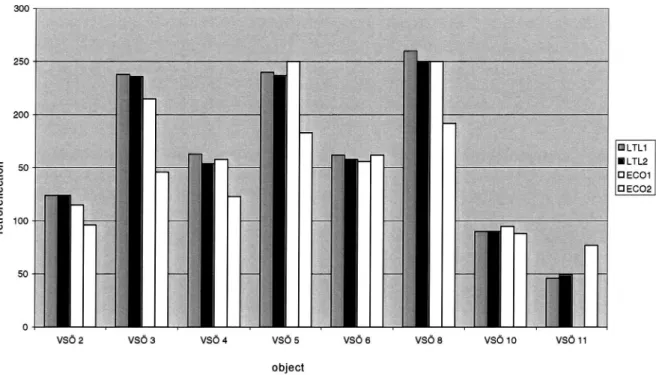
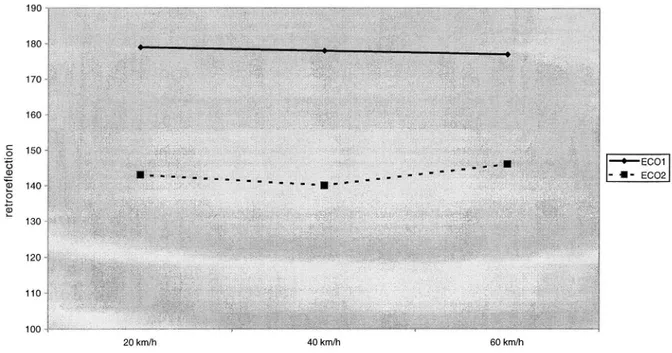
Figure 4 makes a comparison of the results from the four instruments used on the objects in VSO, and Figure 5 shows the measured retrore ection as a function of the measurement speed with the Ecodyn 30.
It can be appreciated that the values measured by the Ecodyn 30 are very often rather lower than those mea-sured by the LTL2000, and that the EC02 meamea-sured a lower value than the EC01 for 6 of the 8 objects. The two hand-held instruments produced quite similar mea-surements on these edge lines.
lux (med/mZ/lux).
The visibility of a road marking in darkness and in vehicle lighting is quanti ed in terms ofits retrore ection expressed in milli candela per square metre per The Swedish National RoadAdministration stipulates that a dry road marking
must have a retrore ection of at least 100 mcd/mz/lux.
Retroreflection on objects in V86 300 250 200 -50- I _ 100 - q. _ re tr or ef le ct io n so -LTL1 I LTL2 El ECO1 El ECO2 r" vsc") 2 vsc") 3 v36 4 v36 5 object vso 6 vso a vsc") 10
Figure 4 Retrore ection in VSO, measured with two LTL2000 and two Ecodyn 30 instruments. Note that no measurement site with a value higher than 60 mod/mz/lux was measured on V80 object 11 with ECO]. V50 6 is a continuous edge line, and the others are intermittent edge lines.
Retroreflection as a function of measurement speed for Ecodyn 30 190 180-170~ 160 150' 140-re tr or ef le ct io n 120 '-110v 1 J _..,..._.,.t...t....w,w..,w..,.,.t. 20 km/ h
. . Il. .w,u. . NA. .
40 km/h ° ECO1 - I- ECO2 60 km/h measurement speed
Figure 5 Retroreflection measured at three speeds. Note that the y scale starts at 100 mcd/mZ/lux. The graph relates
to the average valuefor the 8 objects in V50.
It can be appreciated from Figure 5 that there does not appear to be any speed dependence. Although a little variation occurs with the speed of measurement, this is
insignificant.
8.2 Analysis of operator-dependence
Measurement runs two and three on the objects in VSO
were always identical, except when the operator was changed. The LTLl s operator measured with LTL2 on run three and vice versa, while the ECOl s operator measured with EC02 and vice versa.
If any operator-dependence is present, this will mani-fest itself in an interaction effect between the instrument
and the operator (in this case: measurement run). In other
words: if the ECOl s operator generally measures higher values with the EC02 than the ECOZ S regular operator, this will manifest itself as an interaction in a two-way
variance analysis.
Tables 5 and 6 present a two-way variance analysis with the dependent variable R and the two independent
variables instrument, I (two levels: LTLl, LTL2 in Table 5 and ECOl , EC02 in Table 6), and operator, 0P (two levels: regular operator, alternative operator).
VTI RAPPORT 444A
Table 5 Variance analysis in respect of operator-depen-dence when measuring with LTLZOOO. The dependent variable is the retrore ection R, and the two independent
variables are the instrument, I, and the operator, 0P.
Effect F-quotlent Slgn. (p<) 2
instrument (I) 0.01 - 0.00
operator (OP) 0.02 - 0.00
| x 0P 0.00 - 0.00
Table 6 Variance analysis in respect of operator-depen-dence when measuring with Ecodyn 30. The dependent variable is the retrore ection R, and the two independent variables are the instrument, I, and the operator; 0P.
Effect F-quotlent Slgn. (p<) 11 2
instrument (I) 25.33 p<.001 0.15
operator (0P) 0.15 - 0.00
I x 0P 2.40 - 0.02
It can be appreciated from Tables 5 and 6 that no opera-tor dependence could be demonstrated. The interaction effect between the operator and the instrument is not significant, and the strength of the effect is estimated as small in both cases.
It can be seen, however, that a not entirely insigni-ficant difference exists between the results from the two Ecodyn instruments; the principal effect of the instru-ment is significant in Table 6.
8.3 Analysis of speed-dependence when
measuring with Ecodyn 30
Any speed-dependence associated with Ecodyn
mea-surement would be apparent as an effect in a one-way variance analysis with the retroreflection, R, as the
dependent variable and with the speed, H, as the in-dependent variable (three levels: 20, 40 and 60 km/h). This variance analysis is presented in Table 7.
24
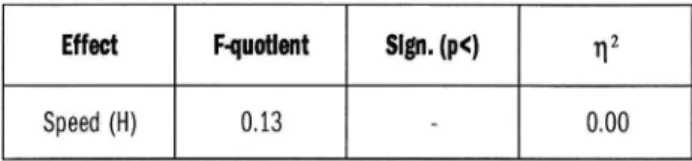
Table 7 One-way variance analysis in respect of the speed-dependence 0f the Ecodyn 30. The dependent va riable is the retrore ection R,and the independent va riable is the speed, H.
Effect F-quotlent Slgn. (p<) n2 Speed (H) 0.13 - 0.00
No speed dependence could be demonstrated in con-junction with measurements with the Ecodyn.
The conclusion to be drawn from 8.2 and 8.3 is
that it is unimportant who performs measurements with the LTL2000 or the Ecodyn 30, provided that the person concerned is an experienced operator.
Also, measurement with the Ecodyn 30 can be
per-formed at any speed within the range from 20 to 60
km/h.
9 Results broken down by the type of road marking
9.1 Assumptions
After the initial measurements (including one continuous edge line) and simulation of the function of the Ecodyn 30, it is clearly advisable to report the results of the different types of road markings separately. Even with compensation in accordance with section 6.2, it is pos-sible to suspect differences between the results for different types of line, depending on the instrument. For example, the simulation indicates that the risk of large random errors could be high when measuring with the Ecodyn 30 on intermittent edge lines with high retro-re ection.
The average values are accordingly reported below in a form subdivided by type of line. The validity (10.1) and the possibility of identifying a prediction model which is applicable to different types of road markings (10.2) and the reliability (10.3) are then investigated.
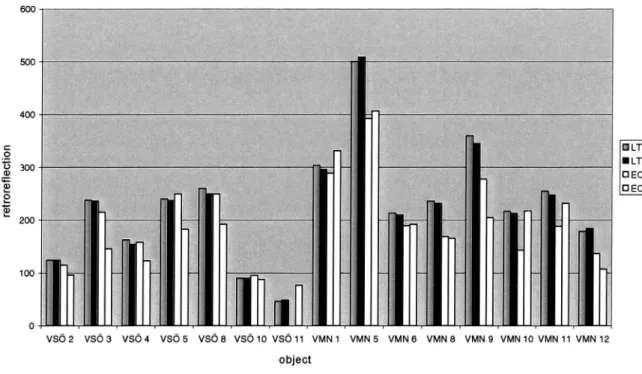
9.2 Retroreflection for Intermittent edge llnes
(1+2)
Measurements were carried out on a total of 15 objects with intermittent edge lines in VSO and VMN. The
rele-vant data are reported in detail in Appendix 2, Table 3.
The measured results from the second measurement run
are presented in Figure 6.
Figure 6indicates that, in most cases, the two
Eco-dyn instruments showed lower retrore ection than the LTL2000. It must be remembered that this continues to apply in spite ofthe fact that the values are corrected in accordance with 6.2.
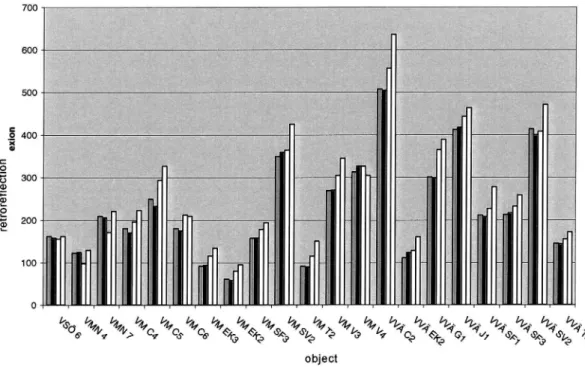
9.3 Retroreflection for continuous edge lines
Figure 7 shows the retrore ection for continuous edge lines. It should be noted that these lines differ from the intermittent lines in the sense that almost all ofthem have a width of 0.20 metre, compared with the 0.10 metre of the intermittent lines (with one exception). The relevant data are also reported in detail in Appendix 2, Table 4.
Measurements with an Ecodyn with a 15-metre geometry were also carried out on the objects in VM and VVA. Details of these measurements can be found inAppendix 3.
Retrore ection for intermittent edge lines 600 500 400 300 re tr oref le ct io n 200 1oo- '1
r .: 1 El LTL1 F_ 1 I LTL2 ' . D ECO1 L I: E] ECO2 i t 'H t F F
. f
object
I -
y
4'?
vséz vsda vsc">4 vsc">5 vsds vsc">1o vsc'j11 VMN1 VMN5 VMN6 VMN8 VMNQ VMN iO VMN11 VMN 12
Figure 6 Retrore ection (mcd/mZ/lwc) for 15 objects with intermittent edge lines (1+2).
Retroreflection for continuous edge lines 700 600 500 E LTL1 II LTL2 El ECO1 El ECO2 400 EX IOI' I 300 re tr or ef le ct io n 200 -100-1;
Figure 7 Retrore ection (mcd/mz/lux) for 21 objects with continuous edge lines. (1 +2).
Retroreflection for centre lines 400 350 300 J 250 J IE LTL1 II LTL2 El ECO1 D ECO2 200 -re tr oref le ct io n 150100 -50
VMN 7m VMN 11m VMN 19 VMN 20 VMN 23 VMN 24 VMN 25 VMN 26 object
Figure 8 Retrore ection (mcd/mz/lwc) for eight objects with centre lines. (3+9).
A clear difference from Figure 6 can be seen in Figure 9.4 Retroreflection for centre lines (3+9)
73 in the case Of 0014111110115 edge lines: the ECOdyn 30 Figure 8 presents the retrore ection for 8 objects with
has more Often than mt indicated a higher retrore ection centre lines. These had a Width of 0.10 or 0.15 metre. value than the LTL2000. Furthermore, the EC02 has The data for both measurement runs are reported nume-very often produced a higher value than the ECOl. rieally in Appendix 2, Table 5.
It can be seen from Figure 8 that the Ecodyn 30 indicated a lower retrore ection than the LTL2000 without ex-ception.
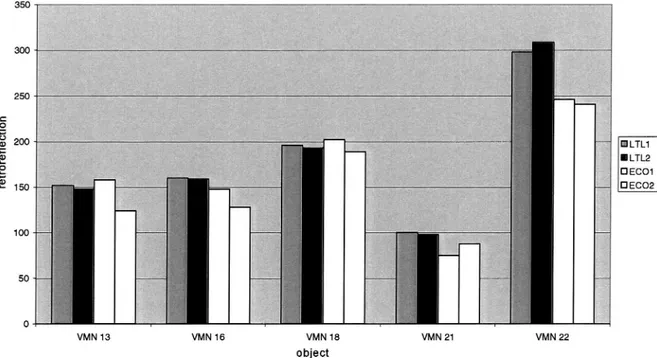
9.5 Retroreflection for warning lines (9+3)
rically in Appendix 2, Table 6.
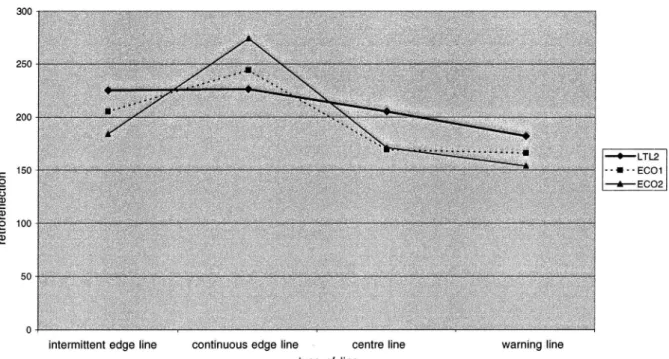
The data for both measurement runs are reported nume-Figure 9 suggests that the Ecodyn 30 gives similar or slightly lower values than the LTL2000 on warning lines.
Figure 9 presents the retrore ection for 5 objects with warning lines. These always had a width of 0.10 metre.
Retroreflection for warning lines 350 300 250 m LTL1 200 re tr or ef le ct io n 150100 - 50-' LTL2 D ECO1 El ECO2
VMN 16 VMN18 VMN 21 owed
Figure 9 Retrore ection (mcd/mZ/lwc) for five objects with warning lines. (9+3).