This is the published version of a paper published in Open heart.
Citation for the original published paper (version of record):
Winkel, P., Jakobsen, J C., Hilden, J., Jensen, G., Kjøller, E. et al. (2018)
Prognostic value of routinely available data in patients with stable coronary heart disease. A 10-year follow-up of patients sampled at random times during their disease course
Open heart, 5(2): 000808
https://doi.org/10.1136/openhrt-2018-000808
Access to the published version may require subscription. N.B. When citing this work, cite the original published paper.
Permanent link to this version:
Open access
To cite: Winkel P, Jakobsen JC,
Hilden J, et al. Prognostic value of routinely available data in patients with stable coronary heart disease. A 10-year follow-up of patients sampled at random times during their disease course. Open Heart 2018;5:e000808. doi:10.1136/
openhrt-2018-000808 Received 20 February 2018 Revised 11 July 2018 Accepted 24 July 2018
For numbered affiliations see end of article.
Correspondence to Dr Per Winkel; pwinkel@ ctu. dk
Prognostic value of routinely available
data in patients with stable coronary
heart disease. A 10-year follow-up of
patients sampled at random times
during their disease course
Per Winkel,1 Janus Christian Jakobsen,1,2 Jørgen Hilden,3 Gorm Jensen,4
Erik Kjøller,5 Ahmad Sajadieh,6 Jens Kastrup,7 Hans Jørn Kolmos,8
Anders Larsson,9 Johan Ärnlöv,10,11 Christian Gluud1
Coronary artery disease
© Author(s) (or their employer(s)) 2018. Re-use permitted under CC BY-NC. No commercial re-use. See rights and permissions. Published by BMJ.
AbstrAct
Objective To characterise the long-term prognosis of
patients with stable coronary artery heart disease by means of ‘standard predictors’ defined as demographic, clinical and biochemical quantities routinely available in general practices and ascertained at an interview not prompted by renewed cardiac complaints.
Methods This is an observational study based on data from
2199 Copenhagen placebo patients from the ‘clarithromycin for patients with stable coronary heart disease’ trial of patients with stable coronary heart disease. In the trial, we compared the effects of 14 days of clarithromycin treatment versus placebo. The predictors were based on the interview forms and blood samples collected at entry, along with demographic information from hospital files.
We studied ‘standard predictors’ of a composite outcome (myocardial infarction, unstable angina, cerebrovascular disease or all-cause death) and of all-cause death. Using Cox regression, we compared predictions of status at 3, 6 and 9 years without and with the use of ‘standard predictors’ and used receiver operating characteristic statistic.
Results Few ‘standard predictors’ were associated
(p<0.01) with the composite outcome or with all-cause death. When no ‘standard predictors’ were included, 63.2% of the model-based predictions of the composite outcome and 79.9% of death predictions were correct. Including all ‘standard predictors’ in the model increased the figures to 68.4% and 83.4%, respectively. C indices were low, except when all-cause death was assessed as a single outcome where C was 0.79.
Conclusion ‘Standard predictors’ routinely available
in general practices contribute only modestly to risk assessment in consecutively sampled patients with stable coronary heart disease as ascertained at a contact not prompted by renewed cardiac complaints. Novel biomarkers may improve the assessment.
Trial registration number NCT00121550.
InTROduCTIOn
It would be of great practical value if the long-term prognosis of patients with stable
coronary heart disease could be assessed by the general practitioner at a random time during the patient’s disease course, that is, when the visit at the general practitioner is not prompted by acute symptoms or made during recovery from a major cardiovascular event. To be practically useful, the assessment should be based on information routinely available to the general practitioner. The term ‘stable coronary heart disease’ calls for a defi-nition that is readily applied in general prac-tice. In the ‘clarithromycin for patients with stable coronary heart disease’ (CLARICOR)
Key questions
What is already known about this subject? ► Patients with stable coronary artery disease are at
an increased risk of death or non-fatal cardiovas-cular incidents.
What does this study add?
► New knowledge regarding the long-term impact of routinely measured, demographic, clinical and biochemical factors for the prediction of non-fatal cardiovascular incidents and all-cause death in patients with stable coronary heart disease ascer-tained at baseline review not prompted by renewed cardiac complaints.
► Routinely measured, demographic, clinical and bio-chemical factors do show an expected association with long-term course, but the prognostic impact is weak. For useable prognostic differentiation, stron-ger clinical markers are needed.
How might this impact on clinical practice? ► High-risk patients with stable coronary heart
dis-ease presenting in a general practice with non-car-diac complaints may be identified using ‘standard predictors’ and advanced biomarkers and referred to further examinations by specialist cardiologists.
on 23 September 2018 by guest. Protected by copyright.
http://openheart.bmj.com/
trial,1 2 we have developed the operational definition described below, covering a common and important class of patients.
Our present objective, therefore, is to use the data from the CLARICOR trial to identify relevant prognostic quantities, readily available during clinical routine work, when a patient with stable coronary heart disease is seen by the practising physician for reasons other than renewed
cardiac complaints. Such quantities may prove useful as a
background for closer investigation of selected patients. The present analysis also serves as a background for a search for additional prognostic covariates which may be available in the biobank of the CLARICOR trial. A detailed account of methodology and statistical analysis was published before the analysis commenced.3
MaTeRIals Patients
In the CLARICOR trial, 13 702 patients aged 18–85 years who had a discharge diagnosis of myocardial infarction or angina pectoris during 1993–1999 and were alive in August 1999 were invited by letter for a 14-day trial of clarithromycin versus placebo.1 2 Of the 13 702 patients, 6116 accepted the invitation. Of these, 177 refused to participate and 1567 were excluded while 4372 were randomised.
Baseline data were obtained from the hospital files and patient interviews at six cardiology clinics covering the Copenhagen area. Initial follow-up lasted for 2.6 years, during which outcomes were collected through hospital and death registries and assessed by an adjudication committee.2 Corresponding register data later showed to produce similar results.4 5 The adjudicated outcomes were therefore replaced and augmented by register outcomes to cover 10 years of follow-up. Biochemical data were obtained from analysis of serum from the CLARICOR biobank collected at randomisation and stored at −80°C.
The patients excluded from the trial were those who fulfilled the following conditions: (1) suffered from acute myocardial infarction or unstable angina pectoris within the previous 3 months; (2) had percutaneous translu-minal coronary angioplasty and coronary bypass surgery within the previous 6 months; (3) with impaired renal, or (4) hepatic dysfunction, (5) congestive heart failure (New York Heart Association (NYHA) IV classification of heart failure), or (6) active malignancy; (7) without capacity to manage own affairs; and (8) without breast feeding or possible pregnancy.
The main results of the CLARICOR trial were that clar-ithromycin increased the risk of cardiovascular as well as all-cause death.1 6–8 Therefore, we here focus on the placebo group.
Predictors
Data material collected from the 2199 placebo patients was covering the period until 31 December 2009, that is, 10 years (±3 months), and was obtained by use of public
registers with almost 100% coverage,4 5 as explained in the Outcomes section and in refs 4–6.
Demographic and anamnestic data
Enrolment interviews provided smoking status, current medication and known hypertension or diabetes, while information concerning sex, age and history of myocar-dial infarction or unstable angina pectoris was obtained from the local hospital files.
Biochemical measurements on plasma collected at entry
Biochemical measurements on plasma collected at entry included lipoproteins,9 high-sensitivity C-reactive protein (hs-CRP/mg/L)10 and glomerular filtration rate (GFR/ mL/min) using creatinine.11 Along with variables already mentioned, these quantities are those collectively referred to as ‘standard predictors’ and specified in table 1.
Outcomes
We assessed the time from randomisation until the first occurrence of one of the following events: acute myocar-dial infarction, unstable angina pectoris, cerebrovascular disease and all-cause death (the composite outcome) and the time from randomisation to all-cause death. The algo-rithm used to get from the International Statistical Clas-sification of Diseases used in the national registries12 13 to the events of the composite outcome is described in refs 4 5.
MeTHOds
statistical analysis
We used the Cox proportional hazards model supple-mented by Breslow estimation of the baseline hazard and using SAS V.9.4 in agreement with our peer-reviewed, published statistical analysis plan.3 The model assump-tions were tested using Bonferroni adjusted p values.3 14
There are virtually no missing data from entry infor-mation in the CLARICOR trial3 but 9.4% of the patients had one or more laboratory test values missing. We used Little’s test to decide whether to use multiple imputation or a complete case analysis.15
All analyses that included covariates were stratified by centre. For each covariate, we examined if it interacted significantly with sex (using a Bonferroni adjustment).
Inference analyses
If an HR showed a deviation from 1.00 such that p<0.01, we classified the variable as a prognostic predictor, given the outcome analysed and the other covariates included in the analysis. We identified the prognostic predictors among the ‘standard predictors’ for each of the two outcomes, the predictor being tested when used alone in a Cox regression analysis (except for age, see below) and when used in combination with the remaining ‘standard predictors’.3
assessing the prognostic utility of the ‘standard predictors’
We used the Cox-Breslow method to estimate the survival curve of the outcome of each patient using all available
on 23 September 2018 by guest. Protected by copyright.
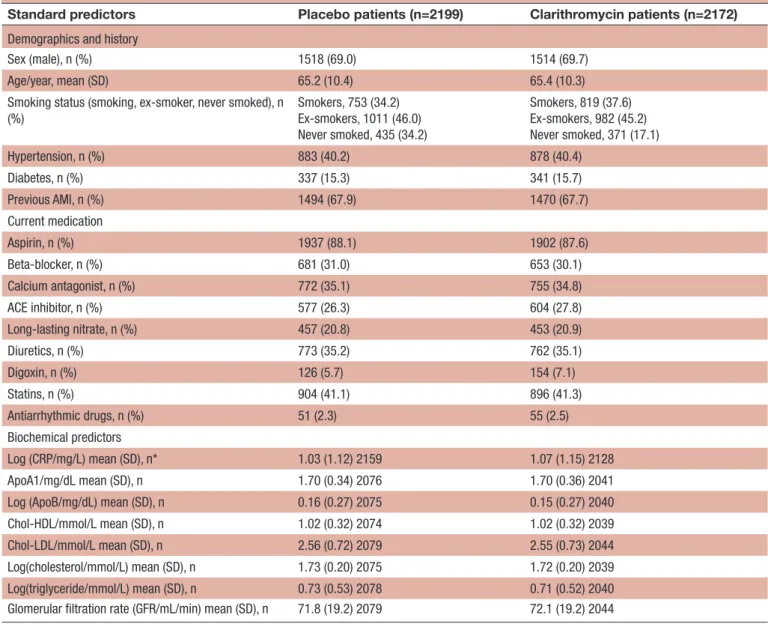
Coronary artery disease Table 1 The distributions of standard predictors in the placebo group and in the group of patients who received
clarithromycin
Standard predictors Placebo patients (n=2199) Clarithromycin patients (n=2172)
Demographics and history
Sex (male), n (%) 1518 (69.0) 1514 (69.7) Age/year, mean (SD) 65.2 (10.4) 65.4 (10.3) Smoking status (smoking, ex-smoker, never smoked), n
(%) Smokers, 753 (34.2) Ex-smokers, 1011 (46.0) Never smoked, 435 (34.2) Smokers, 819 (37.6) Ex-smokers, 982 (45.2) Never smoked, 371 (17.1) Hypertension, n (%) 883 (40.2) 878 (40.4) Diabetes, n (%) 337 (15.3) 341 (15.7) Previous AMI, n (%) 1494 (67.9) 1470 (67.7) Current medication Aspirin, n (%) 1937 (88.1) 1902 (87.6) Beta-blocker, n (%) 681 (31.0) 653 (30.1) Calcium antagonist, n (%) 772 (35.1) 755 (34.8) ACE inhibitor, n (%) 577 (26.3) 604 (27.8) Long-lasting nitrate, n (%) 457 (20.8) 453 (20.9) Diuretics, n (%) 773 (35.2) 762 (35.1) Digoxin, n (%) 126 (5.7) 154 (7.1) Statins, n (%) 904 (41.1) 896 (41.3) Antiarrhythmic drugs, n (%) 51 (2.3) 55 (2.5) Biochemical predictors Log (CRP/mg/L) mean (SD), n* 1.03 (1.12) 2159 1.07 (1.15) 2128 ApoA1/mg/dL mean (SD), n 1.70 (0.34) 2076 1.70 (0.36) 2041 Log (ApoB/mg/dL) mean (SD), n 0.16 (0.27) 2075 0.15 (0.27) 2040 Chol-HDL/mmol/L mean (SD), n 1.02 (0.32) 2074 1.02 (0.32) 2039 Chol-LDL/mmol/L mean (SD), n 2.56 (0.72) 2079 2.55 (0.73) 2044 Log(cholesterol/mmol/L) mean (SD), n 1.73 (0.20) 2075 1.72 (0.20) 2039 Log(triglyceride/mmol/L) mean (SD), n 0.73 (0.53) 2078 0.71 (0.52) 2040 Glomerular filtration rate (GFR/mL/min) mean (SD), n 71.8 (19.2) 2079 72.1 (19.2) 2044
*The value of n varies because the laboratory tests have missing values.
AMI, acute myocardial infarction; Chol, cholesterol; CRP, C-reactive protein; HDL, high-density lipoprotein; LDL, low-density lipoprotein; Log, natural logarithm.
information. From the curve, we read off the probabili-ties that the patient will be event free at time T=3, 6 and 9 years. If the probability is larger than or equal to 0.5, we make the favourable (F) prediction that the patient is still event free at time T; otherwise, we make the unfavour-able (un-F) prediction that the patient experiences an event before T. The truth values of the predictions were determined by comparison with the observed records. To assess the role of the covariates in these predictions we repeated the procedure without introducing any covariates (the Cox output then reduces to a Kaplan-Meier curve). Here we used methods that do not allow time-dependent covariates, so in this case stratification on age was used (cutting at 60 and 75 years) and age was excluded as a covariate.16
We also analysed data using a parametric, accelerated failure time model. For the underlying time-to-event
distribution type of the accelerated failure time model, we considered several choices using q-q graphs to assess the fit14 (p 100). The generalised gamma model gave a perfect fit for the composite outcome and a reasonable fit for all-cause mortality.
Using the events observed during the first 9 years of follow-up, the prognostic differentiation was character-ised by receiver operating characteristics (ROC) and ‘predictive impact’ diagrams.17–19 The hazard estimation is based on the full 10-year follow-up of 1998 patients with complete covariate data but the ROC analysis is limited to what happened to them within the 9-year window.
The calculations involve a prognostic rule being applied to the same data sample from which it was derived. But model fit is assessable (see the ROC diagram).
on 23 September 2018 by guest. Protected by copyright.
http://openheart.bmj.com/
Figure 1 (A) Kaplan-Meier estimate (with 95% CI) of composite outcome including acute myocardial infarction, unstable angina pectoris, cerebrovascular disease, and all-cause death. Figures below the curve are biannual number at risk in the placebo group of the CLARICOR trial. (B) Kaplan-Meier estimate (with 95% CI) of the outcome all-cause death. Figures below the curve are biannual number at risk in the placebo group of the CLARICOR trial.
ResulTs
As Little’s test15 had p=0.93, we used complete case anal-yses in the following.
Table 1 presents an overview of the covariates expected to be available from patients with stable cardiovascular disease during clinical routine work (‘standard predic-tors’). We have shown the corresponding data of the clarithromycin group to illustrate that the randomisa-tion was successful. It appears that the results are consis-tent across the placebo group and the clarithromycin group. Figure 1 presents the Kaplan-Meier curves for the composite outcome (figure 1A) and all-cause death (figure 1B). At 2 years, 1826 (83.0%) had not yet suffered a composite outcome and 2073 (94.3%) were still alive. At 6 years, 1261 (57.3%) had not yet suffered a composite outcome and 1758 (79.9%) were still alive. At 9 years, the numbers are 969 (44.9%) and 1487 (67.6%), respectively. In the following we shall describe the differentiation of these risks offered by the covariates presented in table 1.
Testing the ‘standard predictors’
As the proportional hazards assumption was violated for age we included an interaction between age at entry and time (since randomisation) in the inference analyses.
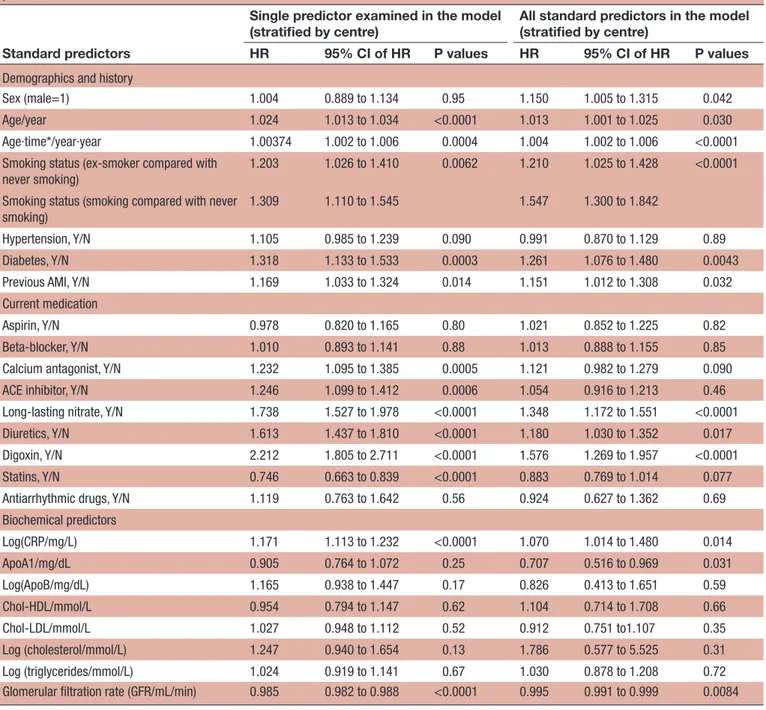
Table 2 shows the HR of each of the ‘standard predic-tors’ when used alone in a Cox analysis (table 2, columns 2–4) and when used in combination with the rest of the ‘standard predictors’ for the composite outcome (table 2, columns 5–7). The main effect of age is only significant when no adjustment by the ‘standard predic-tors’ is used. By contrast, the interaction between age and time is significant with and without adjustment. Smoking habits, diabetes, most of the medication indicators, log (hs-CRP) and reduced GFR predict the risk of the composite outcome when used alone (the threshold of p<0.01). In the analysis that included all the ‘standard predictors’, smoking habits, diabetes, long-lasting nitrate
medication, digoxin medication and GFR provided prog-nostic information.
Table 3, whose structure is the same as that of table 2, shows the results for all-cause death. When each predictor is assessed alone, the results are much like those for the composite outcome. Smoking habits, diabetes, most of the medication indicators, log (hs-CRP) and reduced GFR predict the risk of all-cause death when used alone (p<0.01). When all ‘standard predictors’ are included, male sex now becomes also significantly unfavourable in association with smoking habits, diuretic medication, digoxin medication, log (hs-CRP) and reduced glomer-ular filtration rate. The biochemical lipid quantities were not prognostic.
For neither outcome did any standard predictor interact significantly with sex.
Prognostic impact of the ‘standard predictors’
Table 4 (columns 2–3) shows the types, numbers and percentages of correct predictions obtained when we used the Cox model and the composite outcome without covariates included (column 2) and when the ‘standard predictors’ (and age strata, see the Methods section) were included. The percentages are correct predictions over total number of predictions made (three per patient unless dropout, see footnote §,
table 4). Without covariates included in the model, 63.2% of the predictions were correct. With ‘standard predictors’ included, 68.4% became correct, increasing the number of correct predictions by only 5.2%, and leaving 31.6% in error.
For the all-cause death outcome (see table 4, lower half, left side), the corresponding percentages were 79.9%, 83.4%, 3.5% and 16.6%, respectively. So, it appears that the contributions of the individual’s own routine data (the ‘standard predictors’) to the predictions are rather modest.
on 23 September 2018 by guest. Protected by copyright.
Coronary artery disease Table 2 Composite outcome including acute myocardial infarction, unstable angina pectoris, cerebrovascular disease and all-cause death. HRs of standard predictors when used alone and when used in combination with the rest of the standard predictors
Standard predictors
Single predictor examined in the model
(stratified by centre) All standard predictors in the model (stratified by centre) HR 95% CI of HR P values HR 95% CI of HR P values
Demographics and history
Sex (male=1) 1.004 0.889 to 1.134 0.95 1.150 1.005 to 1.315 0.042 Age/year 1.024 1.013 to 1.034 <0.0001 1.013 1.001 to 1.025 0.030 Age∙time*/year∙year 1.00374 1.002 to 1.006 0.0004 1.004 1.002 to 1.006 <0.0001 Smoking status (ex-smoker compared with
never smoking)
1.203 1.026 to 1.410 0.0062 1.210 1.025 to 1.428 <0.0001 Smoking status (smoking compared with never
smoking)
1.309 1.110 to 1.545 1.547 1.300 to 1.842
Hypertension, Y/N 1.105 0.985 to 1.239 0.090 0.991 0.870 to 1.129 0.89 Diabetes, Y/N 1.318 1.133 to 1.533 0.0003 1.261 1.076 to 1.480 0.0043 Previous AMI, Y/N 1.169 1.033 to 1.324 0.014 1.151 1.012 to 1.308 0.032 Current medication
Aspirin, Y/N 0.978 0.820 to 1.165 0.80 1.021 0.852 to 1.225 0.82 Beta-blocker, Y/N 1.010 0.893 to 1.141 0.88 1.013 0.888 to 1.155 0.85 Calcium antagonist, Y/N 1.232 1.095 to 1.385 0.0005 1.121 0.982 to 1.279 0.090 ACE inhibitor, Y/N 1.246 1.099 to 1.412 0.0006 1.054 0.916 to 1.213 0.46 Long-lasting nitrate, Y/N 1.738 1.527 to 1.978 <0.0001 1.348 1.172 to 1.551 <0.0001 Diuretics, Y/N 1.613 1.437 to 1.810 <0.0001 1.180 1.030 to 1.352 0.017 Digoxin, Y/N 2.212 1.805 to 2.711 <0.0001 1.576 1.269 to 1.957 <0.0001 Statins, Y/N 0.746 0.663 to 0.839 <0.0001 0.883 0.769 to 1.014 0.077 Antiarrhythmic drugs, Y/N 1.119 0.763 to 1.642 0.56 0.924 0.627 to 1.362 0.69 Biochemical predictors Log(CRP/mg/L) 1.171 1.113 to 1.232 <0.0001 1.070 1.014 to 1.480 0.014 ApoA1/mg/dL 0.905 0.764 to 1.072 0.25 0.707 0.516 to 0.969 0.031 Log(ApoB/mg/dL) 1.165 0.938 to 1.447 0.17 0.826 0.413 to 1.651 0.59 Chol-HDL/mmol/L 0.954 0.794 to 1.147 0.62 1.104 0.714 to 1.708 0.66 Chol-LDL/mmol/L 1.027 0.948 to 1.112 0.52 0.912 0.751 to1.107 0.35 Log (cholesterol/mmol/L) 1.247 0.940 to 1.654 0.13 1.786 0.577 to 5.525 0.31 Log (triglycerides/mmol/L) 1.024 0.919 to 1.141 0.67 1.030 0.878 to 1.208 0.72 Glomerular filtration rate (GFR/mL/min) 0.985 0.982 to 0.988 <0.0001 0.995 0.991 to 0.999 0.0084
*Time is years since randomisation.
AMI, acute myocardial infarction; Chol, cholesterol; CRP, C-reactive protein; HDL, high-density lipoprotein; LDL, low-density lipoprotein; N, hypertension is not present; Y, hypertension is present.
Table 4 (columns 4 and 5) shows the corresponding results obtained when we used the accelerated failure time model. These results are very similar to those obtained using the Cox model.
Table 5 shows the C indices for the composite outcome and its components, describing concordance as to whether patients were to experience the event in ques-tion (within the 9-year window). The underlying ROC curve is given in figure 2Afor all-cause death. The empir-ical curve (dashed) shows that the 644 deaths and 1354 survivals closely fit the predicted pattern (smooth curve).
Figure 2Bholds a ‘predictive impact’ graph, designed to compare the predictive power of rival prognostic rules. The diagram estimates the benefit that might accrue by treating high-risk patients if a completely effective preventive intervention existed. The patients are ordered according to assigned risk (just as in the ROC). As a func-tion of the percentage imagined to be selected for treat-ment (abscissa), the ordinate shows how many deaths (dashed) and life-years (fat curve) would be saved. Within the 9-year window, the 644 deaths will cause 2703 years to be lost without treatment. From the graph it may be read
on 23 September 2018 by guest. Protected by copyright.
http://openheart.bmj.com/
Table 3 All-cause death. HRs of standard predictors when used alone and when used in combination with the rest of the standard predictors
Standard predictors
Single predictor examined in the model (stratified by centre)
All ‘standard predictors’ in the model (stratified by centre)
HR 95% CI of HR P values HR 95% CI of HR P values
Demographics and history
Sex (male=1) 0.970 0.831 to 1.132 0.70 1.329 1.119 to 1.578 0.0012 Age/year 1.065 1.046 to 1.084 <0.0001 1.047 1.027 to 1.068 <0.0001 Age∙time*/year∙year 1.00305 1.000056 to 1.0061 0.045 1.004 1.001 to 1.007 0.011 Smoking status (ex-smoker compared with
never smoking)
1.366 1.109 to 1.683 0.0071 1.436 1.155 to 1.786 <0.0001 Smoking status (smoking compared with never
smoking)
1.379 1.109 to 1.714 2.135 1.692 to 2.693
Hypertension, Y/N 1.117 0.965 to 1.293 0.14 1.001 0.848 to 1.181 0.99 Diabetes, Y/N 1.456 1.211 to 1.751 <0.0001 1.410 1.161 to 1.713 0.0005 Previous AMI, Y/N 1.166 0.995 to 1.368 0.058 1.161 0.985 to 1.369 0.075 Current medication
Aspirin, Y/N 0.854 0.689 to 1.059 0.15 0.898 0.718 to 1.124 0.35 Beta-blocker, Y/N 0.926 0.790 to 1.084 0.34 0.916 0.773 to 1.085 0.31 Calcium antagonist, Y/N 1.193 1.028 to 1.385 0.020 0.999 0.845 to 1.181 0.99 ACE inhibitor, Y/N 1.349 1.153 to 1.579 0.0002 1.056 0.886 to 1.258 0.54 Long-lasting nitrate, Y/N 1.776 1.513 to 2.084 <0.0001 1.178 0.991 to 1.400 0.063 Diuretics, Y/N 2.183 1.889 to 2.524 <0.0001 1.432 1.210 to 1.694 <0.0001 Digoxin, Y/N 3.008 2.388 to 3.790 <0.0001 1.826 1.428 to 2.334 <0.0001 Statins, Y/N 0.597 0.511 to 0.697 <0.0001 0.812 0.675 to 0.976 0.027 Antiarrhytmic drugs, Y/N 1.113 0.677 to 1.830 0.67 0.798 0.482 to 1.320 0.38 Biochemical predictors Log(CRP/mg/L) 1.283 1.202 to 1.370 <0.0001 1.147 1.070 to 1.230 0.0001 ApoA1/mg/dL 1.089 0.878 to 1.351 0.44 0.928 0.615 to 1.401 0.72 Log(ApoB/mg/dL) 0.923 0.704 to 1.210 0.56 0.483 0.202 to 1.156 0.10 Chol-HDL/mmol/L 1.192 0.947 to 1.501 0.13 0.884 0.503 to 1.551 0.67 Chol-LDL/mmol/L 0.958 0.865 to 1.060 0.41 0.982 0.772 to 1.250 0.88 Log (cholesterol/mmol/L) 1.169 0.819 to 1.668 0.39 1.895 0.455 to 7.899 0.38 Log (triglycerides/mmol/L) 0.868 0.755 to 0.997 0.045 0.882 0.716 to 1.086 0.24 Glomerular filtration rate (GFR/mL/min) 0.972 0.969 to 0.976 <0.0001 0.990 0.985 to 0.994 <0.0001 *Time is years since randomisation.
AMI, acute myocardial infarction; Chol, cholesterol; CRP, C-reactive protein; HDL, high-density lipoprotein; LDL, low-density lipoprotein; N, hypertension is not present; Y, hypertension is present.
that if 10% of the patients were to be treated with a 100% effective intervention, 29% of the total loss of years may be saved.
dIsCussIOn
In this study, we assessed the predictive value of ‘standard predictors’ routinely available for a general practitioner when he/she meets a patient with stable coronary heart disease whose visit is not prompted by renewed cardiac complaints. When no ‘standard predictors’ were included in the prediction, 63.2% of the model-based predictions
of the composite outcome and 79.9% of all-cause death predictions were correct. Including all ‘standard predic-tors’ in the model increased the figures to 68.4% and 83.4%, respectively.
We have not been able to identify a study where death of all causes and cardiovascular insults have been assessed in patients with (1) stable coronary heart disease of a type like the above described, (2) with a 10-year follow-up, and (3) where the clinical examination was not prompted by renewed cardiovascular complaints. Taken together, most of the studies we identified were either analysing
on 23 September 2018 by guest. Protected by copyright.
Coronary artery disease Table 4 The types and numbers of correct predictions obtained when the Cox proportional hazards model was used and when the accelerated failure model (using generalised gamma distribution) was used. For comparison, the results without covariates included are shown
Type of predictions*
Statistical model used
Cox proportional hazards model† Accelerated failure model (using generalised gamma distribution) No covariates
Covariates
included No covariates Covariates included Composite outcome‡
True favourable predictions, n (%) (out of a total of 5970 predictions made)§
2658 (44.5) 2910 (48.7) 2658 (44.5) 2918 (48.9) True unfavourable predictions, n (%) (out of a total of
5970 predictions made)
1115 (18.7) 1174 (19.7) 1115 (18.7) 1197 (20.0) Total number of true predictions, n (%) (out of a total
of 5970 predictions made)
3773 (63.2)§ 4084 (68.4) 3773 (63.2) 4115 (68.9)
All-cause death
True favourable predictios, n(%) (out of a total of 5970 predictions made)
4768 (79.9) 4585 (76.8) 4768 (79.9) 4563 (76.4) True unfavourable predictions, n (%) (out of a total of
5970 predictions made)
0 (0)¶ 392 (6.57) 0 (0) 401 (6.72) Total number of true predictions, n (%) (out of a total
of 5970 predictions made)
4768 (79.9) 4977 (83.4) 4768 (79.9) 4964 (83.1)
*For each patient at time (T) equal to 3, 6 and 9 years and using the patient’s individual survival curve the predicted outcome (patient ‘alive at T’ (favourable outcome) compared with patient ‘not alive at T’ (unfavourable outcome)) was read off the survival curve and the results compared with the observed outcome. When no covariates were included in the model, the Kaplan-Meier survival curve was used to calculate the predictions.
†Time-dependent covariates were not allowed in the SAS V.9.4 program used. To allow for the fact that age violated the proportional hazard
assumption we stratified by age categories (see text) in addition to centre and excluded age from the covariates.21
‡Comprising acute myocardial infarction, unstable angina pectoris, cerebrovascular disease and all-cause death.
§n is the number of true predictions made. The per cent is n over the total number of predictions made. 5970 predictions are made, namely 1998 patients with complete covariates times three time points (at 3, 6 and 9 years) minus 24 predictions not checkable due to patients lost to registries. Of these predictions, a total of 3773 were true which amounts to 3773/5970=63.2%.
¶As total mortality is <50%, all predictions are automatically favourable (and 79.9% of them pertain to a so far survivor).
small study samples, for example,20 were developed in patients with acute coronary syndromes,21 or had short follow-up.22
In many respects, our patients are like those of the Prospective Observational Longitudinal Registry of Patients with Stable Coronary Heart Disease (CLARIFY) study23 which enrolled 20 291 patients of whom 20% had anginal symptoms corresponding to the 20% of our patients who took long-lasting nitrates. Patients with hospital admission for cardiovascular reasons (including revasculariation) in the past 3 months before enrolment or conditions interfering with life expectancy such as cancer and NYHA class 4 were excluded. So, in these respects, the CLARIFY patients are like our patients. However, the CLARIFY patients had been observed with a median of 24.1 months and enrolment took place 10 years later than in the CLARICOR trial. A total of 469 cardiovascular deaths or myocardial infarctions occurred in these patients (2.3%).23 By contrast, in our cohort the corresponding numbers found during the first 2 years of observation were 170 cardiovascular deaths and 7.7%, respectively, probably reflecting improved quality of treatment and more frequent statin treatment in the
CLARIFY patients (84% vs only 41% in the CLARICOR patients).
Many of our ‘standard predictors’ showed that they contained statistically significant prognostic informa-tion. However, few of the ‘standard predictors’ contrib-uted statistically significant prognostic information when all predictors were tested simultaneously. More-over, the ‘standard predictors’ offered little prognostic discrimination.
Methodology
Regarding our methodology, the performance statistics reported here are minimal, but they suffice to show that the results are meagre, leaving room for improvement with advanced biomarkers.3 Prediction at 3, 6 and 9 years covers the follow-up as well as would a sophisticated inte-gral over continuous time. Using 0.50 as a probability threshold is again a least arbitrary choice (the relative impact of false and true predictions being unknown), as is the ROC principle. Adding realism to the naked construct of a ‘completely effective preventive interven-tion’ (figure 2B) would again be subject to criticism in the absence of alternatives, with solid empirical backing.
on 23 September 2018 by guest. Protected by copyright.
http://openheart.bmj.com/
Table 5 Receiver operating characteristic (ROC) areas (C indices) of placebo patients with complete records (n=1998). Nine-year risks assigned by the Cox analysis using all standard predictors
Outcome
Ordinary ROC area (event Yes compared with No,
regardless of time) Dynamic C index*
Acute myocardial infarction (AMI)
0.643 0.651 Unstable angina pectoris
(UAP) 0.637 0.616 Cerebrovascular disease (CVD) 0.606 0.680 Cardiovascular death (non-cardiovascular death) 0.761 (0.736) 0.730 (0.728) All-cause death 0.792 0.737 Composite outcome† 0.711 0.640
*When a patient had no event of the kind concerned within the 9-year window, we define: toe (time of event) = + ∞. Then, C is the frequency of concordant risks (equal risk weighs 1/2) among patient pairs whose toe data allow us to decide who died first: C=freq {concordant risks (or equal risk, 0.5) | sign of toe difference known from data}.
†Consists of acute myocardial infarction, unstable angina pectoris, cerebrovascular disease and all-cause death.
Figure 2 (A) ROC diagram (death vs survival at 9 year data). (B) Predicted imapct curves. ROC, receiver operating characteristic.
strengths
The strengths of the CLARICOR trial are the consider-able size of the patient population, the long duration of follow-up, few losses to follow-up (0.5%), the ethnic homogeneity of the patient population, rarity of missing values, with focus on an operationally defined, homoge-neous and relevant patient category. The design implies that the patients are sampled at random, presumably uneventful, time points during their stable state (as defined by the CLARICOR trial). Furthermore, the large
biobank formed during the trial allows an extensive search for new advanced biomarkers to be made.
limitations
Among those 7586 patients who declined our invitation to visit a cardiology centre, many must have been eligible for the CLARICOR trial, and we do not know how they looked and fared. With a response rate of about 50%, the cohort could represent a prognostic elite if responders were mostly mobile and health-conscious patients. So, selection bias cannot be excluded.
Furthermore, the patients recruited for the CLARICOR trial were diagnosed with coronary heart disease about 20 years ago. Because of the tremendous developments in treatment and rehabilitation, there has been a very significant and graded increase in prognosis of such patients,24 as shown in national data.25 Given these uncer-tainties, prognostic findings in the CLARICOR cohort should not directly be applied to present-day patient materials. However, the overall picture regarding the relative predictive effect of ‘standard predictors’ and advanced biomarkers should provide relevant and valu-able information.
Potential weaknesses of the present cohort within the context of prognostication of patients with stable coro-nary heart disease as here defined include the lack of information about left ventricle function, body mass index and blood pressure, as well as the effects of changes in medications during follow-up. Information about post-infarction heart failure and postpost-infarction angina pectoris was not available to us. But information about the medi-cation at entry into CLARICOR served as proxy informa-tion. The lack of left ventricular ejection fraction may be partially or completely compensated, as Solomon et al26 found that age, sex, hypertension, prior acute myocardial infarction, creatinine, diuretics and digoxin were related to left ventricular ejection fraction, all quantities that we have included within the group referred to as ‘standard
on 23 September 2018 by guest. Protected by copyright.
Coronary artery disease
predictors’. The shortcomings of our data files are miti-gated by the fact that by design the present study focuses on the situation where patients with stable coronary heart disease visit a physician for reasons unrelated to the coro-nary heart disease. Here it might be of value if simple clinical information readily available could be used to screen these patients with stable coronary heart disease to identify high-risk patients who might be referred to a more thorough cardiologic examination and follow-up.
It was our hope that the simple ‘standard predictors’ of
table 1 might serve this purpose, but they proved too little informative. Behind this disappointing feature lie undoubt-edly a meshwork of behavioural and statistical interconnec-tions that are impossible to unravel. A reviewer has pointed out that ‘index event’ phenomena27–29 may also be involved. Briefly, to develop an index event (say, infarction), those with a given low-risk trait tend to have unrecorded high-risk traits, and vice versa, so, to the extent that risk traits are permanent, high-low follow-up comparisons will be biased when based on such patients. While this is true, there is no prognostic bias here as the index event is part of the defini-tion of the populadefini-tion of interest.
Furthermore, patients, if any, who became eligible for the CLARICOR trial during the period 1993–1999 and then died before August 1999, are absent. Thus, our data do not represent patients as they enter a stable disease state (as delimited by CLARICOR exclusion criteria); instead, they may be regarded as community patients (subject to some self-selection) seen by their physician on a random date during their stable state.
Our model was tested using the same data that were used to derive it. Therefore, we do not feel it is advisable to use the results for predictive purposes without using some independent data to calibrate the model, and for this and the above-mentioned reasons we have elected not to present an explicit prediction model.
author affiliations
1Copenhagen Trial Unit, Centre for Clinical Intervention Research, Rigshospitalet,
Copenhagen University Hospital Blegdamsvej, Copenhagen, Denmark
2Department of Cardiology, Holbæk Hospital, Holbæk, Denmark
3Section of Biostatistics, Department of Public Health Research, University of
Copenhagen, Copenhagen, Denmark
4Department of Cardiology, Hvidovre Hospital, Copenhagen University Hospital,
Copenhagen, Denmark
5Department of Cardiology S, Herlev Hospital, Copenhagen University Hospital,
Copenhagen, Denmark
6Department of Cardiology, Bispebjerg Hospital, Copenhagen University Hospital,
Copenhagen, Denmark
7Department of Cardiology B, The Heart Centre, Rigshospitalet, Copenhagen
University Hospital, Copenhagen, Denmark
8Department of Clinical Microbiology, Odense University Hospital, Odense, Denmark
9Department of Medical Sciences, Uppsala University, Uppsala, Sweden
10School of Health and Social Studies, Dalarna University, Falun, Sweden
11Division of Family Medicine and Primary Care, Department of Neurobiology, Care
Science and Society, Karolinska Institutet, Huddinge, Sweden
acknowledgements We thank the CLARICOR trial participants. We thank the investigators and other staff involved in the first phases of the CLARICOR trial (for full list of names, please see references 6, 11, and 13. We also thank our original funders of the CLARICOR trial (see references 6, 11, and 13). The Copenhagen Trial Unit, Centre for Clinical Intervention Research, is thanked for providing monetary
support for part of the biochemical analyses for the PREMAC study as well as wages for Per Winkel, Janus C. Jacobsen, and Christian Gluud.
Contributors PW, JH, JCJ and CG contributed substantially to the concept and design and drafted the manuscript. PW and JH conducted the statistical analyses. AL and JÄ conducted the analysis of lipids and creatinine. All authors revised the manuscript critically for important intellectual content, gave final approval of the version to be published, and agreed to be accountable for all aspects of the work in assuring that questions related to the accuracy or integrity of any part of the work are appropriately investigated and resolved.
Funding This study was funded by the Copenhagen Trial Unit, Centre for Clinical Intervention Research; original funders of the CLARICOR trial; and the Swedish Research Council, Swedish Heart-Lung Foundation; Thuréus Foundation; Marianne and Marcus Wallenberg Foundation, Dalarna University; and Uppsala University. Competing interests None declared.
Patient consent Not required.
ethics approval Danish Ethics Committee.
Provenance and peer review Not commissioned; externally peer reviewed. data statement All pertinent anonymised data will be uploaded at ZENODO (http:// zenodo. org/) when the individual manuscripts have been published. Open access This is an Open Access article distributed in accordance with the Creative Commons Attribution Non Commercial (CC BY-NC 4.0) license, which permits others to distribute, remix, adapt, build upon this work non-commercially, and license their derivative works on different terms, provided the original work is properly cited and the use is non-commercial. See: http:// creativecommons. org/ licenses/ by- nc/ 4.0
RefeRences
1. Jespersen CM, Als-Nielsen B, Damgaard M, et al. Randomised placebo controlled multicentre trial to assess short term clarithromycin for patients with stable coronary heart disease: CLARICOR trial. BMJ 2006;332:22–7.
2. Hansen S, Als-Nielsen B, Damgaard M, et al. Intervention with clarithromycin in patients with stable coronary heart disease. Heartdrug 2001;1:14–19.
3. Winkel P, Jakobsen JC, Hilden J, et al. Predictors for major cardiovascular outcomes in stable ischaemic heart disease (PREMAC): statistical analysis plan for data originating from the CLARICOR (clarithromycin for patients with stable coronary heart disease) trial. Diagn Progn Res 2017;1:10.
4. Kjøller E, Hilden J, Winkel P, et al. Good interobserver agreement was attainable on outcome adjudication in patients with stable coronary heart disease. J Clin Epidemiol 2012;65:444–53. 5. Kjøller E, Hilden J, Winkel P, et al. Agreement between public
register and adjudication committee outcome in a cardiovascular randomized clinical trial. Am Heart J 2014;168:197–204. 6. Winkel P, Hilden J, Hansen JF, et al. Clarithromycin for stable
coronary heart disease increases all-cause and cardiovascular mortality and cerebrovascular morbidity over 10 years in the CLARICOR randomised, blinded clinical trial. Int J Cardiol 2015;182:459–65.
7. Winkel P, Hilden J, Fischer Hansen J, et al. Excess sudden cardiac deaths after short-term clarithromycin administration in the CLARICOR trial: why is this so, and why are statins protective? Cardiology 2011;118:63–7.
8. Gluud C, Als-Nielsen B, Damgaard M, et al. Clarithromycin for 2 weeks for stable coronary heart disease: 6-year follow-up of the CLARICOR randomized trial and updated meta-analysis of antibiotics for coronary heart disease. Cardiology 2008;111:280–7. 9. Helmersson-Karlqvist J, Ridefelt P, Lind L, et al. Reference values for
34 frequently used laboratory tests in 80-year-old men and women. Maturitas 2016;92:97–101.
10. Harutyunyan MJ, Mathiasen AB, Winkel P, et al. High-sensitivity C-reactive protein and N-terminal pro-B-type natriuretic peptide in patients with stable coronary artery disease: a prognostic study within the CLARICOR trial. Scand J Clin Lab Invest 2011;71:52–62. 11. Inker LA, Schmid CH, Tighiouart H, et al. Estimating glomerular
filtration rate from serum creatinine and cystatin C. N Engl J Med 2012;367:20–9.
12. Helweg-Larsen K. The Danish register of causes of death. Scand J Public Health 2011;39(7 Suppl):26–9.
13. Lynge E, Sandegaard JL, Rebolj M. The danish national patient register. Scand J Public Health 2011;39(7 Suppl):30–3.
on 23 September 2018 by guest. Protected by copyright.
http://openheart.bmj.com/
14. Lin DY, Wei LJ, YING Z. Checking the Cox model with cumulative sums of martingale-based residuals. Biometrika 1993;80:557–72. 15. Little RJA. A test of missing completely at random for multivariate
data with missing values. J Am Stat Assoc 1988;83:1198–202. 16. Allison PD. Survival analysis using SAS: a practical guide, 2nd edn.
NC, USA: SAS institute Inc. Cary, 2010.
17. Pfeiffer RM, Gail MH. Two criteria for evaluating risk prediction models. Biometrics 2011;67:1057–65.
18. Bjerre M, Hilden J, Kastrup J, et al. Osteoprotegerin independently predicts mortality in patients with stable coronary artery disease: the CLARICOR trial. Scand J Clin Lab Invest 2014;74:657–64.
19. Campbell W, Ganna A, Ingelsson E, et al. Prediction impact curve is a new measure integrating intervention effects in the evaluation of risk models. J Clin Epidemiol 2016;69:89–95.
20. Uthoff H, Staub D, Socrates T, et al. PROCAM-, FRAMINGHAM-, SCORE- and SMART-risk score for predicting cardiovascular morbidity and mortality in patients with overt atherosclerosis. Vasa 2010;39:325–33.
21. Pocock SJ, Huo Y, Van de Werf F. Predicting two-year mortality from discharge after acute coronary syndrome: An internationally-based risk score. Eur Heart J Acute Cardiovasc Care 2017. doi: 10.1177/2048872617719638. [Epub ahead of print].
22. Raposo L, Ferreira J, Aguiar C, et al. Metabolic score--a simple risk marker in non-ST elevation acute coronary syndromes. Rev Port Cardiol 2006;25:155–71.
23. Steg PG, Greenlaw N, et al. Prospective Observational Longitudinal Registry of Patients With Stable Coronary Artery Disease
(CLARIFY) Investigators. Prevalence of anginal symptoms and myocardial ischemia and their effect on clinical outcomes in outpatients with stable coronary artery disease: data from the International Observational CLARIFY Registry. JAMA Intern Med 2014;174:1651–9.
24. Task Force Members, ESC Committee for Practice Guidelines, Document Reviewers. 2013 ESC guidelines on the management of stable coronary artery disease: the Task Force on the management of stable coronary artery disease of the European Society of Cardiology. Eur Heart J 2013;34:2949–3003.
25. Schmidt M, Jacobsen JB, Lash TL, et al. 25 year trends in first time hospitalisation for acute myocardial infarction, subsequent short and long term mortality, and the prognostic impact of sex and comorbidity: a Danish nationwide cohort study. BMJ 2012;344(jan25 2):e356.
26. Solomon SD, Claggett B, Desai AS, et al. Influence of ejection fraction on outcomes and efficacy of sacubitril/valsartan (lcz696) in heart failure with reduced ejection fractionCLINICAL PERSPECTIVE. Circulation 2016;9:e00274.
27. Smits LJ, van Kuijk SM, Leffers P, et al. Index event bias-a numerical example. J Clin Epidemiol 2013;66:192–6.
28. Dahabreh IJ, Kent DM. Index event bias as an explanation for the paradoxes of recurrence risk research. JAMA 2011;305:822–3. 29. Hilden J. Statistiske faldgruber og illusioner [Statistical pitfalls and
illusions]. Nordisk Medicin 1986;101:168–70.
on 23 September 2018 by guest. Protected by copyright.