Research
In situ NMR condition
monitoring of cable
insulations in Nuclear
Power Plants
2021:01
Authors: Prof. István Furó, KTH, Stockholm
Dr. Payam Pourmand, KTH, Stockholm
SSM perspective
Background
As the nuclear power plants are ageing, it is important to verify that every component installed can function safely in the intended environ-ment. Cables are among the most common components in a nuclear power plant and are required to function during normal operation as well as in the event of an accident. There is a need within the nuclear industry for methodologies which can facilitate on-site measurement for condition monitoring, while having the capability to provide non-destructive in-situ measurements of cable insulation material. Therefore, the aim of this study has been to evaluate if a portable Nuclear Magnetic resonance (NMR) sensor can be constructed for assessing cables and if the prospect exists for assessing the structure profle of a cable.
Results
Portable NMR sensors have never before been constructed for the purpose of evaluating cables. Construction and design of such sensor is therefore state-of the art and a tremendous engineering challenge due to the complex structure of cables. In this report KTH presents extensive simulations made with Comsol Multiphysics, investigating two diferent magnet system arrangements and the radiofrequency excita-tion system. These simulaexcita-tions studies have been used for the develop-ment of a state-of the art working prototype of the portable NMR sensor, which has been named prototype N1. The prototype has been evaluated by testing on a range of diferent cables, supplied by Forsmark AB and Ringhals AB. Results indicate that the prototype has the capability to measure the insulation material of unshielded cables (no steel armour surrounding the cable). However, evaluating cables with a shielding is far more a challenge, as the shielding material strongly suppresses the magnetic feld and reduces the chance of recording any NMR signal. The engineering challenge for future project will therefore be to inves-tigate the efects from shielding, and hopefully fnd an engineering solution that can provide sufcient capability for NMR experiments. It has also been demonstrated that the relaxation times, recorded by the prototype N1, correlate to an extent with mechanical parameters such as strain at break and indenter modulus. The study shows so far, that the constructed NMR prototype (N1) can be a possible method for investi-gating material deterioration in cables.
Relevance
The results obtained in this study show that the developed portable NMR sensor, prototype N1, can be used as a non-destructive method to evaluate the condition of commercial cables. Further development of this method would provide data that could be analysed and used to better understand the ageing mechanisms of cables in nuclear power plants. Furthermore, the data could provide knowledge of safety margins, adding valuable information to maintenance programs and achieving safe operations.
Need for further research
The developed technique is not mature and requires further critical evaluation. Foremost the efects caused by cable shielding material (either Aluminium or Stainless steel) need to be addressed and solutions have to be developed.
Project information
Contact person SSM: Elena Calota Reference: SSM2016-1297 / 7030067-00
Authors: Prof. István Furó 1), Dr. Payam Pourmand 1), Dr. Pavel Yushmanov 2)
1) KTH, Stockholm
2) P&L Scientific, Stockholm
2021:01
In situ NMR condition monitoring of
cable insulations in Nuclear Power
Plants
This report concerns a study which has been conducted for the Swedish Radiation Safety Authority, SSM. The conclusions and view-points presented in the report are those of the author/authors and do not necessarily coincide with those of the SSM.
In situ NMR condition monitoring of
cable insulations in Nuclear power
plants – SSM2016-1297
01.05.2020 Project group:
Prof. István Furó, KTH Dr. Payam Pourmand, KTH
Dr. Pavel Yushmanov, P&L Scientific
Sammanfattning
Projektet (SSM2016-1297) möjliggjordes genom ett forskningsbidrag från strålsäkerhetsmyndigheten (SSM). Syftet med detta projekt har varit att utvärdera möjligheten att utforma och bygga en icke-förstörande analysmetod för utvärdering av kablar i svenska kärnkraftverk. Kablar är bland de vanligaste komponenterna i ett kärnkraftverk och måste fungera under normal drift och i händelse av en olycka. Därför finns det ett behov att kunna utvärdera kablars tillstånd och uppnå en driftsäkermiljö. Syftet med denna studie har varit att utvärdera om en portabel kärnmagnetisk resonans (NMR) sensor kan konstrueras för att bedöma kablar, och om det finns möjligheter att bedöma en kabels strukturprofil. Enligt vår vetskap har inga portabla NMR-sensorer tidigare konstruerats för utvärdering av kablar. Konstruktion och design av en sådan sensor är därför unik och en enorm teknisk utmaning på grund av kablarnas komplexa struktur och resulterande effekt på sensorns magnetfält.
Vi har utfört omfattande simuleringar inom Comsol Multiphysics för att utvärdera olika prototypkonstruktioner. I alla simuleringar antog vi att kabeln är fysiskt tillgänglig från alla sidor men förblir intakt under testerna. Först simulerade vi det statiska magnetfältet och dess fördelning som kan uppnås efter att ha ordnat magneter med olika geometrier runt kabeln. De viktiga parametrarna var styrkan (gynnsam: så hög som möjligt nära den konduktiva ledaren) och homogenitet. Detta är framförallt viktigt för att kunna möjliggöra mätning av polymera isolationsmaterial som omger en kabels konduktiva ledare. Den andra gruppen av simuleringar bedömde penetrering och distribution av radiofrekvensfält (rf)-fält i kablarna från rf-spolar. Vi finner att (i) i oskärmade kablar är rf-fälten höga och förstärkta i närheten av kabelns konduktiva ledare (ii) i skärmade kablar dämpas rf-fälten till opraktiskt låga nivåer. Därför är vår sammanfattande bedömning att i oskärmade kablar är det möjligt att göra de önskade NMR-experimenten och kunna genomföra dem med tillräcklig kvalitet.
Baserat på resultat från simulationsstudierna konstruerades en portabel NMR-sensor (prototyp N1). Prototypen har utvärderats genom att testas på en rad olika kablar, levererade av Forsmark AB och Ringhals AB. Resultaten indikerar att prototypen har förmågan att mäta isoleringsmaterialet för oskärmade kablar (ingen stålskärmning omger kabeln). För att få en bättre förståelse från de uppmätta NMR-relaxationstiderna, T2 och jämföra dessa resultat med
väl etablerade parametrar. Så utvärderades kablar med mekaniska testmetoder såsom dragprovning och hårdhetsmätning (indenter modul).
Summary
The project (SSM2016-1297) was made possible by a research grant from the Swedish radiation authority (SSM). The purpose of this project has been to evaluate the possibility of designing and building a non-destructive analysis method for evaluating cables in Swedish nuclear power plants. Cables are among the most common components in a Nuclear power plant and are required to function during normal operation and in the event of an accident. Therefore, there is a need for the ability to monitor the condition of cables and achieving safe operations. The aim of this study has been to evaluate if a portable Nuclear Magnetic resonance (NMR) sensor can be constructed for assessing cables and if the prospect exists for assessing the structure profile of a cable. To our knowledge, no portable NMR sensors has never before been constructed for evaluating cables. Construction and design of such sensor is therefore state-of the art and unique, although a tremendous engineering challenge due to the complex structure of cables.
We have performed extensive simulations within Comsol Multiphysics in order to evaluate the expected performance of NMR experiments for assessing the state of polymeric material components adjacent to the conductor. In all simulations we assumed that the cable is physically accessible from all sides but remain intact during the tests. First, we simulated the static magnetic field and its distribution that can be achieved after having arranged magnets of various geometries around the cable. The important parameters were the strength (favourable: as high as possible close to the metal filaments) and homogeneity. The second group of simulations assessed the penetration and distribution of radiofrequency (rf) fields in the cables from rf coils surrounding a short-selected cable section. We find that (i) in unshielded cables the rf fields are high and favourably amplified nearby the wire elements in the cable core but (ii) in shielded cables the rf fields are damped to impractically low levels. Hence, our summary judgment is that in unshielded cables it is possible to make the desired NMR experiments and to be able to do them with sufficient quality.
Furthermore, the simulations studies have been the foundation for the development and construction of a portable NMR sensor (prototype N1). The prototype has been evaluated by testing on a range of different cables, supplied by Forsmark AB and Ringhals AB. Results indicate that the prototype has the capability to measure the insulation material of unshielded cables (no steel armor surrounding the cable). Although evaluating cables with a shielding is far more a challenge, as the shielding material strongly suppresses the magnetic field and reduces the chance of recording any NMR signal. In order to get a better understanding from the measured NMR relaxation times, T2 and comparing these results to well established
parameters; cables were evaluated by mechanical testing methods such as tensile and indenter modulus testing.
Contents 2016:1297
1. Introduction ... 1
2. NMR theory ... 2
Measuring transverse relaxation time ... 2
Low and high field NMR. ... 2
The NMR MOUSE ... 3
3. Computer simulation study ... 5
Evaluation of the main physical properties for the given cable samples ... 5
3.1 Calculation of the static magnetic field profiles ... 8
Cylindrical ring magnet design. ... 9
Halbach NMR Mandhalas magnet-design. ... 14
3.2 Calculation of the radiofrequency field profiles... ... 18
Solenoid rf coil configuration ... 22
Comparison of the saddle and solenoid rf-coils designs ... 24
3.3 Assessment from simulation study ... 25
4. Construction and testing of prototype NMR sensor ... 26
4.1 Experimental ... 26
Materials ... 26
Nuclear magnetic resonance (NMR) spectroscopy ... 29
Mechanical testing ... 30
4.2 Results and discussions ... 31
NMR measurements by the commercial Magritek NMR mouse assembly ... 32
The prototype N1; design and construction ... 33
Experimental results ... 37
Mechanical testing ... 39
5. Conclusions ... 43
6. Future work ... 44
1. Introduction
Access to energy is crucial for modern societies to function sustainably and nuclear power has for a long time been considered as a reliable source of energy. However, the majority of nuclear power plants in the world are reaching the end of their service lifetimes. As the need for energy grows in our modern societies, the decommissioning of these power plants is postponed. Therefore, it is crucial to verify that every component installed can withstand the added service time. With the ability to monitor the condition of components, suitable maintenance programs can be developed, and safe operations can be achieved.
Cables are among the most common components in a Nuclear power plant and are required to function during normal operation and in the event of an accident. There are several methods for cable condition monitoring. Mechanical test methods such as tensile testing is the most common, and parameters such as tensile modulus and strain at break are widely used in different evaluation programs. Tensile testing is a destructive test method using relatively large samples. This is a problem in nuclear power plants, because of the large amount of cables that have to be tested and evaluated periodically. A common non--‐destructive method is the use of an indenter, which measure the surface hardness. However, the indenter is only capable of assessing the immediate surface structure accessible; which means that for on-site testing, most measurements are limited to the cable jacketing. Though, the condition of a cable is very much governed by the condition of its internal constituents e.g. insulation material protecting the conductors. Consequently, there is a need within the nuclear industry for methodologies which can facilitate for on-site measurement for condition monitoring, while having the capability to provide non-destructive in-situ measurements of cable insulation material. Therefore, the aim of this study has been to evaluate if a portable Nuclear Magnetic resonance (NMR) sensor can be constructed for assessing cables and if the prospect exists for assessing the structure profile of a cable. To our knowledge, no portable NMR sensors has never before been constructed for evaluating cables. Construction and design of such sensor is therefore state-of the art and unique, although a tremendous engineering challenge due to the complex structure of cables. In this report we present extensive simulations made with Comsol Multiphysics, investigating two different magnet system arrangements and the radiofrequency (rf) excitation system. Simulations showed that cylindrical shell magnets around the cable provide a superior magnetic field compared to Halbach arrangements. However, both magnets provide sufficient field strengths and homogeneity, facilitating for a selective area close to the metal conductors to be measured. These simulations studies have been crucial for the development of a state-of the art working prototype of the portable NMR sensor, which has been named prototype N1.
The prototype has been evaluated by testing on a range of different cables, supplied by Forsmark AB and Ringhals AB. Results indicate that the prototype has the capability to measure the insulation material of unshielded cables (no steel armor surrounding the cable). Although evaluating cables with a shielding is far more a challenge, as the shielding material strongly suppresses the magnetic field and reduces the chance of recording any NMR signal. Additionally, Transverse relaxation times, T2, measured by the prototype were compared to
mechanical parameters such as strain at break, Youngs modulus and indenter modulus. Results show that T2, correlates to an extent with mechanical parameters. we therefore believe that the
constructed NMR prototype (N1) can be a possible complementing method for investigating material deterioration in cables.
2.
NMR
theory
In NMR spectroscopy, nuclear spin is a fundamental property that is used to acquire information about the system under investigation. In 1924, Pauli proposed the existence of nuclear spins [1], which are quantized and can have the following magnitudes:
I = 0,1 / 2,1, 3 / 2, 2,...
Assuming that a nucleus lies in a magnetic field, the nucleus will have the ability to adopt (2I+1) orientations. The different orientations are represented by the magnetic quantum number, m. When protons and neutrons adopt the orientation I = ½, they can take two spin states, which in a magnetic field are separated from each other by an energy difference ∆E. The nucleus has the ability to jump between states if it absorbs or emits electromagnetic energy at a frequency that fulfils the resonance conditions. When a nucleus is in an equilibrium state, no radiation is emitted. To acquire a signal, radiofrequency (rf) pulses are applied to push the system from its equilibrium state. The pulses employed in NMR consist of short, intense monochromatic radiofrequency radiation, and when a suitable transmitter frequency ωrf close to the resonance
frequency ω0 is applied, the nuclei will sense only a magnetic field B1. Therefore, the
magnetization will then precess around B1. Consequently, the pulse will change the direction
of the magnetization. If the precession frequency is ω1, and the RF field is applied during a time
tp, then the angle (β) by which the magnetization has been rotated is as follows:
β = ωt or β = γ B1tp
where β is called the flip angle of the pulse. The most common pulses used are the 90° (π/2) and the 180° (π) pulses, which turn the magnetization by the angle indicated by the name. A 180° pulse will invert the magnetization opposite to its equilibrium state. After the 180° pulse, the magnetization will return to its equilibrium position by a process called longitudinal
relaxation (T1). A 90 ° pulse will invert the magnetization in the xy-plane, and its return to its
equilibrium position will be called transverse relaxation (T2). The NMR signal can be detected
via the voltage generated over the receiver coil in which the magnetization precesses. Measuring transverse relaxation time
Another common pulse sequence for measuring T2 is the Carr-Purcell-Meiboom-Gill (CPMG)
pulse sequence [2]. The CPMG sequence consists of a spin-echo sequence followed by a series of 180 ° pulses: 90°x-τ-180°y-2τ-180°y-2τ… The first part of the experiment is similar to the spin-echo. The delay time 2τ after the 180°y pulse can be divided into two parts: during the first
delay time, τ, a spin echo is created, and during the second τ period, the spins are dephased. This process is repeated several times, and every 180°y pulse creates a spin-echo that will appear
at half the interval between the 180°y pulses.
Low and high field NMR.
Portable NMR has a great advantage over stationary or high-field NMR, as it enables in-situ analysis and allows the user to study non-removable objects. The magnetic field of a stationary NMR is a so-called “inward field”, where the sample is placed inside the detector, which limits
the sample size to be studied. In a portable NMR, the magnetic field is an “outward field”, which makes it possible to place samples outside the sensor. The detection area or the sensitive volume/spot can be 1–20 mm outside of the detector surface, which means that the analysis is not limited to the surface of the object.
A high-field NMR can have magnetic field strengths in the range of 16–18 T, while the portable NMR is limited to 0.5 T. Consequently, the low magnetic field strength will limit the resolution of the portable NMR, which prevents chemical shifts from being distinguished. This limitation restricts the utility of portable NMR for identifying different compounds. On the other hand, the content of a substance containing hydrogen can be detected by measuring relaxation times, which has proven to be useful for various applications, e.g., measuring the moisture content in wood panels and claddings [3].
The NMR MOUSE
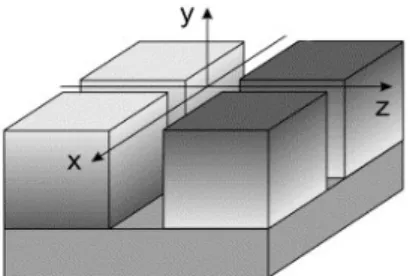
The NMR-MOUSE is a small stray-field sensor with a U-shaped geometry. Magnet blocks with anti-parallel polarization are arranged on steel support [4] (Figs. 1-2) to create a magnetic field layer, B0, which is parallel to the surface (sensitive volume). A radio frequency (rf) coil is built
inside the magnet, in the gaps between magnet blocks, which generates an anti-parallel magnetic field, B1. This magnetic field will be responsible for the excitation of the 1H protons
to acquire the NMR signal. Due to the unilateral design of the device, low and inhomogeneous magnetic fields will be employed whose different volume elements in the sample will complicate measurement by the direct impulse response (Free Induction Decay), as it vanishes too rapidly after undergoing rf excitation [5]. Therefore, the signal must be recorded as quickly as possible after applying an rf excitation pulse. Rapid recording can be achieved by using echo techniques, CPMG, to recover the NMR signal decay [4].
Figure 1. The magnet design of the NMR-MOUSE: four permanent magnets are positioned
on a steel support. A radiofrequency (rf) coil is mounted in the gaps between the magnets to
generate the B1 rf-field and to acquire the NMR signal. The magnet is designed to generate a
flat sensitive volume above its surface [5].
Figure 2. A typical lift construction for the NMR MOUSE. The lift is used to position the sensitive volume across the sample with a precision of 10 μm. The sample to be investigated is placed on top of plate A, which is parallel to the movable plate B, where the sensor is installed. By this approach, the surface of an object can be precisely aligned with the flat sensitive slice [6].
NMR is a strong and versatile characterization technique that can identify different molecular environments and, in conjunction with relaxation, be utilized to study molecular motions on the NMR time scale of kHz to MHz. In cases of rubber ageing, processes occur that change the molecular environment and the molecular motions of the polymer chains, attributed to increased crosslinking, chain scission or the occurrence of degradation products. These molecular changes can be easily detected by low-field NMR equipment, such as the NMR-MOUSE [7,8]. Information about the molecular motions can be acquired from the transverse (spin-spin). However, the NMR-MOUSE has a lower signal-to-noise ratio than high-field NMR sensors (due to the low field strength of the MOUSE), which makes it impossible to detect a 13C signal,
as the noise is too high. This limitation will prevent the MOUSE from yielding a chemical spectrum. However, it is well suited to measuring relaxation, since 1H protons are almost 100
% abundant and have a comparatively high gyromagnetic ratio, which will therefore strongly improve the signal-to-noise ratio. With the NMR-MOUSE, the 1H signal can be recorded using
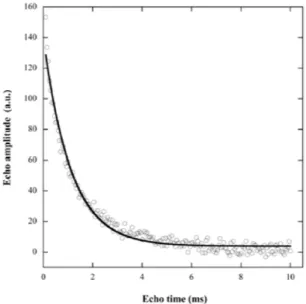
the Carr-Purcell-Meiboom-Gill (CPMG) pulse sequence [9], and the decay curve obtained can be assessed by Levenberg-Marquardt fitting:
A(t)=A1*exp(-t/T21)+A2*exp(-t/T22)
where A(t) represents the signal intensity at the echo time t, A is the signal at time zero and T22
is the transverse relaxation time relating to the relatively rigid polymer matrix and T21 takes
into account the contributions from a slower relaxation process due to mobile additives. Figure 3 shows a CPMG decay curve for a EPDM sample which has been fitted with a single exponential function.
3. Computer simulation study
We have performed extensive simulations within Comsol Multiphysics to evaluate the expected performance of NMR experiments for assessing the state of polymeric material components in cables. In all simulations we assumed that the cable is physically accessible from all sides but remain intact during the tests. We also assumed that the most desirable place to get NMR information from is the central part of the cables where the polymeric material is adjacent to the metallic wires/conductor. The goal of the simulations was if it is possible to get selective information from the central area in the cables in the vicinity of the wires.
The simulations are grouped in two broad classes. First, we simulated the static magnetic field and its distribution that can be achieved after having arranged magnets of various geometries around the cable. The important parameters were the strength (favourable: as high as possible close to the metal filaments) and homogeneity (favourable: a profile that is selective for the area close to the metal filaments).
The second group of simulations assessed the penetration and distribution of radiofrequency (rf) fields in the cables from rf coils surrounding a short-selected cable section. We simulated multifilament cables and simulation results for representative geometries.
Evaluation of the main physical properties for the given cable samples
Different types of cables were provided by Ringhals AB for the simulation studies, which are described below (type 1-4).
Type 1
Cable labels: MCEC EUPEN ERR 4x2.5+2,5 mm2 1000 V
Cable sizes: External D= 18 mm, diameter of the core part – 11.5 mm Number of the core: 5 cores
Core sizes: d= 1,9 mm; solid pure copper wire
Type 2
Cable labels: NEXANS 279 100975592 06 2004 1PTB 1mm2, CU EDF-SEPTEN N6 0.3/0.5kV
Cable size: external D= 10.5 mm, diameter of the core part – 7.2 mm Number of the core: 2 cores
Core sizes: d= 2 mm; multifilamental wire, pure copper Shielding: Yes, made from the multifilamental wire
Type 3
Cable labels: ALCATEL CABLE 205 COAXIAL KABEL, 75 Ohms, LOCA + IEC 332/3A-1193
Cable sizes: External D= 14 mm, diameter of the core part – 4.5 mm Number of the core: 1 core
Core sizes: d= 0.5 mm; solid pure copper wire Shielding: Yes, made from the multifilamental wire
Type 4
Cable labels: ALCATEL CABLE 205 LOT C06249 04 1996 3x35mm2 HN 33-S-25
Cable sizes: External D= 30 mm, diameter of the core part – 24 mm Number of the core: 3 cores x 7 wires
Core sizes: d= 7.5 mm; 7 x 2.5 mm solid pure copper wires
Shielding: Yes, 2 metallic layer with 0.1mm thickness; metal material is slightly magnetic
3.1 Calculation of the static magnetic field profiles
Our current ex-situ NMR system (NMR Mouse) has been presented extensively in the literature [4]. It is capable to record NMR signal in thin (typically, 100–200 micrometres) slices at a maximum distance of ca 1 cm from the flat instrument surface. Hence, it is not suitable for recording NMR signal in cables on the desired manner with specific information form the core. The cable testing system we settled for must use magnetic fields that arise from ferromagnetic materials that surround – as completely as possible – the cables in a cylindrical shell shape (see Figure 4).
The cylindrical shell shape has two advantages as compared to the NMR Mouse system. First, it provides a higher magnetic field within the cable volume. This increases sensitivity. Second, its symmetry allows one to have magnetic fields with a cylindrical symmetry. This allows one to selectively test the inner core of the cables.
Cylindrical material arrangement can be produced on the essentially different manner. One is based on compact cylindrical shell magnetized along the axis. Such magnets can be purchased; Figure 4, presents test pieces bought from commercially available sources.
Figure 4 example of a commercial cylindrical magnet
A practical cable testing system requires the magnets bought to be halved along the axis so that the resulting two half-cylinders can be closed upon the tested cable. This is a challenge as the purchased magnetic alloys are very hard and may loose magnetization upon heating when being cut. In addition, mechanical arrangements (clamps) are going to be required to keep the two resulting halves together (when halved, the pieces will repulse each other).
The other way of having a cylindrical material arrangement is to have bar magnets arranged in the so-called Halbach geometry. This arrangement is more flexible as it uses bar magnets that can be purchased in a great variety. Our simulation used material parameters as for commonly available bar magnets. In the Halbach arrangement, the magnetic fields from the individual bars are in part cancelling each other. Hence, Hallbach arrangements provide inherently weaker fields.
One essential difference between the two magnetic arrangements is that the direction of the static magnetic fields created by them is different. In the compact cylindrical shell case, the field is parallel to the cable axis while in the Halbach case the field is perpendicular. Radiofrequency excitation (and detection) in NMR spectroscopy demands that static and radiofrequency fields are perpendicular to each other. For this reason, the preferred radiofrequency designs are radically different for those two cases; namely, in the first case one must use so-called saddle coils while in the second case calls for solenoids. Solenoids are inherently more sensitive, and this point makes the analysis of the relative advantages/disadvantages of the two designs rather complex.
Cylindrical ring magnet design.
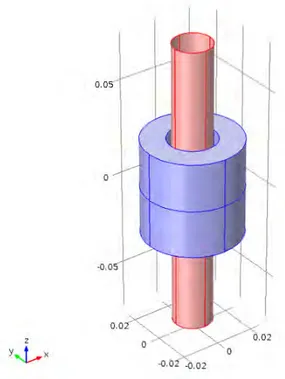
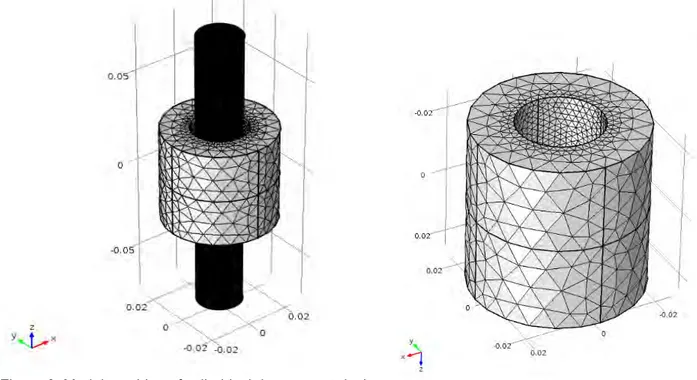
In this section simulations are shown for evaluating the magnetic field profiles in the presence of an electric cable with and without magnetized shielding. The following model geometry was investigated, see Figure 5. The chosen geometry corresponds to the commercially available Niobium ring magnets purchased for the real experiments (See Figure 4). The simulated cables are the types 1–4 mentioned earlier.
Figure 5. Model geometry investigated, red cylinder illustrates a cable and the surrounding cylinder a Niobium ring magnet.
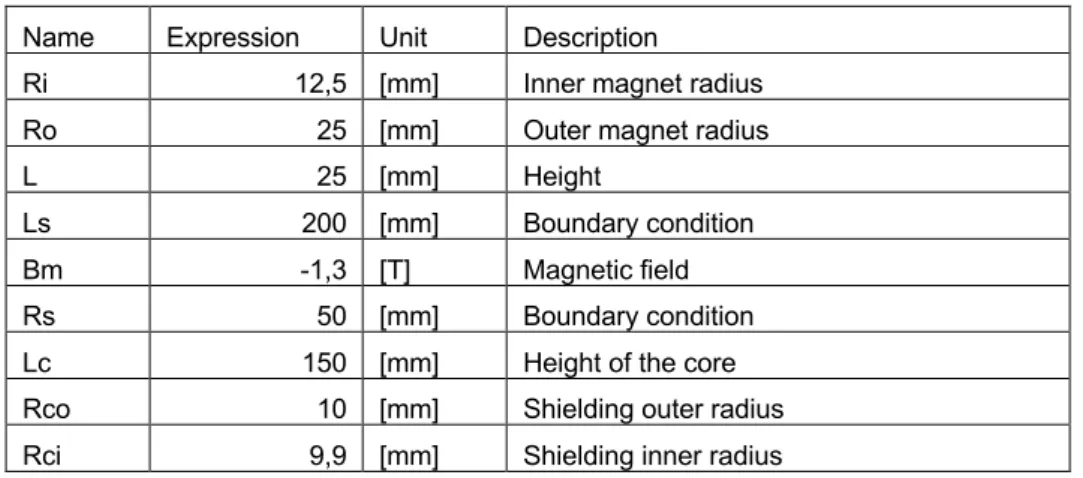
Simulation were conducted based on the following constants:
Table 1. Simulation constants for the cylindrical ring magnet design.
Name Expression Unit Description
Ri 12,5 [mm] Inner magnet radius
Ro 25 [mm] Outer magnet radius
L 25 [mm] Height
Ls 200 [mm] Boundary condition
Bm -1,3 [T] Magnetic field
Rs 50 [mm] Boundary condition
Lc 150 [mm] Height of the core
Rco 10 [mm] Shielding outer radius
Figure 6 shows an illustration of a model meshing for a cylindrical ring magnet design.
Figure 6. Model meshing of cylindrical ring magnet design
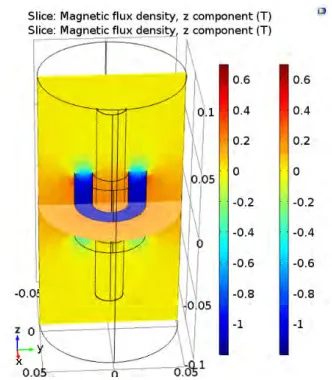
As previously mentioned, in the compact cylindrical shell case, the field is parallel to the cable axis. Figure 7 shows the 3D plot of magnetic flux density Bz, which can be seen to be highest
in the center region of the magnet (see the color comparison bar). The magnetic flux density is reduced as we move from the center region of the ring, in either direction (center region is the middle point inside the void of the cylinder). The cable shielding for this simulation is made from nonmagnetic material.
Figure 7. 3D plot of the magnetic flux density Bz for a compact cylindrical shell case covering a cable containing non-magnetic cable shielding.
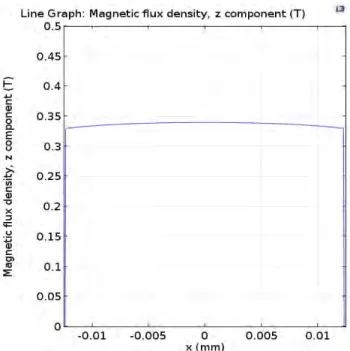
The high intensity of the magnetic field strength in the centre region of the cylinder magnet is also evident from the 1D plot of the of magnetic flux density, Bz distribution across the ring at
the longitudinal mid-point (z = 0), see Figure 8. As can be observed the flux density is stable in the middle-point of the magnet.
Figure 8. 1D plot, Bz distribution across the ring at the longitudinal mid-point (z=0):
Figure 9 shows a 1D plot, of the magnetic flux density Bz distribution along the ring at the axis
(x,y = 0), as we move though the cylindrical magnet in the z-coordinate direction (cf. Figure 7), the magnetic flux density is reduce when we move from the center region of the magnet in both directions.
In our previous example shown in Figure 7, the shielding material simulated was non-magnetic. However, many different types of cables contain magnetic-shielding material. In Figure 10, the 3D plot of the magnetic flux density Bz for a cylindrical magnet surrounding a cable is
presented. The cable shielding is made from the magnetic material with ferromagnetic susceptibility μ = 400. As expected, the ferromagnetic shielding material affects the magnetic field strengths considerably (cf. Figure 7 and 10).
Figure 10. 3D plot of the magnetic flux density Bz for a compact cylindrical shell case covering a cable containing magnetic cable shielding.
According to the results of the computer simulations, cylindrical ring magnet provides a reasonably good field homogeneity in the central cable region. The presence of the nonmagnetic (µ=0) shielding does not affect the magnetic field profile, while for a magnetic (µ=400) shielding the flux is decreased by a factor 1.5. In the non-shielded case, the obtained magnetic field strength (for the central region) corresponds to 14.5 MHz, which is comparable to the NMR frequency for the 1H nuclei. This value is at the high end for portable ex-situ NMR
devices.
For both shielded and unshielded cables (e.g. Type 1 and 2) the core region will attain sufficiently distinct field (within ca 1–2 % of the top value, corresponding to NMR frequency that is more than 100 kHz different from that for the other regions of the cable) so that it can be excited and detected a NMR signal in a selective manner. To realize this potential, the radiofrequency design (rf-coils) must be optimized, too (see section 3.2).
Halbach NMR Mandhalas magnet-design.
NMR Mandhalas (Magnetic Arrangement for Novel Discrete Halbach Layout) are arrays of identically shaped magnets in a Halbach-type arrangement (See Figure 11). They provide a simple and cost-effective way to generate high magnetic fields for mobile NMR applications. The computer model of NMR Mandhalas design with 16 identically shaped rectangular pieces was chosen for simulation. Such pieces are widely available for purchase. Figure 16 shows the model geometry of the NMR Mandhalas design investigated.
Figure 11. Model geometry of an NMR Mandhalas design with 16 identically shaped rectangular pieces.
Table 2 shows the model constants used for modelling the NMR Mandhalas in a Halbach-type arrangement.
Table 2. Model constants used for modelling the NMR Mandhalas design.
Name Expression Unit Description
Li 12 [mm] Element Size
Rm 40 [mm] Radius of the element circles
L 50 [mm] Height
alpha 11,25 [deg] Angle for every elements
Ls 200 [mm] Boundary size
Bm 0,7 [T] Magnetic field
Lc 150 [mm] Lengt of the core
Rco 20 [mm] Shielding outer radius
Figure 12 shows an illustration of a model meshing for a Halbach ring magnet design.
Figure 12. Model mesh of the NMR Mandhalas in a Halbach-type arrangement.
Figure 13 shows the 3D plot of the magnetic flux density, y components. the cable shielding is made from the nonmagnetic material. As previously mentioned, in Halbach magnets, the field flows perpendicular to the cable axis. As can be seen, the magnetic field strengths are greater closer to the magnets and are reduced as we move towards the center region.
Figure 14 shows a 1D plot of the magnetic flux distribution By across the cable at the
longitudinal mid-point (z = 0). The magnetic flux is greater at the edges (location of the magnet) and is reduced as we move towards the center. Another differentiation between the cylindrical shaped magnet and the Halbach design, is the generated field strengths (cf. Figure 8 and 14, magnetic flux densities), were the later showed a simulated field strength of ca. 0.33T.
Figure 14. 1D plot of the magnetic flux distribution By, at the longitudinal mid-point of a cable-.
Figure 15, shows the 1D plot, By distribution along the cable at the axis (x,y = 0). Unlike the
cylindrical shaped magnet, the magnetic field homogeneity is far greater for the Halbach design (cf. Figure 9 and 15).
Figure 15. 1D plot of the magnetic flux distribution By, at the longitudinal mid-point of a cable ( z = 0), as we move in either direction (up or down) along the cable, the magnetic flux density will be reduced.
Figure 16a shows the 3D plot of the magnetic flux density, By for a cable containing a magnetic
shielding material with µ=400. Figure 16b shows the 1D plot for the corresponding simulation. As can be observed, the magnetic flux density is severely reduced when moving from the magnet surface to the center region, were the flux density is reduced to ca. 0.04 T; this can be compared to 0.12 T for a cable containing a non-magnetic shielding material (Cf. Figure 14 and 16b).
Figure 16 A) 3D plot of the magnetic flux density, By components, shielding in this case is a magnetic material with µ=400. B) 1D plot of the magnetic flux distribution By, at the longitudinal mid-point of a cable ( z = 0),
The Halbach design provides reasonable field homogeneity; in this simulation we explored a much wider cable – hence, the average field is much lower. Still, for a 4 cm wide cable we can get ca 5 MHz NMR frequency for the 1H nuclei which permits suitable experiments to be
performed. The presence of the magnetic (µ=400) shielding severely decreases the magnetic flux; hence, the Halbach design is not suitable for wide cables with such shielding. The assembled Halbach set can be easily split into 2 pieces to enclose and test the electric cable as intended.
The cylindrical shell magnet is superior over the Halbach magnet as it provides a higher magnetic field. Still, at least for non-shielded cables, the Halbach magnet is a reasonable alternative. For both magnet systems, it seems to be possible to explore the field profile and get information for the inner core of the cables on a selective manner. The Halbach design is the only option currently available for wide (>2.5 cm wide) cables since ring magnets with a larger hole are not commercially available. The Halbach magnet is also the option that is easier to construct. The ring magnets require to be cut and we do not know yet if that is possible with their quality retained. An alternative is custom production of half-rings. In summary, both magnet designs are suitable for the current project.
3.2 Calculation of the radiofrequency field profiles
Low-field NMR sensors are commonly made of a permanent magnet (e.g. circular or Halbach magnet), which generate a magnetic field. In order to achieve excitation and measuring an NMR signal, radiofrequency (rf) coils can be incorporated together with these magnets. Similar to a magnet which generates magnetic fields, radio frequency coils (rf) can be used to induce a current through the coil design to generate a magnetic field. The direction of this magnetic field is opposite to the field of the permanent magnet. In simple terms this environment will excite
1H in the material, when the current through the rf-coil is turned off, 1H in the material will
relax back to their equilibrium state. This relaxation can be categorized as T1 and T2 (see the
NMR theory section). In this section we present simulations for two types of radiofrequency (rf) coils: saddle and solenoid shaped rf coils. The aim of these simulations is to evaluate the radiofrequency field profile in the presence of a cable with different types of shielding. In order to minimize the number of governing parameters, a simpler scenario was chosen. A single turn saddle shape coil configuration with the electric cable Type 1 (see Section 3.1) was chosen for the computer modelling.
Model constants used for the simulations are presented in table 3.
Table 3. Model constants used of the single turn saddle shape coil configuration
Name Expression Unit Description
w_h 0,002 [m] Width of flat wire
w_t 0,001 [m] Thickness of flat wire
h1 0,03 [m] Length of the coil
r 0,01 [m] Coil radius
al 120 [deg] Saddle angle
s 5 [deg] Segment angle
rs 100 [mm] Boundary condition
rc 25 [mm] Outer shielding (not used)
hc 25 [mm] Height of the shielding (not used)
rcore 0,8 [mm] Radius of th core wire
tcore 0,1 [mm] Thickness of the shielding
rw 3,5 [mm] Radius of the pentagon
hcore1 80 [mm] Length of the cable
F0 10 [MHz] NMR frequency
C 100 [pf] Capacitor connected to the lumped port
Figure 18 shows the model meshing for a single turn saddle shape coil configuration.
In order to get an understanding of the contributions from the copper wiring on the magnetic flux, series of simulations were made to compare cases of type 1 cables with and without wiring. The goal of this project is to develop an NMR sensor which has the ability to measure polymeric components adjacent to the wiring . Therefore, acquiring a higher radio-frequency profile (flux) close to the cable proximity will enable us to get more signal from the polymers surrounding those cables. Figure 19 shows the 3D plot and the radial slice projection of the magnetic flux density norm for a type 1 cable with no conductive cable core inside. As can be observed from the radial slice projection, the magnetic flux is rather homogenous throughout the cable slice.
Figure 19. 3D plot and radial slice projection of the magnetic flux density norm for a type 1 cable without cable cores inside.
Figure 20 shows the 3D plot and the radial slice projection of the magnetic flux density norm for a type 1 cable containing 5 copper wires. The radial slice projections demonstrate a more non-homogenous magnetic flux distribution throughout the cable and much greater field profile closer to the copper wiring. This will be of great importance for acquiring an NMR signal of those polymers in the proximity of the copper wiring.
Figure 20. 3D plot over the magnetic flux density norm f or a type 1 cable with 5 cable cores inside.
The effects from cable shielding materials (similar to the shielding used in type 4 cables) on the magnetic flux can be observed in Figure 21. The magnetic shielding material completely reduced the magnetic field strength through the material and prevents any chances for NMR measurements.
Figure 21. 3D plot over the magnetic flux density norm for a cable with a conductive shielding around
A realistic saddle-shaped radiofrequency coil provided suitable profiles in non-shielded cables with several discrete embedded wires. In fact, with suitable (that is, comparable to wire diameter) spacing between the wires, the RF field is amplified in the wire vicinity. In shielded cables, the radiofrequency field vanishes within the simulations. We do not fully understand what the cause for this discrepancy is. We think that the shielding is typically woven and, if the metal-metal contact within it is slightly resistive (for example, because of oxidized surface) the radiofrequency field leaks through. One issue that is not addressed by the current simulations is the load (and, in general, the complex impedance) the metallic parts of the cable (wires within and, if any, shielding on the outside) exert on the resonant circuit of which the radiofrequency coil is part of. This is a complex simulation problem and is probably more effective to be addressed experimentally.
Solenoid rf coil configuration
Similar for the saddle shaped rf coil configurations, a type 1 cable has been chosen for the simulation of the solenoidal coil configuration, shown in Figure 24.
Table 4. Model constants used of the solenoid coil configuration
Name Expression Unit Description
f0 10 [MHz] Larmor frequency
N 20 Number of turns
Ro 12,5 [mm] Radius of the solenoid
Rsm 0,5 [mm] Radius of the solenoid wire
D 2 [mm] Diameter of the core wire
rcore1 3 [mm] radius of the pentagon
Simulations showed that solenoid rf-coils are able to generate more homogenous profiles through a cable cross-section. Figure 25. shows the 3D plot and the radial slice projection of the magnetic flux density norm, for a electric cable with the 5 copper wires. Compared to the saddle-shaped rf-coil the magnetitic field profile is more homogenous.
Figure 26 shows the 3D plot and the radial slice projection of the magnetic flux density norm; electric cable with the 5 copper wires and the conductive shielding around. Similar to the saddle-shaped rf-coil, the magnetic flux is greatly reduced when measuring on cables containing a magnetic-shielding (type 4 cable).
Figure 24. 3D plot over the magnetic flux density norm for a type 1 cable with a conductive shielding around the cable.
Comparison of the saddle and solenoid rf-coils designs
In summary, we can conclude that the simulations are equally permissive for saddle-coil and solenoid radiofrequency coils. Keeping in mind what has been already said concerning radiofrequency and static designs and their interdependence, our final judgment is that the Halbach-solenoid pair is clearly doable, both in principle and in engineering terms. It seems to provide smaller NMR signal, boiling down to longer test times. A particular advantage of this design is that the radiofrequency field is homogeneous while the static fields are sufficiently smooth. Hence, one can have a rather accurate way of testing the inner polymeric components at specific locations within the cable. The design based on ring magnets is probably of superior performance regarding signal strength.
3.3 Assessment from simulation study
We find that the cylindrical shell magnets around the cable provide a superior magnetic field. Yet, Halbach arrangements should also work and make an alternative if cylindrical magnets cannot be produced in two halves, the latter required in real–life applications where magnets must be able to enclose specific sections of long cables. For both magnet systems, it seems to be possible to explore the field profile and get information for the inner core of the cables on a selective manner. The Halbach design is the only option currently available for wide (>2.5 cm wide) cables since ring magnets with a larger hole are not commercially available. The Halbach magnet is also the option that is easier to construct. The ring magnets require to be cut and we do not know yet if that is possible with their quality retained. An alternative is custom production of half-rings.
Another parameter to be considered is the rf strength (favourable: as high as possible close to the metal filaments). We find that (i) in unshielded cables the rf fields are high and favourably amplified nearby the wire elements in the cable core but (ii) in shielded cables the rf fields are damped to impractically low levels. Hence, our summary judgment is that in unshielded cables it is possible to make the desired NMR experiments and to be able to do them with sufficient quality is primarily an engineering challenge (that is, permitted as physical phenomenon). In shielded cables, simulations indicate that the arrangements tested should not work.
4. Construction and testing of prototype NMR sensor
4.1 Experimental
Materials
Cables were provided by Ringhals AB and Forsmark AB and information about each individual cable is presented in tables 5–6. For the cables provided by Ringhals AB (R), cable samples R11 and R12 have been excluded due to their sizes. The constructed NMR prototype sensor has a size limitation for cables that can fit within the sensor measurement space (see Figure 33). Additionally, many of the cables supplied by Ringhals and Forsmark lack information about the operational conditions e.g. if the samples have been exposed to high temperatures or radiation. All information that has been provided to us is therefore been presented in tables 5– 6.
Table 5 overview of cable samples supplied by Ringhals AB. The column contains armor, means that
the cable is surrounded by a mechanical reinforcement, typically steel.
Cable
no Type Conductor New/used cable Reactor block Jacketing material Insulation material Contains Armor (shielding)
Environment
installed Manufacturer
R1 FSFR 2x1 used R3 CSPE EPDM+ Lipalon
yes Room temp 20°C
ASEA Liljeholmen
R2 FSAR 3x1 used R3 CSPE EPDM+ Lipalon
yes Room temp 20°C
ASEA Liljeholmen
R3 ESSJ 3x2.5 used R4 CSPE EPDM+ Lipalon
no Not given ASEA Liljeholmen R4 FSFR 7x1 used R3 CSPE EPDM+
Lipalon
no Not given ASEA Liljeholmen R5 FSFR 4x1 used R4 CSPE EPDM+
Lipalon
yes Room temp 20°C
ASEA Liljeholmen
R6 FSFR 3x1 used R4 CSPE EPDM+ Lipalon
yes Not given ASEA Liljeholmen R7 FSFR 7x1 used Not
given
CSPE EPDM+ Lipalon
yes Not given ASEA Liljeholmen R8 MXS 4/C
12 AWG used Not given CSPE XLPE yes Not given ASEA Liljeholmen R9
NU-SMHXHXCHX
2x2.5 New Not given
FRNH EPR/FRNH no Not installed EUPEN
R10 RSS 3x2.5 used R3 CSPE EPDM+ Lipalon
yes Not given ASEA Liljeholmen R11 RSAR 48x1 used Not
given
CSPE EPDM+ Lipalon
yes Not given ASEA Liljeholmen R12 FSFR 2x1 New Not
Table 6 shows the information for each provided cable by Forsmark AB (F) for this project. The samples F7 and F8, which were made of Rockbestos showed no NMR signal and have therefore been excluded from the study. The samples showed a very low 1H signal, which is the
underlying reason for not getting an NMR signal.
Table 6 overview of cable samples supplied by Forsmark AB. The column contains armor, means that
the cable is surrounded by a mechanical reinforcement, typically steel.
Cable no
Type Conductor New/used
cable Reactor block Jacketing material Insulation material Contains Armor (shielding) Environment installed Manufacturer
F1 FSAR 4x1 used Not
given CSPE Lipalon yes Aged at 30°C +
LOCA tested, taken out 2016
Liljeholmen
F2 FSAR 2x1 used Not
given FRNH Lipalon yes Aged at 30°C +
LOCA tested, taken out 2016
Liljeholmen
F3 FSAR 4x2.5 used Not
given CSPE Lipalon yes Not details, taken out 2016
Liljeholmen
F4 FSAR 4x1 used Not
given
CSPE Lipalon yes Not details,
taken out 2016
Not given
F5 FSAR 4x1 used Not
given CSPE Lipalon yes Not details, taken out 2016
Not given
F6 FSAR 3x1 used Not
given
CSPE Lipalon yes Not details,
taken out 2016
Not given
F7 Rockbestos 4x1 used Not
given
CSPE Rockbestos no LOCA
tested 2018
ASEA
F8 Rockbestos 2x2.5 new Not
given CSPE Rockbestos no 20 years storage, 20°C
ASEA
F9 EKKJ 3x2.5 new Not
given
FRNH PVC yes Not installed ASEA Atom
F10 RSS 4x2.5 used Not
given FRNH Lipalon yes In operation 1985-2012, 20°C
For this study a reference sample of EPDM was chosen with known properties, to compare to the cables supplied by Ringhals and Forsmark. The chosen reference sample is an EPDM O-rings (see Figure 25) which has been previously studied by Pourmand et. al [10]. The seals contained 47 ± 1 wt.% EPDM rubber, 39 ± 1 wt.% carbon black, 5 ± 1 wt.% calcium carbonate (CaCO3). Unlike the cable specimens which contain conductors (e.g. copper) or sometimes
steel shielding. The reference sample is a pure rubber sample which yields the NMR signal from the polymer. By comparing the measured NMR signal from the cables to the reference sample, the influence of components such as conductor or shielding materials on the resulting NMR signal can be revealed. In addition to the reference sample, an aged reference sample thermally aged in air for 100 h at 170 °C has been used as a guideline to compare to the cable specimens.
Figure 25 shows the EPDM reference O-ring, which has been used for comparing to the cable samples provided by Ringhals and Forsmark.
Nuclear magnetic resonance (NMR) spectroscopy
The construction and design outlines of the prototype are presented in results and discussions. The portable NMR sensor was connected to BRUKER AVANCE 300 console. The T/R channel frequency was set to 44.34 MHz.
The conventional Carr-Purcell-Meiboom-Gill (CPMG) experimental routine was adapted for that console to collect the echo signals after each 180-degree pulses.
The typical experimental parameter
1. Duration of 180 pulse – 5 u for 150 W of RF power 2. Delay between the consequent CPMG traces – 5 s
3. CMPG timing (between 2 subsequent 180-degree pulses) – 45 u
The typical CPMG decay for the cable R12 with 1024 repetitions is shown in Figure 26.
Figure 26. Typical CPMG decay curve for cable R1 (provided by Ringhals AB).
As cable can be constructed of different types of constituents e.g. jacketing material of chloro-sulfonated polyethylene and insulation material of Lipalon, this will strongly affect the measured signal. This is specially the case as most of these polymeric materials besides their polymer matrix contain additives that can contribute to the decay curve; some of these components can have faster decays, while others are slower. In general terms, a more rigid molecular environment will yield a faster decay (resulting in a shorter relaxation time, T2).
Pourmand et. al showed in their work that rubber samples aged and affected by crosslinking (more dense molecular structure) showed shorter T2 times, compared to unaged rubber samples
which had longer T2 times [10]. Due to the complex environment existent in cables, the
measured signal decay curve will have a multinational behavior; hereby, the numerical evaluation of the several components or inverse Laplace routine must be applied for processing.
Mechanical testing
Tensile testing
Samples from the core insulations from the cables were evaluated; samples were tested as cylindrical specimen with the conductor removed. The specimens were tested in an Instron 5566 tensile testing machine at an elongation of rate of 20 mm/min and at 23 ± 2°C and 50 RH. Four specimens from each cable sample were tested.
Indenter modulus measurements
The indenter modulus was determined by indentation at 23 ± 1 °C and 50 ± 5 % RH; using a modified Instron 5944 Universal Tensile Testing Machine, equipped with an Instron 500 N load cell and a high-precision xy-stage providing travel increments of 0.25 mm in both the x and y directions. The indenter probe was a truncated tip based on IEC/IEEE Std 62582-2-2011 (the diameter of the penetrating base circle was 0.8 mm) [11]. The force felt by the indenter probe was recorded as a function of the penetration depth: the modulus, N mm–1, was determined
from the slope of the force-penetration-depth relationship. 4 independent measurements were made for each specimen, the lowest and highest values were excluded, and the remaining values were used for the statistical evaluation.
4.2 Results and discussions
This project has previously been divided in two phases (i) focusing on simulations of possible designs (ii) construction of a prototype based on designs regarded feasible from previous simulations. We also assumed that the most desirable place to get NMR information from is the primary insulation material next to the conducting wire (see Figure 28, primary insulation material). This is of great interest as to our knowledge there are no portable and non-destructive methods facilitating in-situ measurements of cables. Classical methods like the indenters can measure the jacket insulation on-site, and the cable is required to be taken out of service in order to assess the primary insulation material.
The simulations are grouped in two broad classes. First, we simulated the static magnetic field and its distribution that can be achieved after having arranged magnets of various geometries around the cable. The important parameters were the strength (favourable: as high as possible close to the conducting wire) and homogeneity (favourable: a profile that is selective for the area close to the metal conductor). We found that the Halbach magnet configuration around the cable provided a sufficient magnetic field strength. Additionally, the Halbach magnet array can be engineered in such ways to be opened up and closed with the help of clamps (See Figure 27). This makes it possible to engineer magnets for cables of different sizes.
Figure 27. schematic of how a Halbach array can be halfed
The second group of simulations assessed the penetration and distribution of radiofrequency (rf) fields in the cables from rf coils surrounding a short-selected cable section. The important parameter was the rf strength, preferably as high as possible close to the metal conductor, facilitating the recording of a signal from the primary insulation material. We found from our simulations that in an unshielded cable the rf field profiles are high and favourably amplified nearby the wire elements in the cable core. Another aspect to take into consideration is the cable shielding. Many cables contain a steel shielding (see Figure 28) to provide for mechanical integrity in the cable. Our simulations showed that for shielded cables, the rf fields are damped to impractically low levels, which prohibits any chances to record an NMR signal.
NMR measurements by the commercial Magritek NMR mouse assembly
Cables were first evaluated with the commercially available Magritek NMR MOUSE [10]. Fig. 5 shows the results for cable R9 from Ringhals: NU-SmHXHXCHX from EUPEN; 2x2.5 FRNH Crosslink
500 repetitions; quite bad signal-to-noise ratio, very short T2
Figure 29. Experimental results shown for cable R9, evaluated with the Magritek NMR MOUSE. Right curve (red) shows the decay curve that is very short and scattered.
The reference rubber sample was evaluated, 500 repetitions; Results are shown in Fig. 6.
Figure 30. The EPDM reference sample show suitable signal-to noise ratios and a much more uniform decay curve which generates a larger T2, cf. the decay curves in Figure 29 and 30.
Conclusions:
1. NMR signal from the given cable samples is quite small vs the EPDM rubber sample. T2 for sample R12 is ca. 0.5 ms and the reference EPDM sample 1.5 ms, which is 3
times greater.
2. Very short T2 values are expected for cables.
3. Hereby, the designed portable NMR sensor should obey the following requirements: − Strong magnetic field with the good homogeneity to provide superior NMR signal − High efficiency of the radiofrequency system to provide as short duration of
excitation pulses as possible (to measure cables with short T2 values) and benefits
the higher signal – to-noise ratio.
The prototype N1; design and construction
In accordance to the preliminary experimental results and the numerical calculations the following arrangement were chosen. The magnet system: Halbach NMR magnet design
The radiofrequency system: Solenoidal coil configuration
Figure 32. The solenoidal coil configuration for the N1 prototype.
Thus, the Prototype N1 contains the following components: 1. High strength circular magnet Halbach Array
2. Transmitting/Receiving RF coil
3. The matching electronic circuit assembled in shielded case 4. Teflon case
5. Non-magnetic aluminum stands
2
3
5
1
4
The following sections 1-3, give an overview of each component used for the prototype. 1. The circular Halbach magnet array
The following reasons to choose that type of Halbach magnet array were taken into account: 1. The compact size and low weight
2. High magnetic field strength (>10000 Gauss, hereby, more NMR signal vs. the 2 present Magritec designs)
3. Acceptable magnetic field homogeneity
4. Made from the separate arc segment. Thus, the openable cable clamping upgrade (to be open at the on the low field axis) is potentially possible
2. Transmitting/Receiving RF coil
Several variants of the RF coil were tested (N1 and N2 are shown below; N3 is currently installed in the ready prototype shown in Figure 33).
1
2
Figure 35. Several variants of RF-coils were constructed and tests during the evaluation process. Type 1 and 2 were among the first designs used for the tests.
N1 has a wide excitation range vs. N2 and N3. Both N1 and N2 are winded on custom designed Teflon tube support; N3 is winded on glass tube assembly. As it was found, the Teflon tube provides the short but noticeable background signal. To avoid misinterpretation with the actual signal from the cable (which, unfortunately, has the comparable T2), the N3 design is exploited
in the present construction.
3. The RF matching electronic circuit assembled in shielded case
This circuit is custom designed and contains high voltage non-magnetic Voltronic trimmer capacitors (matching and tuning handles; manually adjustable).
Experimental results
Figure 26 shows the CPMG decay curve for cable samples provided by Ringhals AB. Cable samples denoted R6 demonstrate a faster decay (yielding a smaller T2 time), while the curve
for sample R9 decays much slower (resulting in a larger T2).
R9
R6
Figure 36. Shows the decay curve for selected cables from Ringhals, which was evaluated by the N1 NMR sensor.
Decay curves, as shown in Figure 36, were evaluated by fitting data according to the Levenberg-Marquardt method: ) � = �!�(%#!" $) + �'�(%#!! $
The method yields two transverse relaxation times T21 and T22. As previously mentioned, NMR
is a strong and versatile characterization technique that can identify different molecular environments and, in conjunction with relaxation, be utilized to study molecular motions. In cases of rubber ageing, processes occur that change the molecular environment and the molecular motions of the polymer chains, attributed to increased crosslinking, chain scission or the occurrence of degradation products. These changes in the molecular environment can be substantial and cause the material to become rigid. Pourmand et. al. [10] have shown in their previous research on highly filled EPDM rubber specimen, that unaged rubber specimen has greater T2 times compared to samples that were aged. In our assessment, T22, is the transverse
relaxation time relating to the relatively rigid polymer matrix and T21 is the relaxation times
which takes into account the contributions from a slower relaxation process due to mobile additives [10,12].
Tables 7–8 show the measured relaxation times for cables provided by Ringhals and Forsmark. As mentioned earlier, the shorter relaxation times T21, are considered to take into account the
contributions from a slower relaxation process due to mobile additives. T21 is fairly constant
for most of the measured samples, see tables 7–8. The longer relaxation times T22, assigned to
the polymer matrix varies for each sample and is far greater compared to T21. Form our
preliminary measurements with the Magritek NMR MOUSE assembly, we realized that the relaxation times for cables would be far smaller in comparison to rubber samples such as the reference EPDM sample. This can also be realized when comparing the relaxation times for the cables from Ringhals and Forsmark with the EPDM reference sample (see Tables 7–8). The complex design structure of cables involving conductors, insulators and filler material strongly affects the possibilities to acquire a strong NMR signal (yielding in shorter T2 times). This
effect is even more evident when comparing our results to the EPDM reference sample which has been aged at 170 °C; the aged specimen has a far shorter T2 compared to the unaged
reference sample (compare the data for the unaged and aged samples). Despite the effects from ageing, the aged reference sample has far greater relaxation times compared to the ones measured for the cables (T22 = 0.77 ms and 0.12 ms for sample R6). As the measured relaxation
times are small, we will use the sum of each contribution Ttotal for our discussions further (Ttotal
= T21 + T22).
Table 7. Measured relaxation times (T2) for cable samples provided by Ringhals. Samples R10 and
R11 could not be measured with the NMR prototype due to size limitations.
Sample T21 (ms) T22 (ms) Ttotal (ms)
Reference sample
(unaged) 0.23 1.24 1.47
Reference sample aged
(170 °C, 100h) 0.16 0.77 0.93 R1 0.02 0.11 0.13 R2 0.02 0.10 0.12 R3 0.02 0.28 0.30 R4 0.02 0.40 0.42 R5 0.02 0.39 0.41 R6 0.02 0.10 0.12 R7 0.02 0.09 0.11 R8 0.02 0.18 0.20 R9 0.02 0.58 0.60 R12 0.02 0.48 0.50
The samples F7 and F8, which were made of Rockbestos showed no NMR signal and have therefore been excluded from the study, samples showed a very low 1H signal. Additionally,
the majority of the cable samples provided by Forsmark contained a steel shielding, which strongly supresses the measured NMR signal, resulting in much lower T2 values compared to
Table 8. Measured relaxation times (T2) for cable samples provided by Forsmark.
Sample T21 (ms) T22 (ms) Ttotal (ms)
Reference sample
(unaged) 0.23 1.24 1.47
Reference sample aged
(170 °C, 100h) 0.16 0.77 0.93 F1 0.01 0.08 0.09 F2 0.01 0.08 0.09 F3 0.01 0.14 0.15 F4 0.02 0.1 0.12 F5 0.02 0.11 0.13
F7 no signal no signal no signal
F8 no signal no signal no signal
F9 0.02 0.15 0.17
F10 0.02 0.08 0.1
Mechanical testing
As previously mentioned, tensile testing is among the most standardized test methods for evaluating polymeric materials in nuclear power plants. In this project tensile testing was performed on various cable insulations (see Figure 37). The plot shows how the total transverse relaxation, T2 total, (sum of T21 and T22) varies with the strain at break. For the reference samples
of EPDM (Ref. unaged and aged), the unaged sample shows great elasticity and has a long relaxation time. For the aged sample, the effect of ageing and increased crosslinking causes the material to become more brittle, which is evident in the reduce strain at break. This can also be seen in the shorter relaxation times.
Observed from Figure 37, samples R9 and R12, which were unaged show much higher strain at break and longer relaxation times compared to the rest of the samples that were in operation (R1–R8). In general, all measured cable samples show shorter relaxation times, this owes to the complex design structure of cables; constituting of conductors, insulators and filler material which can strongly affects the possibilities to acquire a strong NMR signal (yielding in shorter T2 times).
Figure 37. The plot shows how the total transverse relaxation, T2 total, (sum of T21 and T22) varies with the strain at break for cable insulation material.
Figure 38 shows how the total transvers relaxation times vary relative to the Young’s modulus (MPa). For the reference specimen the relaxation times become shorter as the material is aged (Cf. Ref aged and unaged). This effect can also be seen in the modulus (MPa), as the material is aged the elasticity is severely reduced. For the samples R9 and R12, which are unaged, we can see that the modulus is in the same ranges as the reference specimens (10–60 MPa). However, the relaxation times are much shorter which we can attribute to shielding effects from conductors in the cables. Samples R1-R8 show great increase in the modulus and the relaxation times are shorter for these samples. These results clearly show that there is a correlation between the mechanical results and the relaxation times.
Figure 38. Total relaxation times, T 2total, as a function of Young’s modulus (MPa) for selected cables insulations from Ringhals.
Figure 39 shows how the total transverse relaxation, T2 total varies with the strain at break for
cables provided by Forsmark. Samples provided by Forsmark had a higher degree of shielding material in the cable e.g. solid aluminum. This clearly affected the NMR signal from the inner parts of the cables, which can be seen in the recorded T2 times for samples F3–F6. These results
can be compared to the relaxation times recorded for the samples provided by Ringhals (see Figure 38), Samples from Ringhals contained a less degree of shielding material and which results in a much stronger recorded NMR signal (recorded T2 is higher).
Figure 39. The plot shows how the total transverse relaxation, T2 total, (sum of T21 and T22) varies with the strain at break.