SKI Report 2005:41
Research
Models for Fuel Rod Behaviour at
High Burnup
Lars O. Jernkvist
Ali R. Massih
December 2004
Background
During recent years a considerable amount of work has been performed on studying the behaviour of nuclear fuel at high burnup and to model it in computer codes. SKI has previously performed an evaluation of FRAPCON (SKI Report 02.29). The evaluation confirms the applicability of
FRAPCON to high burnup fuel rods, but also reveals weaknesses in the models for pellet thermal conductivity, clad oxidation, creep, plasticity and irradiation-induced growth.
Results and continued work
In this project the capability of the FRAPCON computer code to simulate fuel rod performance at high burnup is studied. Theoretical assessments of important models for fuel rod performance at high burnup are made. Different models are compared and evaluated against measured data. New models are also formulated for use within the FRAPCON code.
This project has contributed to the research goal of providing a basis for SKI:s supervision by means of illustrating the problems of modelling nuclear fuel behaviour. More precisely it has developed competence concerning the licensing of fuel at high burnup, which is an important safety issue. The results are useful as such, but also are the basis for modifications to FRAPCON in a following project.
Project information
Responsible for the project at SKI has been Jan In de Betou. SKI-referens: 14.06-030848
SKI Report 2005:41
Research
Models for Fuel Rod Behaviour at
High Burnup
Lars O. Jernkvist
Ali R. Massih
Quantum Technologies AB
Uppsala Science Park
SE-751 83 Uppsala
Sweden
December 2004
This report concerns a study which has been conducted for the Swedish Nuclear Power Inspectorate (SKI). The conclusions and viewpoints presented in the report are
List of contents
Summary... III Sammanfattning... IV
1 Introduction ... 1
2 Models for uranium dioxide fuel behaviour... 3
2.1 Formation of high-burnup microstructure ... 3
2.1.1 Background... 3
2.1.2 Threshold for material restructuring... 4
2.1.3 Porosity in restructured material... 9
2.1.4 Athermal fission gas release from restructured material ... 13
2.2 Thermal fission gas release ... 15
2.2.1 Background... 15
2.2.2 Gas release model: governing equations ... 18
2.2.3 Grain growth description... 21
2.2.4 Calculation of gas release under grain growth ... 28
2.2.5 Results of sample computations ... 29
2.2.6 Analysis and discussion... 34
2.3 Thermal conductivity... 37
3 Models for zirconium alloy clad tube behaviour... 41
3.1 Clad corrosion behaviour ... 41
3.1.1 Clad oxide growth ... 41
3.1.2 Clad hydrogen pickup... 47
3.2 Clad mechanical properties ... 49
3.2.1 Yield stress ... 49
3.2.2 Rod axial growth ... 51
4 Summary and conclusions ... 55
List of appendices
Appendix A:
Assessment case for high-burnup fuel restructuring ... 67 Appendix B:
Fission gas production rate... 69 Appendix C:
Characteristic times of gas diffusion and grain growth... 70 Appendix D:
Fuel thermal conductivity correlation from HBRP ... 73 Appendix E:
Summary
This report deals with release of fission product gases and irradiation-induced restructuring in uranium dioxide nuclear fuel. Waterside corrosion of zirconium alloy clad tubes to light water reactor fuel rods is also dicussed. Computational models, suitable for implementation in the FRAPCON-3.2 computer code, are proposed for these potentially life-limiting phenomena.
Hence, an integrated model for the calculation of thermal fission gas release by intragranular diffusion, gas trapping in grain boundaries, irradiation-induced re-solution, grain boundary saturation, and grain boundary sweeping in UO2 fuel, under time varying temperature loads, is formulated. After a brief review of the status of thermal fission gas release modelling, we delineate the governing equations for the afore-mentioned processes. Grain growth kinetic modelling is briefly reviewed and pertinent data on grain growth of high burnup fuel obtained during power ramps in the Third Risø Fission Gas Release Project are evaluated. Sample computations are performed, which clearly show the connection between fission gas release and grain growth as a function of time at different isotherms.
Models are also proposed for the restructuring of uranium dioxide fuel at high burnup, the so-called rim formation, and its effect on fuel porosity build-up, fuel thermal conductivity and fission gas release. These models are assessed by use of recent experimental data from the High Burnup Rim Project, as well as from post irradiation examinations of high-burnup fuel, irradiated in power reactors.
Moreover, models for clad oxide growth and hydrogen pickup in PWRs, applicable to Zircaloy-4, ZIRLO’ or M5’ cladding, are formulated, based on recent in-reactor corrosion data for high-burnup fuel rods1. Our evaluation of these data indicates that the oxidation rate of ZIRLO-type materials is about 20% lower than for standard Zircaloy-4 cladding under typical PWR conditions. Likewise, the oxidation rate of M5 seems to be about 40% lower than for Zircaloy-4. Finally, the applicability of FRAPCON-3.2 to fuel rods with ZIRLO and M5 cladding is also assessed by comparing the models for clad yield stress and axial growth to experimental data for these materials.
Sammanfattning
Denna rapport behandlar fissionsgasfrigörelse och bestrålningsinducerade mikro-strukturförändringar i kärnbränsle av urandioxid. Dessutom behandlas korrosion av zirconiumbaserade kapslingsrör till lättvattenreaktorbränsle. Beräkningsmodeller, lämpade för implementering i datorprogrammet FRAPCON-3.2, föreslås för dessa potentiellt livslängdsbegränsande fenomen.
Således formuleras en integrerad modell för beräkning av termisk fissionsgasfrigörelse från urandioxidbränsle genom intragranulär diffusion, gasinfångning i korngränser, bestrålningsdriven återlösning av gas, mättnad av korngränser, samt korngränssvepning under tidsberoende temperaturförhållanden. Vi formulerar de styrande ekvationerna för dessa processer, efter en kortfattad översikt av gängse modeller för termisk fissionsgas-frigörelse. En kortfattad översikt ges även av modeller för korntillväxt, liksom en utvärdering av relevanta data för korntillväxt i högutbränt bränsle under effektramper från Third Risø Fission Gas Release Project. Beräkningar utförs, som för olika tempera-turer tydligt illustrerar det tidsberoende sambandet mellan fissionsgasfrigörelse och korntillväxt.
Modeller föreslås även för den förändring av urandioxidens mikrostruktur, den så kallade rimbildning, som sker vid hög utbränning, samt dess effekt på porositets-uppbyggnad, bränslets värmeledningsförmåga och fissionsgasfrigörelse. Dessa modeller utvärderas med hjälp av nyligen publicerade experimentella data från High Burnup Rim Project. Dessutom används resultat från efterbestrålningsundersökningar av högutbränt bränsle från kraftgenererande reaktorer för utvärdering av dessa modeller.
Slutligen formuleras modeller för oxidtillväxt och väteupptag hos kapslingsrör avsedda för tryckvattenreaktorer. Dessa modeller, vilka avser kapslingsmaterialen Zircaloy-4, ZIRLO’ och M5’, baseras på korrosionsdata för högutbrända bränslestavar från kraftgenererande reaktorer. Vår utvärdering av dessa data antyder att ZIRLO-material har ungefär 20 % lägre oxidationshastighet än standard Zircaloy-4 vid typiska tryck-vattenreaktorförhållanden. Oxidationshastigheten hos M5 är under samma förhållanden ungefär 40 % lägre än för Zircaloy-4. Slutligen utvärderas möjligheterna att använda FRAPCON-3.2 för modellering av bränslestavar med kapsling av ZIRLO eller M5 även genom att jämföra programmets modeller för kapslingens flytspänning och axiella längdtillväxt mot mätdata för dessa material.
1 Introduction
When light water reactor (LWR) nuclear fuel is operated with long residence times in the core to achieve a high released energy density (burnup), several phenomena come into play that are potentially life-limiting for the fuel rods. Among these phenomena is the release of gaseous fission products from the fuel pellets. The noble gases xenon and krypton are generated during fission of uranium and plutonium isotopes. A fraction of these gaseous fission products is released into the free volume of the fuel rod, thereby increasing the internal fuel rod gas pressure. In addition, the gas released into the pellet-cladding gap degrades the thermal conductance of the gas in the gap, causing higher fuel temperature and further enhancement of fission gas release. Fission gas release is generally considered to be a potentially life-limiting (burnup-limiting) factor because of its consequences to fuel rod pressure build-up and clad tube integrity.
Several physical processes contribute to fission gas release (FGR) in UO2 nuclear fuel, and they are usually divided into athermal and thermal release mechanisms (Olander, 1976). Athermal release takes place by recoil and knockout of fission gas atoms by energetic fission fragments. Since these mechanisms generally result in release of less than 1% of the fission gas produced within the fuel pellets, athermal release alone has to date not been considered a potential problem for excessive fuel rod pressure build-up. However, there is concern that the restructuring of UO2 at high burnup, the so-called rim zone formation, could enhance athermal FGR in high-burnup fuel.
Thermal release mechanisms have potential for much larger release fractions than the athermal mechanisms. The thermal release is highly temperature dependent and is driven by thermal processes in irradiated fuel. These processes include gas diffusion to grain boundaries, grain growth, grain boundary saturation and release. In-reactor experiments, performed by ramping nuclear fuel rods to different power levels, indicate that, at above a certain linear heat generation rate (LHGR), fission gas release is significantly enhanced. The increase in fuel temperature due to the rise in LHGR enhances volume diffusion of fission product gases to the grain boundaries of UO2 fuel. It may also cause grain growth, which sweeps the gases to the grain boundaries. Upon saturation of grain boundaries with gases, rapid gas release to the free volume of the fuel rod will occur.
Another potentially life-limiting phenomenon in LWR fuel rods is the waterside cor-rosion of the clad tubes. The corcor-rosion leads to thinning of the clad tube wall, and also to absorption of hydrogen in the metal. Both effects lead to loss of clad strength and ductility with increasing fuel rod exposure. The corrosion-induced clad embrittlement is known to limit the survivability of high-burnup fuel rods, especially if the rods are subjected to accidents or off-normal operational conditions.
Fuel fission gas release and clad waterside corrosion are thus two important phenomena with relevance to fuel rod integrity at high burnup, and in particular, to the fuel rod integrity under transients and power excursions. The FRAPCON-3.2 computer code (Berna et al. 1997), which is used by the Swedish Nuclear Power Inspectorate to analyse the thermo-mechanical performance of LWR fuel rods, comprise a set of models for these phenomena. Some of these models have limited applicability to high burnup fuel. For instance, the code does not comprise models that explicitly treat the formation of a high-burnup fuel microstructure and its consequences to the fuel behaviour. In the work presented here, such models are formulated and assessed for use within FRAPCON-3.2, together with several other models for application to high-burnup fuel rods.
The report is organized as follows:
Section 2 of the report deals with the behaviour of UO2 fuel pellets at high burnup. More precisely, the mechanisms behind irradiation-induced fuel restructuring, athermal and thermal fission gas release, fuel pellet grain growth and fuel thermal conductivity degradation at high burnup are discussed, and models for these phenomena are proposed. Section 3 deals with the cladding tubes, and in particular with the waterside corrosion of PWR clad materials. The current models for PWR clad corrosion in FRAPCON-3.2 are revised, and their applicability is extended to Zr-Nb type clad materials (ZIRLO,M5) by use of recent in-reactor corrosion data for high burnup fuel rods, reported in literature. Moreover, the applicability of FRAPCON-3.2 to fuel rods with ZIRLO and M5 cladding is also assessed by comparing the models for clad yield stress and axial growth to measured data for these materials.
2 Models for uranium dioxide fuel behaviour
2.1 Formation of high-burnup microstructure
2.1.1 Background
A restructuring of the UO2 fuel material takes place at the pellet peripheral rim in high-burnup fuel. This restructuring is characterized by grain subdivision, increase in porosity and depletion of fission gas from the UO2 matrix, (Matzke, 1995) and (Spino et al. 1996). The resulting microstructure is usually referred to as the ’rim zone structure’, which is somewhat misleading, since the microstructure is related to enhanced local burnup and fission rate in combination with low temperature at the pellet rim, rather than to the radial position in itself. Consequently, we will use the term ‘high-burnup structure’, as proposed by Lassmann et al. (1995), to denote the restructured part of the fuel material.
There is ample experimental evidence that the high-burnup structure starts to form at a local burnup of 60-70 MWd(kgU)-1 by subdivision of grains at the fuel pellet outer surface and at pores and bubbles close to the surface. At conditions typical of LWR fuel, the pellet radial average burnup is about 45 MWd(kgU)-1 when this restructuring starts at the pellet rim. The fully restructured material has a typical grain size of 200-300 nm, which is much smaller than that of the original material (≈10 µm). In early investigations, it was not clear whether this grain subdivision resulted from the local build-up of plutonium, or if it was a result of accumulated irradiation damage. From later studies on fuels with different initial enrichments, it is clear that the rim zone formation is due primarily to accumulation of irradiation damage, and not to the generation of plutonium (Kameyama et al. 1994) and (Kinoshita et al. 2000).
The restructured grains are depleted of fission gas, with the fuel matrix containing only about one fifth of the fission gas present within the large original grains, (Mogensen et al. 1999) and (Walker, 1999). Numerous measurements by electron probe micro-analysis (EPMA) have shown that the restructured grains contain 0.20-0.25 wt% Xe. EPMA is a local technique, by which the amount of Xe, atomically dissolved in the fuel matrix and comprised in sub-nanometre sized intragranular bubbles, is measured within very small volumes of the material. With the X-ray fluorescence (XRF) and secondary ion mass spectrometry (SIMS) techniques, it is possible to measure the average gas content in larger volumes, which comprise gas also on grain boundaries and in pores. By combining EPMA with XRF or SIMS, it has been shown that only a minor part of the fission gas that is depleted from the grain matrix is released to the rod free volume during the grain restructuring (Mogensen et al. 1999) and (Noirot et al. 2004). The major part of the gas is trapped in newly formed, micron-sized pores, which make the rim zone microstructure appear as cauliflower in micrographs.
The presence of a porous microstructure at the pellet rim may affect the behaviour of high-burnup fuel in several ways (Turnbull, 2002).
Firstly, the high-burnup structure has potential to enhance athermal fission gas release. Secondly, as further discussed in section 2.3, there is concern for degraded thermal conductivity of the porous restructured material. Thirdly, the restructuring of the fuel material may change the deformation behaviour of the pellet, with consequences to the pellet-clad mechanical interaction (PCMI). The potential for gas-induced swelling and fragmentation of the porous high-burnup structure at elevated temperatures should be considered in analyses of accidents and off-normal fuel operation.
The current version of the FRAPCON code (version 3.2) does not comprise models that explicitly treat the formation of a high-burnup microstructure and its consequences to the fuel rod behaviour. Such models have therefore been formulated and assessed for use within FRAPCON-3.2. The models are presented in the following subsections. 2.1.2 Threshold for material restructuring
In order to model the high-burnup fuel microstructure, we first need to define the threshold conditions at which the material restructuring occurs. As mentioned in the preceding section, experimental investigations have revealed that the high-burnup structure starts to form at the pellet outer surface, when a local burnup of 60-70 MWd(kgU)-1 is reached. These numbers are approximate. Distinct thresholds cannot be defined, since the fuel restructuring is a gradual process, and restructured grains may co-exist with original, untransformed grains up to a local burnup of 120 MWd(kgU)-1 (Walker, 1999). The burnup threshold for restructuring is also influenced by the original grain size of the material. Large-grain UO2 materials have markedly higher resistance to restructuring than small-grained materials (Une et al. 2000) and (Tsukuda et al. 2003). Several hypotheses have been proposed to explain the observed restructuring of UO2 at a certain burnup threshold. The restructuring has been attributed to the diminution of potential recrystallization sites in the material due to interaction with vacancy-impurity pairs (Rest & Hofman, 1994) or with fission gas bubbles (Rest, 2004). Other investigators have proposed that the restructuring is caused by build-up of stored energy in the material due to irradiation damage (Thomas et al. 1992), stresses produced as a result of over-pressurized fission gas bubbles (Matzke, 1992), or instability phenomena (Kinoshita, 1997). These hypotheses lead to conflicting conclusions about the influence of temperature and fission rate on the burnup threshold for fuel restructuring.
As an example, Rest and Hofman (1994) proposed an atomistic model for fuel restructuring, in which the stored energy in the material is assumed to be concentrated on a network of dislocation-induced nuclei that diminish with dose, due to interaction with radiation-produced defects. Grain subdivision is assumed to occur when the energy per nucleus gets high enough that the creation of grain-boundary surfaces is offset by the creation of strain free volumes, with a resultant net decrease in free energy of the material. Departing from these assumptions, Rest and Hofman (1994) formulated a theoretical threshold burnup for restructuring of UO2, as a function of temperature and fission rate. For simplicity, they postulated that both temperature and fission rate were constant during the entire fuel lifetime. Still, their expression for the burnup threshold is rather complex, and the tenacious reader is referred to the original works for a detailed description of the subject (Rest & Hofman, 1994 and 1995).
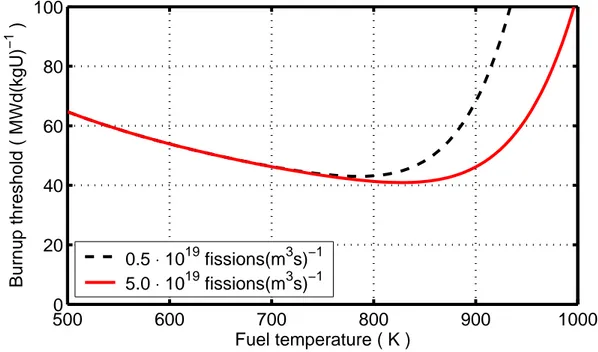
The predicted burnup threshold for grain subdivision from their model is shown with respect to fuel temperature and fission rate in figure 2.1. Clearly, the calculated burnup threshold increases markedly at temperatures above 900 K. This trend is not supported by recent experimental data from the international High Burnup Rim Project (HBRP), where UO2 fuel has been irradiated in the Halden test reactor up to 96 MWd(kgU)-1 under isothermal conditions in order to determine the influence of temperature on the burnup threshold for fuel restructuring. These experiments have shown that the fuel restructuring process is practically unaffected by temperature in the range of 800 to 1300 K, and in particular, that the burnup threshold seems independent of temperature within this range (Kinoshita et al. 2004). Since the atomistic model by Rest and Hofman (1994) is in conflict with these results, the model must be rejected. To this end, we note that Rest has recently revised the model (Rest, 2004). We will return to the revised model in the sequel.
500 600 700 800 900 1000 0 20 40 60 80 100 Fuel temperature ( K )
Burnup threshold ( MWd(kgU)
−1
)
0.5 ⋅ 1019 fissions(m3s)−1 5.0 ⋅ 1019 fissions(m3s)−1
Figure 2.1: Burnup threshold for UO2 restructuring, calculated with the temperature dependent model by Rest and Hofman (1994). Typical fission rates in LWR fuel under
normal operation are bounded by the two values indicated in the figure.
An empirical temperature-independent threshold for fuel restructuring, equal to 70 MWd(kgU)-1 in terms of local fuel burnup, was applied by Lassmann et al. (1995) for modelling the inward propagation of the high-burnup structure towards the pellet centre under steady-state fuel operation. The model was successful in predicting the width of the rim zone as a function of pellet average burnup, but as they themselves pointed out, the approach could only be used up to an average pellet burnup of 70 MWd(kgU)-1. When the pellet average burnup exceeded the local burnup threshold, their model predicted restructuring of the entire pellet cross-section, which is in conflict with experimental observations. To circumvent this problem, they proposed that their fixed burnup threshold should be complemented with a threshold temperature, above which fuel restructuring cannot occur. The HBRP experiments have later revealed that this threshold temperature is 1100≤100 ±C (Kinoshita et al. 2004).
It should be pointed out that the HBRP experiments were carried out under isothermal irradiation conditions, and it is not clear if the results are directly applicable to conditions in commercial LWRs, where the fuel temperature decreases gradually with time. However, in the sequel, we will assess the applicability of the following condition for fuel restructuring
K 1373 if MWd(kgU) 70 1 < ≥ − T E . (2.1)
Here, E and T are fuel local burnup and temperature, respectively. For fuel temperatures above 1373 K, fuel restructuring is assumed not to occur. Equation (2.1) is basically the model proposed by Lassmann et al. (1995), extended with the temperature threshold found in the HBRP experiments (Kinoshita et al. 2004). It should be remarked that the notion of distinct thresholds for both burnup and temperature in the restructuring of UO2 is too simplistic, and that equation (2.1) is merely an empirical relation.
A temperature independent burnup threshold for restructuring of UO2 was recently proposed by Rest (2004), based on an atomistic model. In short, the model considers the evolution of a cellular dislocation structure, which provides potential nuclei for recrystallization of the material. With increasing burnup, the number of potential recrystallization nuclei is gradually reduced by interaction with nanometre-sized fission gas bubbles. Fuel restructuring is assumed to occur when the density of viable recrystallization nuclei equals the equilibrium number of nuclei, which is calculated based on thermodynamics. The reader is referred to Rest (2004) for a description of the theory behind this model. The resulting condition for recrystallization of UO2 is2
2 15 4 10 34 3 / . E ϕ ⋅ ≥ , (2.2)
where E is the fuel local burnup in MWd(kgU)-1 and j is the local fission rate in fissions(m3s)-1. Hence, according to the model by Rest (2004), the burnup threshold for fuel restructuring is independent of temperature, but weakly dependent on fission rate. It should be remarked that Rest presented equation (2.2) as a threshold for initiation of recrystallization, which he distinguished from the subsequent progression and eventual consumption of the original grain structure.
We have implemented equations (2.1) and (2.2) in the FRAPCON-3.2 computer code, in order to assess these two conditions for fuel restructuring. The assessment was made by comparing the calculated evolution of the fuel high-burnup structure with experimental data by Manzel and Walker (2000, 2002), who determined the width of the fuel rim zone as a function of pellet average burnup by optical microscopy of commercial PWR fuel rods. The calculations with FRAPCON-3.2 were done by simulating the operational history of these rods. The fuel rod design data and rod irradiation history that were used in calculations are summarized in appendix A. In the calculations, the conditions for fuel restructuring in equations (2.1) and (2.2) were checked for each radial position (annulus) of the discretized fuel pellet.
By repeating this procedure for consecutive time steps through the irradiation history, the inward growth of the restructured zone was calculated as a function of increasing exposure. The results are compared with experimental data by Manzel and Walker (2000) in figure 2.2. The step-like nature of the calculated curves in figure 2.2 reflects the radial discretization of the fuel pellet in FRAPCON-3.2: the pellet is here divided into 25 annuli. Obviously, the model by Lassmann et al. (1995) in equation (2.1) drastically overestimates the width of the rim zone for pellet average burnups exceeding 50 MWd(kgU)-1. Since calculated fuel temperatures are low for the case considered here, the threshold temperature of 1373 K in equation (2.1) does not limit the inward propagation of the rim zone, and at an average pellet burnup of 82 MWd(kgU)-1, the restructured zone is predicted to extend over the entire pellet cross-section. We note that the measured rim width at this burnup is 400-500 µm.
0 20 40 60 80 100 0 200 400 600 800 1000 1200
Pellet average burnup ( MWd(kgU)−1 )
Width of restructured rim zone ( µm )
Lassmann et al. (1995) Rest (2004)
Data (Manzel & Walker, 2000)
Figure 2.2: Calculated width of restructured zone (rim zone), in comparison with optical microscopy data for UO2 fuel pellets from commercial PWR fuel rods. On the other hand, the burnup threshold for fuel restructuring proposed by Rest (2004) underestimates the width of the rim zone over the entire burnup range spanned by the data. However, the trend with respect to burnup is in fair agreement with the optical microscopy data by Manzel and Walker (2000). Moreover, the calculated fuel restructuring is effectively confined to the pellet periphery through the fission rate dependence of the burnup threshold in equation (2.2). Hence, the theoretically based model by Rest seems to capture the trend in data, although it underestimates the width of the rim zone. Consequently, we scale the burnup threshold on the right-hand-side of equation (2.2), to obtain a best fit to the experimental data in figure 2.2. In addition, we introduce an empirical correction factor for the influence of original grain size on fuel restructuring, based on the work of Une et al. (2000).
The resulting condition for UO2 restructuring is 1 0 5 15 2 4 10 10 94 2 o . / S . E ⋅ ≥ − ϕ , (2.3)
where So is the grain size [m] of the fuel before restructuring. Other parameters in equation (2.3) are defined earlier in this section. Equation (2.3) is the condition for fuel restructuring, which we have implemented in FRAPCON-3.2. As shown in figure 2.3, the calculated rim width agrees quite well with measurements over the entire burnup range spanned by the data of Manzel and Walker.
0 20 40 60 80 100 0 200 400 600 800 1000 1200
Pellet average burnup ( MWd(kgU)−1 )
Width of restructured rim zone ( µm )
Equation (2.3) with S
o= 10µm
Data (Manzel & Walker, 2000)
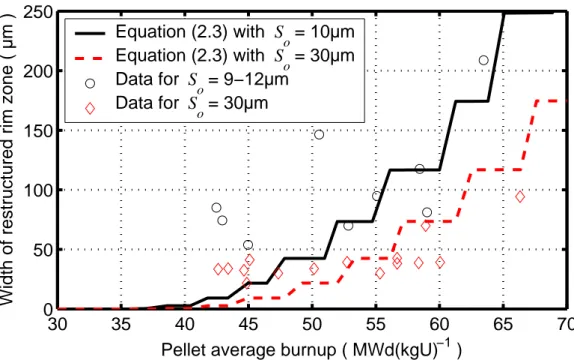
Figure 2.3: Calculated width of restructured zone from equation (2.3), in comparison with optical microscopy data for UO2 fuel pellets from commercial PWR fuel rods. In figure 2.4, the predicted influence of fuel grain size on the fuel restructuring process is compared with experimental data by Tsukuda et al. (2003), who measured the width of the restructured rim zone in fuel pellets from high-burnup PWR fuel rods by ceramography. The fuel rods were fabricated with UO2 fuel pellets with an as-fabricated average grain size of either 9, 12 or 30 µm. The variation in grain size was reached by modifying the manufacturing process, and not by changing the chemical composition of the fuel by additives (Tsukuda et al. 2003). As clearly revealed by the data in figure 2.4, the fuel restructuring is affected by the grain size. The inward growth of the restructured zone was calculated by use of FRAPCON-3.2 and equation (2.3), assuming a fuel as-fabricated grain size of 10 and 30 µm. The model seems to underestimate the width of the restructured zone for pellet average burnups in the range of 40 to 50 MWd(kgU)-1. However, the agreement with experimental data is fair, considering that the calculations were done with approximate input data, due to lack of information about the true irradiation conditions for these fuel rods.
30 35 40 45 50 55 60 65 70 0 50 100 150 200 250
Pellet average burnup ( MWd(kgU)−1 )
Width of restructured rim zone ( µm )
Equation (2.3) with S o= 10µm Equation (2.3) with S o= 30µm Data for S o= 9−12µm Data for S o= 30µm
Figure 2.4: Calculated width of restructured zone from equation (2.3), in comparison with optical microscopy data for UO2 fuel pellets with two different as-fabricated grain sizes (Tsukuda et al. 2003). 2.1.3 Porosity in restructured material
Prior to fuel restructuring, gaseous fission products at the pellet periphery are accumulated predominantly in nanometre-sized intragranular bubbles, although some gas is also found in solid solution and in fuel as-fabricated porosity (Noirot et al. 2004). When the original grains are recrystallized, the intergranular bubbles are swept out of the fuel matrix, and the new grains are free of small-size bubbles. A minor part of the gas may possibly escape to the rod free volume during the recrystallization process, but most of the gas is trapped in bubbles at the newly formed grain boundaries, where they coalesce into micron-sized pores (Kinoshita et al. 2004). Spino et al. (1996) reported that the micron-sized pores form early in the restructuring process, and that the pores are surrounded by a shell with recrystallized material that grows thicker as the restructuring proceeds. They also reported that the mean pore size remains constant at approximately 1.3 µm, whereas the pore number density increases as the restructuring process continuous. In fully restructured material, the porosity may reach 20 vol% and higher, but it is considerably lower in fuel that experiences mechanical restraint from pellet-clad mechanical interaction. Hence, rim zone porosity above 15 vol% is rarely observed in fuel subjected to PCMI (Une et al. 2000, 2001). Models for build-up of porosity in the restructured material have been presented by Baron et al. (1996) and by Lee et al. (2001). The latter model is fairly simple, and with minor modifications, it lends itself for implementation in FRAPCON-3.2. The fundamental assumptions behind this model are based on the experimental observations mentioned above:
• As the material is restructured, the accumulated fission gas content is trapped within a population of equal-sized spherical pores with radius Rp.
• After restructuring, the gas remains trapped in the pores, whose radii do not change with time. A minor part of the fission gas that diffuse from the interior of grains to the grain boundaries in the restructured material is directly vented to the rod free volume, but most of the gas is without delay collected in newly formed pores, whose radii are also Rp, see section 2.1.4. Hence, within the high-burnup structure, all gas except for gas atoms in solution within the fuel grains is comprised in equal-sized pores. Moreover, the number density of pores in the high-burnup structure increases with exposure, but the pore size is assumed not to change.
• The fission gases within the pores obey the equation of state for an ideal gas. From the last assumption, we find
p B p p pV n k T P = , (2.4)
where Pp [Pa] and Tp [K] are the pressure and temperature of gas contained in a pore of volume Vp [m3]. The number of gas atoms within the pore is np, and kB is Boltzmann’s constant. The gas pressure in the pore is calculated from
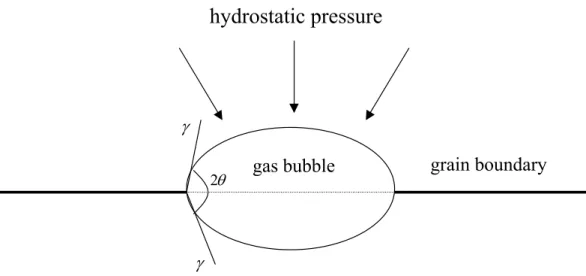
p p ext p R b R P P = + 2γ + µ , (2.5)
where Pext is the external hydrostatic pressure (mean compressive stress) in the solid material surrounding the pore, and γ, µ and b are the surface tension, shear modulus and Burger’s vector of UO2, respectively. In our implementation of the model in FRAPCON-3.2, Pext is set equal to the pellet-clad contact pressure. Constant values are used for the remaining quantities in equation (2.5), as defined in table 2.1.
The first two terms on the right-hand-side of equation (2.5) correspond to the equilibrium pressure in the pore. The last term is an excess pressure, which is connected with distortion of the crystal lattice (Nogita & Une, 1995). With the material properties given in table 2.1, this overpressure is 45 MPa.
Uranium dioxide material property Value
Surface tension, γ [ Nm-1 ] 1.0
Shear modulus, µ [ GPa ] 75
Burger’s vector, b [ nm ] 0.39
Rim zone pore radius, Rp [ µm ] 0.65
Table 2.1: Properties assumed for the material within the high-burnup structure. Since we assume that the fission gas inventory outside the grains of the high-burnup structure is contained within the micron-sized pores, the bulk concentration of gas outside the grains, Cog [atoms m-3], follows from
p p p og V n F C = , (2.6)
By combining equations (2.4) to (2.6), we find
(
)
p ext B og p R b P T k C F µ γ + + = 2 . (2.7)Hence, equation (2.7) can be used to calculate the local porosity in the high-burnup structure as a function of fuel local fission gas content, temperature and hydrostatic pressure. The fission gas content outside the grains, Cog, is in our implementation of the model in FRAPCON-3.2 calculated from the generated amount of gas, minus the gas contained within the restructured grains and gas released by athermal processes and by possible thermal mechanisms; see sections 2.1.4 and 2.2.
The radial variation of porosity in a high-burnup fuel pellet, as calculated through equation (2.7), is in figure 2.5 compared with experimental data by Manzel and Walker (2000). These data were obtained from optical micrographs of a fuel pellet cross section from a commercial PWR fuel rod that reached a peak pellet average burnup of 102 MWd(kgU)-1. The calculated curve in figure 2.5 results from analyses of this rod with FRAPCON-3.2, as described in appendix A.
The as-fabricated porosity of the fuel was 4 vol%, and the step-like raise in calculated porosity from this value at a relative pellet radius of 0.7 marks the boundary to the restructured outer part of the pellet. In the experimental data, the corresponding boundary is found at r/ro º 0.65, and there seems to be a gradual transition to the restructured part of the pellet. Moreover, the calculated porosity close to the pellet surface is underestimated. It should be pointed out that both the calculated and measured porosity has a local minimum at r/ro º 0.9. For the calculated curve, it is clear that this minimum follows from the product of gas content and temperature in the numerator to equation (2.7): since the gas content increases and the temperature decreases monotonously with pellet radius, the calculated product attains a local minimum at r/ro º 0.84. The local minimum for the experimental data is slightly closer to the pellet surface, but the trend in data agrees quite well with the model.
The impact of mechanical restraint on the build-up of porosity within the high-burnup structure is illustrated in figure 2.6. The experimental data are taken from the compilation presented by Une et al. (2000, 2001). By comparing the measured rim zone porosity from eight different experimental investigations, they concluded that mechanical restraint from pellet-clad mechanical interaction has a strong limiting effect on porosity build-up. Fuel samples irradiated under prototypical conditions, i.e. under restraining forces from PCMI, attain a lower degree of porosity than samples irradiated without other mechanical restraints than the weight of the fuel stack. This is clearly revealed by the data in figure 2.6, although there is a considerable spread in measured porosity. The spread is mainly due to the fact that the fuel initial porosity ranged from 2 to 5 vol% in the eight considered studies. Moreover, the porosity in the high-burnup structure was measured by different methods for quantitative image analyses, and the samples were irradiated at various fission rates and temperatures.
The calculated curves in figure 2.6 correspond to analyses of rod 12C3 with FRAPCON-3.2, as described in appendix A.
The porosity was calculated through equation (2.7) by setting the hydrostatic pressure equal to either the pellet-clad contact pressure (‘PCMI’) or to zero (‘No PCMI’). The calculated end-of-life contact pressure was about 40 MPa in this particular case.
0 0.2 0.4 0.6 0.8 1 0 5 10 15 20 25
Relative pellet radius, r/r
o ( − )
Fuel porosity ( % )
Model − equation (2.7) Manzel & Walker (2000)
Figure 2.5: Calculated distribution of pellet micron-sized porosity, in comparison with optical microscopy data for UO2 fuel pellets from commercial PWR fuel. The as-fabricated fuel porosity was 4%. The porosity of the high-burnup structure (r/ro>0.7) is calculated through equation (2.7), which has been implemented in FRAPCON-3.2.
0 20 40 60 80 100 120 140 0 5 10 15 20
Local burnup ( MWd(kgU)−1 )
Local porosity ( % )
Model − No PCMI Model − PCMI Data − No PCMI Data − PCMI
Figure 2.6: Calculated build-up of porosity in the pellet high-burnup structure, in comparison with experimental data from the works of Une et al. (2000, 2001).
Obviously, the model is in fair agreement with data for the case of PCMI, but it underestimates the porosity build-up in fuel samples irradiated without mechanical restraint.
In conclusion, it seems that the outlined approach can be used for calculating the porosity in restructured UO2 under conditions that are typical of commercial LWR fuel rods at high burnup, i.e. when the fuel pellet is restrained by pellet-clad mechanical interaction. The calculated porosity across the rim zone will be used as input to the correlation for fuel thermal conductivity, as described in section 2.3. Moreover, the rim zone porosity is an essential input parameter for analyses of the fuel rod behaviour under reactivity-initiated accidents.
The model presented here is intended for analyses of the porosity build-up under normal, steady-state fuel operation, and it is not applicable to overpower transients. Under such transients, the overpressurized pores are expected to expand by creep in the surrounding solid material, an effect that is not considered here. It should be pointed out that equation (2.7) implies that the porosity of the high-burnup structure grows linearly with the fission gas content of the material. Hence, the build-up of porosity is not assumed to saturate as burnup increases, unless some kind of excessive fission gas release takes place from the high-burnup structure. However, for typical LWR fuel rods, a gradual attenuation of the porosity build-up is expected, since for normal operating conditions, increasing burnup implies lower fuel temperatures and higher pellet-clad contact pressures.
2.1.4 Athermal fission gas release from restructured material
Fission gas release process in UO2 fuel can be considered to consist of two mechanisms: an athermal release and thermal release. The athermal release accounts for the contribution of release caused by direct recoil of fission fragments within a layer equal to the range penetrated by the fission fragments in the fuel (≈10 µm), and by a knockout mechanism, which is an elastic collision between fission fragments and fission product gas atoms in the fuel (Olander, 1976). Hence, we may write the athermal release rate as a sum of two contributions:ℜather =ℜrec +ℜkn, where ℜ and rec ℜ are the recoil and kn knockout release rates, respectively. Both quantities are proportional to the fission rate and the range of fission fragments. Moreover, they depend on the fuel specific surface, i.e. the surface to volume ratio of the solid (S /V). In knockout, release is proportional to the total surface area of the fuel, which includes the surfaces of internal cracks in the fuel pellet, whilst recoil is proportional to the geometric surface area. This is due to the fact that a recoiling fission fragment, with kinetic energy of about 80 MeV, is capable of re-entering any region of the fuel (Lewis, 1987).
In light water reactor fuel, athermal gas release is nearly a linear function of the fuel burnup, up to a burnup of around 40 MWd(kgU)−1. In engineering practice, the athermal gas release fraction, i.e. the ratio of released to produced gas, is calculated according to
CE
Fath = where E is the fuel burnup [MWd(kgU)−1] and C is a constant of proportionality. For example, Lorenz (1979) found that C=8.5×10⁻⁵, based on evalu-ation of athermal fission product gas release data obtained from rods irradiated up to an average burnup of around 40 MWd(kgU)−1.
As mentioned in section 2.1, the high-burnup microstructure in the pellet rim zone has potential to enhance the athermal fission gas release. One of the first major experimental programs directed towards fission gas release in high-burnup light water reactor fuel was the international High Burnup Effects Program (HBEP), in which the fission gas release in altogether 82 well-characterized fuel rods with various designs and with rod average burnups in the range of 22 to 69 MWd(kgU)-1 were studied (Barner et al. 1993). An upper-bound correlation, fitted to experimental data, showed that an increase in fractional fission gas release by at most 4% could be expected at a pellet average burnup of 80 MWd(kgU)-1.
Some investigators have proposed that this fission gas release occurs as a direct and immediate consequence of the fuel restructuring (Sontheimer & Landskron, 2000). However, studies of restructured fuel material with XRF and SIMS have revealed that no appreciable fission gas release occurs as a direct consequence of restructuring, see e.g. the works of (Mogensen et al. 1999) and (Noirot et al. 2004). The same conclusion has also been drawn from the High Burnup Rim Project, where the fission gas content of restructured UO2 fuel samples was determined by high-temperature annealing of the material (Kinoshita et al. 2004).
Other investigators have argued that the enhanced athermal gas release is an indirect effect of the restructuring. For instance, Bernard et al. (2002) have pointed out that the usual athermal mechanisms for fission gas release, recoil and knockout, are enhanced by an increase in the specific surface (S/V) of the porous restructured material. This theory seems plausible, but according to several experimental observations, the rim zone porosity is not interconnected, and should therefore not significantly increase the fuel specific surface (Spino et al. 1996) and (Une et al. 1997). An alternative hypothesis to the increased fission gas release rate from the restructured material is due to Lassmann et al. (2000), who recognized that irradiation enhanced athermal diffusion from the interior of the small restructured grains to the grain boundaries is sufficiently fast to explain the observed matrix depletion of gas, and that the same mechanism could possibly contribute to enhanced fission gas release from the pellet rim zone.
Hence, there is currently no general consensus on how the enhanced fission gas release from the high-burnup structure occurs. Further experimental data are needed to un-ambiguously identify the physical processes behind the fission gas release from the restructured material, before mechanistic models for the release process can be formulated. In the current version of FRAPCON, fission gas release from the high-burnup structure is considered by assuming an additional contribution to the athermal release, when the pellet average burnup exceeds 45 MWd(kgU)-1. The model is a purely empirical upper-bound correlation, which is based on experimental data from the HBEP (Barner et al. 1993). An obvious weakness with this simple approach, in which the release is correlated to the pellet average burnup, is that the true radial distributions of burnup and fission product gases at the pellet rim are not considered.
For this reason, we have introduced a new model for rim zone athermal fission gas release in FRAPCON-3.2. In contrast to the standard model in FRAPCON, the new model is locally applied, which means that the model is applied to radial nodes (annuli) located within the restructured part of the fuel pellet.
The model thus relies on the calculated evolution of the restructured rim zone, as described in section 2.1.2. Moreover, the model makes use of the governing equations for diffusional gas transport to the grain boundaries, defined in section 2.2.2. The key assumptions behind the new athermal fission gas release model are as follows:
• In the restructured part of the fuel pellet, the original grain size is reduced to 0.3 µm. This implies a significant reduction of the diffusion length for intragranular gas atoms, which means that gas arrives to the grain boundaries at a significantly higher rate in the restructured material than in the original material. From the characteristic time for gas diffusion, defined in section 2.2.6, we find that the rate is increased by a factor (So/Sn)2, where So and Sn are the sizes of the original and restructured grains, respectively. Consequently, diffusion of gas to the grain boundaries may be signi-ficant in the rim zone, even though the temperature and diffusivity are low.
• A certain fraction of the fission gas that arrives to the grain boundaries by diffusion from the interior of restructured grains is directly vented and released to the rod free volume. The remaining gas is supposed to be trapped in micron-sized pores, as des-cribed in section 2.1.3. From evaluations of fission gas release data from low-power LWR fuel rods at high burnup, the aforementioned release fraction is set to 0.30. The advantage of this model, in comparison with the current empirical correlation for rim zone athermal fission gas release in FRAPCON-3.2, is that the model is well integrated and consistent with the proposed models for fuel restructuring and thermal fission gas release. Hence, the fission gas release from the high-burnup microstructure is calculated with consideration of the true width of the rim zone and the local conditions (yield and diffusivity of fission gas) within the restructured material.
2.2 Thermal fission gas release
2.2.1 Background
Gases xenon and krypton, produced during fission of uranium and plutonium isotopes, have low solubility in UO2; hence, after a relatively short irradiation period a large number of fission gas filled bubbles are generated within the fuel grain. Fission gas bubbles in grains remain small, less than 30 nm (Matzke, 1980), whereas lenticular bubbles up to a few microns can be observed at grain boundaries (Turnbull & Tucker, 1974). It is generally accepted that the process of irradiation-induced re-solution is responsible for the destruction of intragranular bubbles (Turnbull, 1980), ensuing a large population of small bubbles and ample fraction of produced gas atoms in enforced solution. The gas atoms in the solution migrate to the grain boundaries unless the bubbles trap them. The re-solution process should also act on the intergranular gas bubbles; however at the grain boundary the abundance of vacancies allow bubbles to grow to larger sizes. When these bubbles interlink, they form a tunnel network (Tucker & Turnbull, 1975), through which a fraction of gaseous fission products is released into the free volume of fuel rod increasing the internal fuel rod pressure. The bubble interlinkage is a cyclic process, since the tunnel network can close again under the effect of surface tension when the outgoing flow of gas atoms offset their supply.
In the past decades there have been many efforts to develop physically based theoretical frameworks for calculations of fission product gas release in nuclear fuel. From our vantage point, these comprise seminal works of Booth and Kennedy (Booth, 1957) on intragranular diffusional release and Speight (1969), which included the effect of gas precipitation, re-solution and grain boundary saturation and release. The problem of time varying parameters (diffusion coefficient and gas production rate) was analysed among others by Matthews and Wood (1980), and later by Forsberg and Massih (1985a) analytically. Moreover, Forsberg and Massih (1985b, 1986) extended the time-varying conditions to include the effect of re-solution and the intergranular gas release. Lassmann and Benk (2000) and Lassmann (2000) have recently evaluated the accuracy of these methods. Moreover, Hermansson and Massih (2002) have analysed the generality and accuracy of the original Forsberg-Massih model rigorously. The current model for thermal fission gas release in FRAPCON-3.2 is claimed to follow the work by Forsberg and Massih (1985b), but in reality, the implemented algorithm differs from their work (Lanning et al. 1997a). This was observed by Jernkvist and Massih (2002), who introduced a corrected algorithm for the fission gas release model into the SKI version of FRAPCON-3.2.
At temperatures where ample grain growth occurs, other processes than atomic diffusion may contribute to the accumulation of gases on grain boundaries. Grain boundary movement can sweep up fission gas atoms more rapidly than they could have arrived at the boundary by diffusion (Hargreaves & Collins 1976). The Forsberg-Massih model was reformulated and extended to account for diffusional release under grain growth (Forsberg et al. 1994). The results of this formalism,3 based on analytical calculations, were compared with accurate numerical analysis of the proposed governing equations (Hede 1994). A more detailed theoretical description of this model is presented in (Forsberg & Massih, 2001). A general theoretical method for calculation of the release of volatile fission gas products has been provided by Paraschiv et al. (1999). This method models the phenomena of grain growth, grain boundary bubble growth and re-solution based on their earlier studies on the release of stable fission product gases from nuclear fuel.
The moving boundary equation (Forsberg & Massih 2001) does not account for the detailed behaviour of the grain boundary gas atoms during irradiation. The inter-connection of gas bubbles is assumed to occur when the grain boundary gas concentration of gas atoms reaches a saturation concentration, Nsat, determined by the equation of state for the gas (Forsberg & Massih 2001, White & Tucker 1983).
Kogai (1997) presented a pragmatic model to describe the behaviour of grain boundary gas atoms. He partitioned the grain boundary into two zones, namely the grain boundary surface, where fission gas atoms are in solid solution, and the intergranular bubbles, where they exist in pockets of gas. Fission gas atoms arriving to the grain boundary are placed on the grain boundary surface and the intergranular bubbles, depending on the ratio of the bubble coverage to the total area of grain boundary. The gas atoms on the grain boundary surface diffuse to the intergranular bubbles in the presence of a temperature gradient.
Intergranular bubbles are taken to be spherical; they grow and shrink depending on the difference between the bubble pressure and the external hydrostatic stress. The density of intergranular bubbles are supposed to be constant before the interlinkage, and then it is decreased with the growth of bubbles after the geometrical interlinkage point. Kogai (1997) verified his model against fission gas release data obtained from highly irradiated fuel, where temperatures were also measured.
Van Uffelen (2000, 2002) extended Kogai’s model and put forward a more detailed description of precipitation of fission products at grain boundaries. Van Uffelen’s model accounts for changes of fuel chemistry during irradiation and can distinguish between the behaviour of different migrating species. The model comprises the effect of irradiation-induced resolution associated with the intragranular and intergranular gas bubbles. As discussed by Van Uffelen (2000), precipitation of fission products can occur at different types of “traps”, e.g. at grain boundaries, line defects, gas filled bubbles, pores and metallic precipitates (Walker et al. 1988). Also, fission products such as caesium and iodine can get immobilized by means of chemical interaction with the UO2 fuel and other fission products, e.g. CsI. Hence, the precipitation of fission products depends on fuel temperature and burnup, the particular species, fuel stoichiometry, as well as on the number density and size of the trapping centres. Van Uffelen has analysed the effect of the trapping properties on the precipitation rate in grain boundaries according to various studies (Van Uffelen, 2000). The rate of grain boundary precipitation is quantified in terms of a quantity called the capture rate coefficient (Van Uffelen, 2000). As a result he has found that the cell model with a source term provides a suitable relation for the capture rate coefficient, since it accommodates all the important parameters affecting this quantity.4
Another issue of interest in this regard is the importance of grain boundary gas diffusion to the gas release process. It is generally believed that thermal fission gas release occurs via interlinkage of grain boundary gas bubbles. Olander and Van Uffelen (2001) have investigated the role of grain boundary diffusion in fission gas release. Their model calculations indicate that in the presence of a population of intergranular gas bubbles with the areal density and fractional coverage observed in irradiated fuel, a xenon atom will be trapped after a migration distance in the grain boundary equal to the size of the grain (around 8 micron). Based on this result, they conclude that grain boundary transport is not a release mechanism for fission gas in irradiated fuel.
Fission gas bubbles in UO2 grain remain small (≤30 nm) throughout the irradiation period (Matzke, 1980), since the effective irradiation-induced re-solution limits their growth. The bubbles are virtually immobile at least up to temperatures of 2100 K. Also, it is argued that bubbles of radii less than 50 nm are pinned by line defects (dislocations) and they in turn immobilize bubbles in the 10 nm range (Olander, 1976). Accordingly, in light water reactors under normal conditions and even during moderate power transients, gas atom diffusion is the prevailing fission gas release process (Combette et al. 1999).
4 The cell model assumes the presence of a regular array of traps in the matrix consisting of fission gas bubbles. A unit cell defines a capture surface, which surrounds each gas bubble. The entire grain surface is divided into N identical cells (circles), each cell containing one trap at its centre. The diffusion
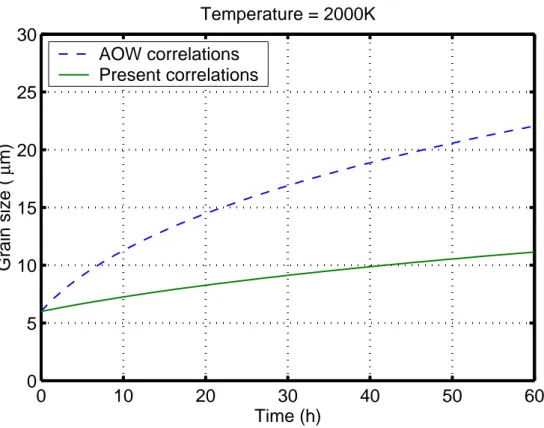
In this section, we outline a general method for calculation of thermal fission product gas release by gas atom diffusion, irradiation-induced re-solution, grain boundary saturation, and grain boundary sweeping in UO2 fuel under time varying temperature loads. We suppose that UO2 grains are spherical of equal size. Then the diffusion equation for gas atoms in the grain, which allows for the time variations of gas diffusion coefficient, gas production rate, and grain size (moving boundary), is formulated for an equivalent spherical grain. The equation is subjected to a boundary condition, which accounts for grain boundary gas accumulation, re-solution (to the grain), and grain boundary saturation prior to release. A kinetic equation for grain growth is coupled to the above boundary value problem. Moreover, the correlations used for the calculation of UO2 grain growth during irradiation are reappraised in light of experimental data, and revised correlations that treat the data more appropriately have been proposed. The governing equations for gas diffusion problem and some sample calculations were briefly presented in an earlier overview paper (Forsberg et al. 1994) and a more detail calculation was presented in (Forsberg & Massih 2001). Here, an outline of the main equations is presented. The obtained equations are used to calculate fission gas release and grain growth as a function of irradiation time for different isotherms.
2.2.2 Gas release model: governing equations
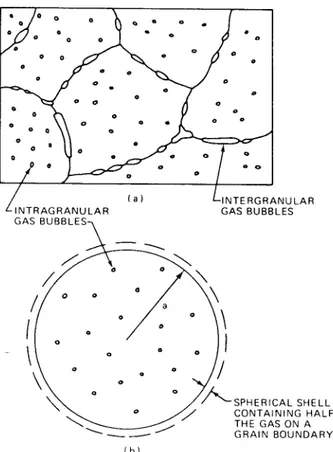
The fission gas release equations considered here originate from the seminal works of Speight (1969). Speight considered the diffusion of fission gas atoms in a spherical grain of UO2, which contains a fixed number of saturated traps, see figure 2.7. The gas concentration in the trap can be labelled by M to distinguish it from the matrix or dissolved gas K. Absorption of the matrix gas into the traps takes place at a rate g; and re-solution, from the traps back into the matrix, occurs at a rate νg. Thus, the governing equations are expressed as
Μ − Κ = Μ + Μ + Κ − Κ ∇ = ∂ Κ ∂ ) ( ) , ( ) ( ) ( ) , ( ) , ( ) , ( 2 t t r g dt t d t t r g t r D t t r g g ν β ν . (2.8)
where D is the gas diffusion coefficient in the UO2 lattice and β is the gas production rate. The total gas concentration is
) ( ) , ( ) , (r t r t t C =Κ +Μ . (2.9)
Speight assumed that the gas bubbles are saturated and hence a steady-state prevails, giving Κ Μ = ⇒ = Μ g g dt d ν ; 0 . (2.10)
This means that the ratio of the capture rate to the re-solution rate equals the ratio of the gas concentrations in the bubbles to that in the matrix.
Figure 2.7: Schematic visualization of gas bubbles inUO2 grains and on grain boundaries (a) Realistic configuration, (b) Idealized spherical grain employed in
Speight’s model (1969); from Olander (1976). Combining equations (2.8)-(2.10), we obtain
. with ) , ( ) , ( 2 g D D t r C D t t r C g g eff eff + ≡ + ∇ = ∂ ∂ ν ν β (2.11)
The capture rate depends on the concentration of gas bubbles in the grain, Cb, which following Ham (1958), it can be estimated according to
b bR DC
g =4π , (2.12)
where Rb is the mean bubble radius. The re-solution rate may be defined as the probability per second that a gas atom within a bubble undergoes re-solution. It is proportional to the fission rate j and the fission fragment range l (Turnbull 1980). It is expressed as 2 ) ( 2πϕ δ νg = l Rb + , (2.13)
where δ is the damage radius of a fission fragment, estimated to be around 1 nm (Turnbull 1980).
Equation (2.11) is reformulated to account for the problem of fission product gas release under time varying temperature (Forsberg et. al., 1994). The differential equation for concentration of gas atoms at position r in a spherical grain of radius R at time t,
) , ( tr C is given by ), ( 0 for ) ( ) , ( ) ( ) , ( D t 2C r t t r R t t t r C r + < < ∇ = ∂ ∂ β (2.14) where we have dropped the subscript eff from the effective diffusivity D for eff
convenience. The boundary conditions imposed on C( tr, ) are 0 ) , 0 ( = ∂ ∂ r t C (2.15) ) ( ) ( ) ( ) ), ( ( and t D t N t B t t R C = . (2.16)
The initial condition is C(r,0 )=1. Here B(t) = vb λ/2 , vb is the grain boundary re-solution rate and λ/2 the re-solution depth from the grain face. All the considered variables are time dependent. The boundary condition (2.16) was first used by Turnbull (1974), in a time invariant form, in order to account for the presence of intergranular bubbles situated at the surface r = . It signifies that the sink at grain boundary is R imperfect and the irradiation-induced re-solution is a controlling mechanism for grain boundary saturation.
The total amount of gas G(t) per unit volume in a grain of radius R and on its boundary is written as ) ( ) , ( 3 ) ( ) ( 2 ) , ( ) ( 3 ) ( 0 3 2 t R dr t r C r t B t R t R C t D t G R
∫
+ = . (2.17)Here, the first term on the right hand side of equation (2.17) expresses the amount of gas residing on the grain boundary in equilibrium with the gas inside the grain, whilst the second term represents the amount of gas inside the grain whose distribution is governed by the diffusion equation.
We assume that the ratio B(t)/β(t) is time independent, since both vb and β are proportional to the fission rate. If no gas is released, we have
∫
= t s ds
t
G( ) 0β( ) . (2.18)
When concentration of gas at the grain boundary reaches a certain saturation value,
) (t Cs , given by ) ( ) ( ) ( t D N t B t C sat s = , (2.19)
then gas release will occur, where N is the area density of gas atoms at grain faces at sat saturation.
The amount of release F is calculated according to ) ( ) ( ) (t 0 s ds G t F =
∫
tβ − . (2.20)The analytical solutions for equations (2.14)-(2.17) have been detailed elsewhere (Forsberg & Massih 2000 & 2005); therefore they are not repeated here.
2.2.3 Grain growth description
2.2.3.1 Modelling overview
Grain growth of polycrystalline materials such as UO2 is a thermally activated process. Here, we consider only the so-called equiaxed normal grain growth, which is characterized by the following two main attributes (Atkinson 1988):
• Uniformity- Relatively speaking, there is a narrow range of grain sizes and shapes. • Self-similarity – A simple change in scale is enough to render the distribution of
sizes at two different time points coincide. Meaning that the form of the distribution is time invariant.
Normal grain growth is dissimilar to abnormal grain growth (also called secondary recrystallization) in which a few large grains extend and consume a matrix of smaller ones, eventually interrupting the normal grain growth.
Burke and Turnbull (1952) developed one of the first physically motivated grain growth models. They deduced a parabolic relation for the temporal evolution of grain size. They accounted for the migration of a boundary by transport of matter under a pressure due to surface curvature. It was argued that the boundary tends to migrate toward its centre of curvature, since this reduces the area of boundary and hence its associated energy. By assuming the mean radius of curvature of the boundary is proportional to the average grain size S =2R, they showed that
S k dt
dS = , (2.21)
where k is the rate of the boundary motion, which is temperature dependent. Integration of this equation leads to parabolic grain growth description
kt S S − 2 =
0
2 , (2.22)
where )S =S(t is the mean grain size at time t and S is the initial mean grain size. In 0 UO2 fuel and many other ceramic materials, however, the exponent of S is found to be larger than 2. For example, Ainscough et al. (1973) found that the exponent n in
n
kt
S = is always less than 0.36 and hence equation (2.22) does not provide a quantitative description of UO2 grain growth.
It has been known that both pores and inclusions (e.g. fission products) can hamper the grain boundary motion (Burke & Turnbull, 1952).
Burke and Turnbull have proposed an equation, which accounts for the retarding forces that arise from the interactions of grain boundaries with inclusions and pores. It can be expressed in the form
− = m S S k dt dS 1 1 , (2.23) where S is the limiting grain size at which grain growth ceases. Ainscough et al. m
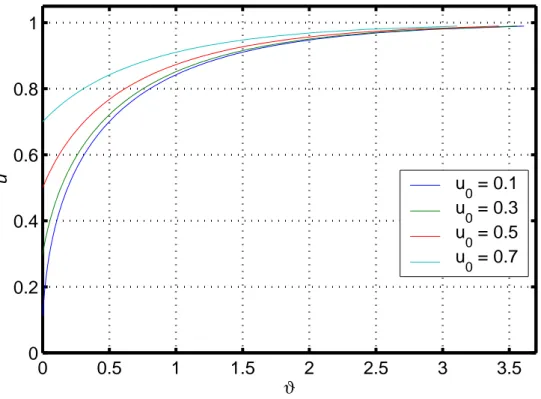
(1973) utilized this equation to describe grain growth kinetics of UO2 fuel and determined the temperature dependence of the parameters k and S , which have m Arrhenius form, see table 2.2. Moreover, they scaled S with fuel burnup in the m manner:Sm ⇒Sm/(1+0.2E), where E is the local burnup [MWd(kgU)−1], in order to account for the accumulation of fission products in grain boundaries during irradiation. The next level of grain growth analysis is the so-called effective field or the mean field approach (Atkinson 1988), which treats the change in size of an isolated grain embedded in a field of other grains. It represents the effective influence of the entire array of grains. This approach was initially proposed by Feltham (1957) and further developed by Hillert (1965). It may be explained as follows: During normal grain growth, there is an increase in the mean grain size and a decrease in the number of grains in the system. This process can be observed as the change of grain size distribution )f( tS, with time, figure 2.8. This change is a result of (i) a diffusion-like process, where grains larger than the mean size get larger due to the concentration gradient (df /dS) and (ii) a velocity (v=dS/dt), caused by a driving force that tends to reduce the boundary curvature.
0 0.5 1 1.5 2 2.5 0 0.2 0.4 0.6 0.8 1 S(t)/S c(0) f(S,t) τ=0 τ=0.5
Figure 2.8: Evolution of grain size distribution á la Hillert (1965). Here, τ is the normalized time, i.e. the actual time divided by the time constant. Note that we have
Feltham (1957) and Hillert (1965), as in (Burke & Turnbull, 1952), assumed implicitly that the driving force dominates the normal grain growth and that the driving force is related to the elimination of grain boundary area. There are two possible ways to determine a mean growth rate: (a) Using a particular expression for the drift velocity and then calculate the grain size distribution; (b) using an experimentally determined expressions for v and f. Hilllert (1965) selected the first approach, while Feltham (1957) the second.
Hilllert utilized concepts from the Lifshitz–Slyozov theory (Lifshitz and Slyozov 1961) to derive the kinetic equation of growth and a grain size distribution function f( tS, ). Hillert’s kinetic equation for the evolution of grain is similar in form as in equation (2.23): − = S S dt dS c 1 1 αµγ , (2.24)
where α is a geometric factor, µ the mobility of the boundary, γ the surface energy of the boundary, and S the critical grain size which varies with time; for c S >Sc the grain will grow, whereas forS <Scthe grain will shrink.
Hillert’s model (Hillert, 1965), which was originally formulated for metals, was adopted to oxide nuclear fuel by El-Saied and Olander (1993) and Paraschiv et al. (1997), where the latter authors also evaluated the original theory of Lifshitz and Slyozov (1961). Paraschiv et al.’s evaluation indicates that the original Lifshitz and Slyozov model provides a more suitable description of grain growth than Hillert’s model. Above all, they find that the fission gas release predictions based on Lifshitz–Slyozov’s theory for normal grain growth are more realistic than predictions based on Hillert’s, mainly because of the smaller grain sizes predicted at the end of irradiation by the former theory.
The mean field approaches alluded here are only a first approximation to the modelling of normal grain growth, which is a complex kinetic phenomenon. It should be treated through the kinetic equations of a distribution function with consideration given to the interactions between the grains. The topic of grain growth modelling is a subject of an active research; a recent overview can be found in (Phillips, 2001).
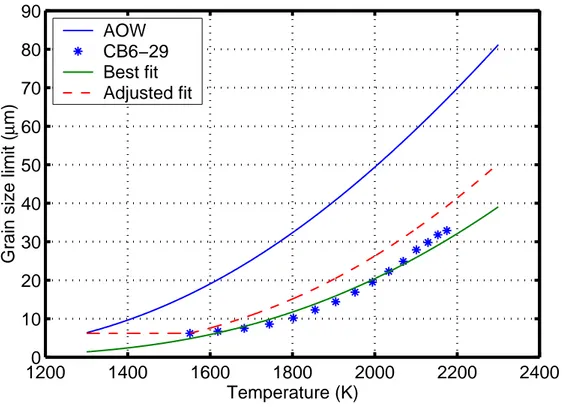
2.2.3.2 Present grain growth model for fuel behaviour
For the analysis of fuel behaviour under power ramps, we have chosen a single grain modelling approach of Burke and Turnbull (1953) following the work of Ainscough et al. (1973). However, the UO2 grain growth data of fuel subjected to power ramps obtained within the Third Risø Project (Bagger et al. 1994) indicate that the Ainscough et al.’s model is unsuitable to the power transient case in which a few hours of grain growth follows many days of burnup accumulation. This can be due to the fact that the correlations employed by Ainscough et al. (1973) for k(T)and )Sm(T were intended to calculate the grain size when the burnup increases as the grain growth proceeds. There has been a recent attempt (Khoruzhii et al. 1999) to extend the Ainscough et al. (1973) model by adding a power density dependence term 1/Sirr(T), while dropping the burnup dependence of S (T) in the right hand side of equation (2.23).