Nr 71, 0 1982
. ISSN 0347-6049
(x iv , :. '» ' ...Statens väg- och trafikinstitut (VTI) 0 581 01 Linköping
National Road & Traffic Research Institute ' S-581 01 Linköping ' Sweden
.__Carownership,usageandfuel
1
-* f; ("consumption
' ]; 78ngKennethASP
.; _"i ' aff-Paperpresented to a work shopoftheOECDRoad ResearchProgrammearrangedby » _ '_.'__l.;_Inst1tutde Recherche desTransports(IRT)andheldinParisonOctober781982 The ._ i
* ,;workshop wasentitled The1mpactof theeconomlcs1tuatlonontravelinurban
' _ -:"7åareas *- r. . , - .__ =. » - - , -- - 3.1. - " ' ' * m ' ' 1 Reprint fromabook preparedbythe IRT beforetheworkshop,entitledThe1mpactof ' 7 _' theeconom1c situation on travelin urbanareaspubllshedby Mlmsteredela
MKRTR
Nr 71 0 1982 Statens väg- och traiikinstitut (VTI) 0 581 01 Linköping
ISSN 0347-6049 National Road & Traffic Research Institute ' S-581 01 Linköping ' Sweden
Car ownership, usage and fuel
consumption
by Kenneth Asp
Paper presented to a work shop of the OECD Road Research Programme arranged by Institut de Recherche des Transports (IRT) and held in Paris on October 7 8, 1982. The work shop was entitled "The impact of the economic situation on travel in urban areas".
Reprint from a book prepared by the IRT before the work shop, entitled "The impact of the economic situation on travel in urban areas", published by Ministére de la
Car ownership, usage and fuel consumption by Kenneth Asp
This report has been produced for the OECD seminar on October 6 7 1982 entitled "Impact of the economic
situation on travel in urban areas", for the session
Contents Car density Car ownership Number of cars Car usage 1. 2. 3.
4. Average lifetime of cars 5. 6. Fuel consumption 7. Energy saving Page O O L D U T Q N Å x . 8 _ Å
Ca rs pe r pe rs on 0.6 0.4 0.2 Car density
A decisive limit to future developments in travel is the trend in car density. Family ownership of two
cars is regarded by many as being a transient phenomenon while others believe that it will increase successively. Car density in Sweden is among the highest in the world
about 2.9 habitants/car (Car statistics 1981).
Together with W Germany, Switzerland, Canada, Australia
and New Zealand, Sweden was exceeded only by the USA
(1.8 inhabitants/car). The development in car density
between 1930-1980 is shown in Fig 1.
|__ ... USA + - West Germany .. ... . Australia + _ - Italy
.... Sweden Q...-.. France '. - Spain Q - Great Britain
_ _- _ h f, 1930 1940 1950 1960 1970 1980 Year
Fig 1. Car density in various countries 1930 1980
Source: Mitchell (1981)
Car ownership
One hypothesis often put forward is that income level has a decisive effect on the level of car ownership. However, it has been difficult to prove this. Instead several studies have shown that income does not influ-ence car ownership (Tanner 1982). If, in spite of this, higher income is assumed to be the only cause of in
creased numbers of cars it is possible to estimate the elasticity of income for a country over a certain
period of time by dividing the rate of increase in car ownership by the rate of increase in income. The
following figuresvwnxaobtained for the period 1958/60
1979/80: Austria 2.3 Norway 2.3 Belgium 1.9 Spain 3.7 Denmark 1.9 Sweden 1.8 Finland 2.5 Switzerland 3.6 France 1.4 Canada 1.1 W Germany 2.6 US 1.0 UK 2.5 Japan 2.9 Ireland 2.0 Australia 1.6
Italy 3.1 New Zealand 1.9
Netherlands 3.2
Source: Tanner 1982
These income elasticities tend to decrease with in creased car ownership, having an average of about 3 for countries with low car ownership (up to 0.1 cars/ person in 1968 70) thereafter falling to 1.0 for the USA.
Number of cars
When considering continued increases in numbers of cars
there are strong indications that most of the member countries have begun to approach a certain saturation level (Tanner 1982).
The demand for cars can be devided into two main aspects; partly the demand to replace scrapped cars and partly the demand to increase the supply of cars so that it approaches total car usage. The first type of demand has its origin in the number of cars which were new
:ea
x
n
o
s
10 15 years ago and in the average lifetime of these cars, while the second depends on the current phase of an often logistical expansion process. The replace ment demand is generally equal to the number of cars scrapped and has increased in nearly all the member countries since the 1960's. This means that the purely net increase in percentage terms is decreasing although the total car ownership is increasing. In absolute
terms there is however no high correlation with car ownership. In, for example, 1976 80 the highest net increase was in W Germany with 18 cars/1000 inhabitants and year while the lowest was in Sweden with 2 cars/
1000 inhabitants and year.
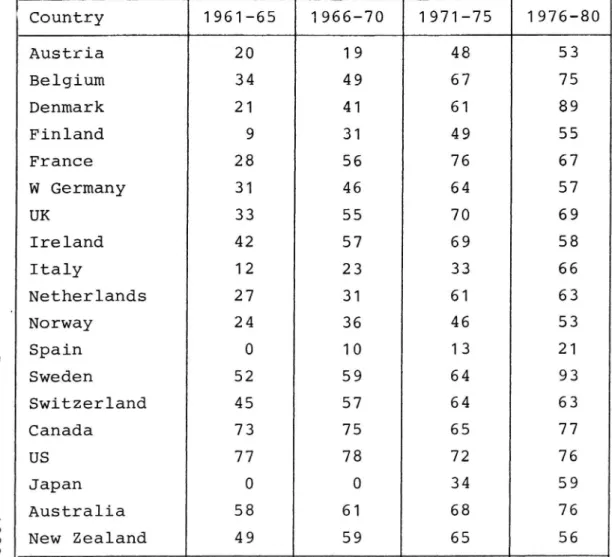
The following table shows the percentage of new cars replaced during the last 20 years in various countries. Table 1 Percentages of new cars which are attributable to replacement demand 28 61 , I S U U E C L Country 1961-65 1966 70 1971-75 1976 80 Austria 20 19 48 53 Belgium 34 49 67 75 Denmark 21 41 61 89 Finland 9 31 49 55 France 28 56 76 67 W Germany 31 46 64 57 UK 33 55 70 69 Ireland 42 57 69 58 Italy 12 23 33 66 Netherlands 27 31 61 63 Norway 24 36 46 53 Spain . 0 10 13 21 Sweden 52 59 64 93 Switzerland 45 57 64 63 Canada 73 75 65 77 US 77 78 72 76 Japan 0 0 34 59 Australia 58 61 68 76 New Zealand
49 59 65
56
Average life of cars
Tanner (1982) has collated the average lives of cars
as follows:
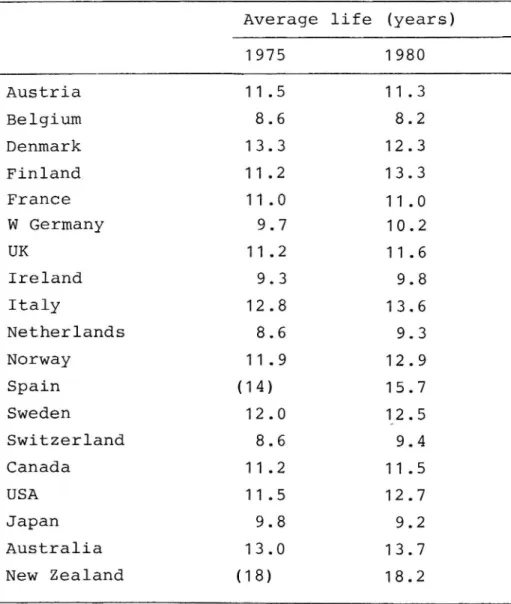
Table 2. Estimated average life of cars as at 1975 and 1980.
Average life (years)
1975 1980 Austria 11.5 11.3 Belgium 8.6 8.2 Denmark 13.3 12.3 Finland, 11.2 13.3 France 11.0 11.0 W Germany 9.7 10.2 UK 11.2 11.6 Ireland 9.3 9.8 Italy 12.8 13.6 Netherlands 8.6 9.3 Norway 11.9 12.9 Spain (14) 15.7 Sweden 12.0 12.5 Switzerland 8.6 9.4 Canada 11.2 11.5 USA 11.5 12.7 Japan 9.8 9.2 Australia 13.0 13.7 New Zealand (18) 18.2
Note: Figures are numbers of years of new registration
required to give numbers of cars on register at
end of 1975 or 1980.
;As can be seen from the table the average life varies greatly between different countries. The shortest lives are in Belgium, W Germany, Ireland, the Netherlands, Switzerland and Japan, while Australia, New Zealand, Italy and Spain have the longest. Large differences
also appear between countries and between different makes of cars. In Sweden, for example, the lives of
Volvo carslmumaincreased very greatly between 1975-1980. An analysis of the average life of all cars in Sweden gave a figure of 13.9 years in 1975 and 15.5 years in 1980.
Car usage
The first car in a family is used primarly by the head of the household. Statistics for 1975 from the Nether lands show that the family car is used to 86 % by the man in the household. A study from Helsinki shows simi
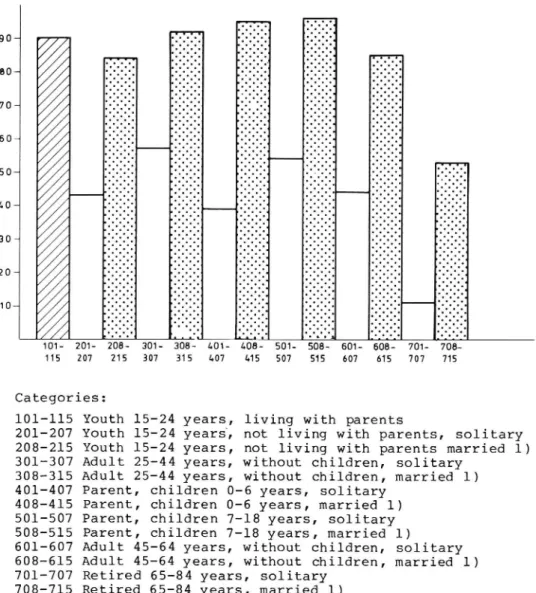
larly that the man in the family uses the car to 80 %. Car ownership has in itself brought increased mobility while it has created environmental disturbance such as noise and air pollution. What is the situation re garding car ownership in Sweden? Fig 2 gives some statistics. There is a higher level of car ownership among married peOple than among solitary people. One in every two solitary people has a car while nine out of every ten married people have a car.
I | 1 . | | ._!
0
-f-?-?
If '
9
7
:-
:. ...
50 222; 'x- f D% :
:;
% 5
;:
E:. ...
50 2222 E I; IÄ.. Loa 2222 2 ? :... 30 5222 ; : 20 522; f 5 10 22222; :: I 101- 201_ 208- 301- 308 401- 408-115 207 215 307 315 407 415 Categories: 101-115 Youth 201-207 Youth 208-215 Youth 301 307 Adult Adult Parent, 15 24 years, li 25-44 years, wi 25 44 years, wi children 0-6 Parent, children 7-18 Adult 45 64 years, wi Adult 45 64 years, wi Retired 65 84 years, Retired 65 84 years, 701 707 708-715l)Married or living together stances. This is valid for
Fig 2. Socio economic s Source: Asp Lundin (198
In order to understand travel it may therefore changes in the travel b
vidual or household ove
15 24 years, not living with parents,
15 24 years, not living with parents married 1)
701- ibåi m7 HS 508 601 ebé: sm am am 501-507
ving with parents
solitary thout children, solitary
thout children, married 1) years, solitary
Parent, children 0 6 years, married 1) Parent, children 7 18 years, solitary
years, married 1)
thout children, solitary thout children, married 1) solitary
married 1)
under similar circum all figures.
trata and car ownership/disposal
0)
and analyse the demand for be valuable to study the ehaviour/pattern of an indi r a period of time and the way in which this changes from childhood to old age, i.e during the whole li
way in which the travel different age categorie poses of journeys. Cert
fe cycle. Of interest is the pattern varies both between 5 and between different pur
continue throughout the whole life cycle, for example, shopping, services and visits, while others are
limited to certain parts of the life cycle, for example, journeys to and from work. Mobility expressed as the number of journeys varies greatly with age and with purpose of journeys. Households with children in the upper teens and just above are among the most mobile categories. The older children are responsible for a large number of pleasure trips, visits and leisure journeys. Cohabiting households generally have greater mobility than solitary individuals, mainly because they own a car (cf Asp Lundin 1980).
In Sweden 79 % of the pOpulation has access to a car (Statistical bulletin 1981z20). At the same time it can be seen that access to a car varies according to the age composition of the population (see Fig 3).
Va 50~~ Without cars LO * 30» All 20» 10" With cars
Fizz. 253.1. 1.5161. 65 81. Age
Fig 3. Age composition and proportion of households with and without access to a car
Source: Asp Lundin, 1982
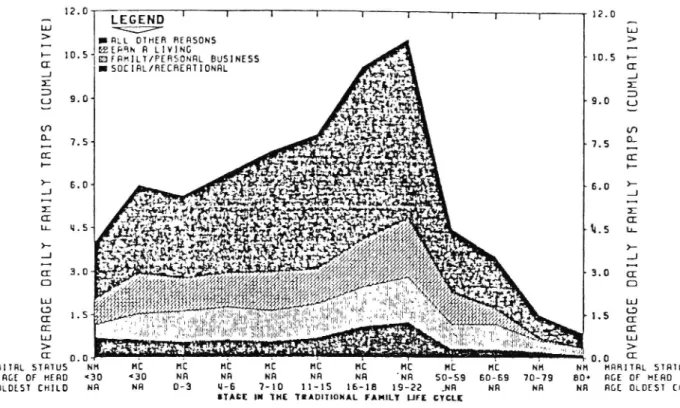
An American study (Zimmerman 1981) describes travel needs during the life cycle. The results of the study are to a great extent fairly similar to those which would be obtained if a corresponding analysis were
Fig 4 shows the results of the American study.
' LEGEND 12.0 _
Lu v uJ
& .nu omm masons >
__ wtpqn n LlVlNG » (I mrnnxLY/PEHSONRL BUSINESS . 10.5 r ISOElRL/RECRERTIONRL ' C: J __J 2 x 3 D U 9.0 LJ vao. en » 7.5 5; a: cc *" + > > _, 6.0 _J :: 55 C cz - 14.5 u. * > _: CI 3.0 c: D D LU Lu &) 1.5 g m (E UJ uJ > > 03 0.0 0.0 Ct HRHITRL smws NH HC HC HC HC HC HC HC HC HC nu nu mmm smtus not or HERD <30 <30 NR nn nn NR NR 'NR 50 59 60-69 70-79 800 RGE or HERO nog oLozsr cnuo NR NR 0-3 u-G 7-10 11-15 16-10 19 22 Jun Nn un NR RGE OLDEST CHILD
ITAGE IN THE TRADITIONAL FAMILY LIFE CYCLE
Fig 4. Average number of trips/day for cohabiting
families with children
The figure shows that in the traditional life cycle, trips increase from an average of 4 trips/day in the young childless households to 11 trips/day in house holds with older children (19 22) living at home, later falling to 0.9 trips/day for older households in the latter part of the life cycle. Households with a solitary parent travel considerably less than co habiting households, regardless of purpose of journey. Travel decreases generally with age in all purpose categories except shopping and service journeys. Ä summing up of this American travel study gives, among others, the following results:
"Travel patterns of families are affected by the pre sence and age of children in the family. Children have the greatest impact on family travel as they reach their late teens and early twenties, when
så
{its
Travel by persons living alone declines with in creasing age. In their twenties, such persons
average 4.0 trips and 36.1 miles of travel per day. For persons eighty and over, travel drops to an average of 0.9 trips and 2.6 miles daily.
For earning a living, families with young children (oldest age 0-3 years) take fewer trips per day (1.1) than young couples without children (1.4), but travel more miles per day for this purpose
(11.7 vs 10.7).
- Social and recreational travel exhibits a marked
decline with age. When the household head is less than 30 years old, married couples without children
take 0.6 trips and 8.0 miles of travel per day. At age 60-69 half as many trips and miles of travel are reported.
- Trips for family business (shopping, doctors visits,
etc) remain an important reason for household travel throughout the life cycle. For example, persons
living alone average the same number of trips in
their twenties and thirties (0.5) as they do in their fifties and sixties.
Trips and travel for earning a living peak to 2.0
and 16.9 miles respectively, when the oldest child,
age 19-22, is living at home. As children leave home, and the family head enters the retirement years of the life cycle, trips decline to 0.5 daily when the family head is 60 69 and it declines to 0.0 when the family head is in the eighties. Miles of travel during this period drop precipitously from 3.7 and then to 0.0 respectively."
10
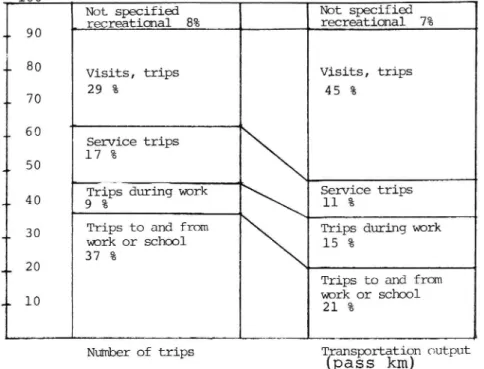
When studying travel distributed among the various categories the following information from a Swedish travel survey made in 1978 can be used.
100
Not specified Not specified recreational 8% recreational 7% 1* 9 O
* 80 Visits, trips Visits, trips 29 % 1» 70 4 5 % + 6 O _ . SerVice trips l 7 % 4. 50 ' ' k Service tri s _ 4 O Trg/.ps during wor 11 9 p 1 9 0 °
30 Trips to and from Trips during work
"" work or school 15 %
37 % +, 20
Trips to and from 10 work or school
** 21%
Number of trips T ansportation output
pass km)
Fig 5. Trips in Sweden 1978 for specified purposes. Source: Asp Lundin 1980
From the figure there emerge two important factors in trip patterns. Firstly, trips to and from work are great in number but not equally significant re garding transportation output. Evidently these trips are so numerous that they have a great impact on pub lic transport dimensioning.
11
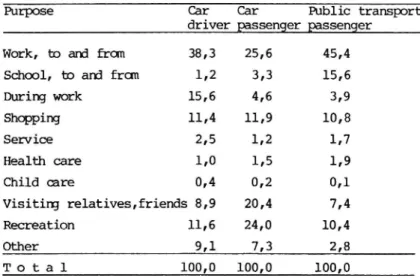
Table 3 sums up purpose distributions for car drivers, car passengers and public transport passengers
(omitting walking/cycling).
Table 3 Purpose distribution among total trips for car drivers, car passengers and public tran sport passengers in Sweden 1978 (%).
Purpose Car Car Public transport driver passenger passenger Work, to and from 38,3 25,6 45,4
School, to and fran 1,2 3,3 15,6 During work 15,6 4,6 3,9 Shopping 11,4 11,9 10,8 Service 2,5 1,2 1,7 Health care 1,0 1,5 1,9 Child care 0,4 0,2 0,1 Visiting relatives,friends 8,9 20,4 7,4 Recreation 11,6 24,0 10,4 Other 9,1 7,3 2,8 T 0 t a 1 100,0 100,0 100,0
Source: Asp Lundin 1980
Car drivers have a wide range of purposes, trips to and from work. This concentration is more evident among pub lic transport passengers however. Also notice the great share of trips to and from school among public tran-sport passengers. Child care trips are few among car drivers (as well as among car passengers and public
transport passengers). This is somewhat surprising since child care is often used as an explanation for tra
velling by car to work although there are theoreti cally good public transport possibilities. Since only "main trips" are counted in the table, leaving or fetching children while going to or from work is not a trip purpose per se. Other material in the Travel Survey also indicates that 45 % of child care trips are made by walking/cycling and a dominating share of
Car passengers are concentrated around trips to and from work, for shopping, paying visits and for re creational purposes. Together these purposes consti tute 82 % of the total number of trips made by car passengers. Evidently these four purposes are most suited for some kind of ride sharing.
Public transport is dominated by trips to and from work and to and from school (together 61 %). ShOpping, visits and recreation in city areas have a relatively small impact on the proportion of public transport for these purposes. Each of them constitutes about 10 %. Mode specific purpose distributions (like above) are one aspect. Intermodal distributions for each purpose are another aspect well worth consideration. This is
shown in table 4.
Table 4 Intermodal distribution per purpose among total trips by car drivers, car passengers and public transport passengers.
Purpose Car Car Public transport Sum driver _passenger passenger
Work, to and from 68,2 14,6 17,2 100,0 School, to and from 22,1 18,9 59,0 100,0 During work 87,3 8,2 4,5 100,0 Shopping 65,0 21,9 13,1 100,0 Service 76,1 12,4 11,5 100,0 Health care 54,2 24,4 21,4 100,0 Child care 79,8 13,6 6,6 100,0 Visiting relatives, 52,2 38,6 9,2 100,0 friends Recreation 54,1 35,7 10,2 100,0 Other 75,6 19,4 5,0 100,0 T o t a 1 65,2 20,9 13,9 100,0 Sourcez Asp-Lundin 1980.
13
This table is heavilvy dominated by the car. Travel
ox
o
ling as the car driver constitutes between 50 and 85 of all purposes except to and from school. Children going to and from school do so mainly by public
transport (59 %) and school trips also have a signi-ficant share of all public transport trips (15,6 % in table 3.1). Another very interesting feature is shown by work trips. Nearly as many trips to and from work are made by car passengers as by public transport. It is probably quite unexpected that ride sharing to and from work nearly equals public transport. Also for other purposes car passengers make more trips than by public transport. Totally, car passenger trips are one and a half times as numerous as public transport trips. With regard to travel generation i e factors which in-crease travel, it is however well known that it is not, for example, the car alone that affects this. PeOple who have access to nearby services and leisure activi ties visit these more often than those without access or living at greater distances. English studies
(Hillman Whalley 1978, Mitchell Town 1979) have, for example, shown that children aged 5-14 who live 0.5 km from a sport centre use this 10 times more often than those living 1 km away. The corresponding figures for children aged 15 19 km were 6 times and for adults 3 times. Similar relationships between distance and utilisation can be found for other types of activities. This increased utilisation also depends on mobility. An individual travels more in general if he has access to a car than if he has to use a bus or walk, i e there
is no full substitution of travel. Instead, the
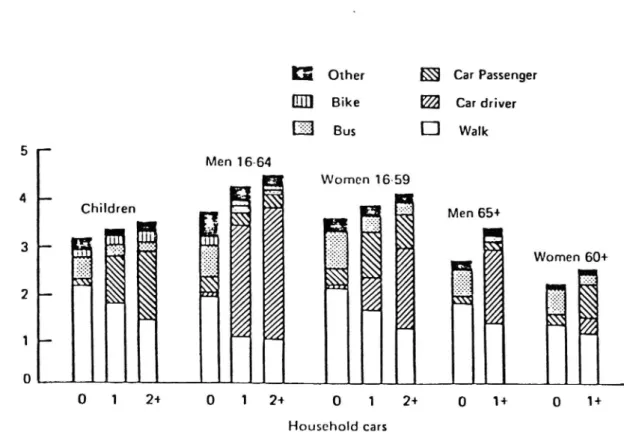
indi-vidual dispenses with making certain journeys. In the same way it is found that men drive a car more often than women, a situation which is also the case in two car households. In trips made by the family together the man usually drives the car, see Fig 6.
Tr ip st ag es pe r pe rs on pe r da y
I: Other Car Passenger
Em Bike Cardriver Bus D Walk Men 16-64 Women 16 59 Children Men 65+ Women 60+
Hf
;
m
a
O 1 2+ O 1 2+ 0 1+ O Household cars
Fig 6. Variations in travel between different age
classes and access to a car Sourse: Mitchell 1981
In order for households to meet their frequently in creased demand for travel with increased income, family size etc a second car may be desirable. In, for example, the Netherlands 47 % of the wives and 52 % of the
children use the family's second and third car respecti-vely, while the husband uses these only to 1 %. Com
pared to other member countries Sweden and W Germany have a small proportion of two car households (about 5 %). This is explained by, among other factors, a
lower average size of household and to a certain extent differences in definitions of a car owning household. ZERO-, ONE- AND MULTI-CAR HOUSEHOLDS IN SEVEN OECD COUNTRIES (%)
Level Finland France Germany Norway Sweden Switzerland United
of Kingdom equipment 1971 1976 1970 1979 1970 1976 1980 1974 1977 1975 1980 1970 1979 O-car 56 46 41 30 52 39 33 50 48 33 27 48 42 1-car 42 48 50 52 49 56 56 46 47 57 59 44 45 > 2 car
2 6 9 18 3 5
11 4 5 10 1 4 8 13 Source: Mitchell 1981.
15
Fuel consumption
Since 1975/76 much effort has been put into advancing research in the field of energy saving. The energy crisis of 1974 revealed the high vulnerability of the world's oil importing countries, partly because large parts of the social institutions of at least the developed countries were and still are heavily dependent on oil. Proportion 1m3z
vg \
'
_ XQSÄÖÄ ; \\
. ! \\ \ \ X » n . HJZ u &?».» v: ,. _ .. ) Fe ..,(xx synns 0
1950 1960 1970 1980 'l
Fig 7. Distribution trend in method of transport for journeys to and from work 1950 80.
16
Fuel consumption in the various member countries is shown in the following table.
Table 5 Main results concerning fuel consumption in OECD countries
Total No of Average Fuel
con-Total fuel private cars mileage sumed per Fuel con
Countr consumed (*) on the road per year car (1979) sumed per
y 1979 1. 1. 1979 per car 100 km
(**) (***; *
106 tonnes) (106) (km (tonnes) (litres)
Australia 11.00 5.462 _ 2.01 -Austria 2.40 2.040 - 1.18 -Canada 28.30 10.080 - 2.80 16.5 Denmark 1.60 1.408 15,400 1.14 9.9 France 17.70 17.780 13,800 1.00 9.7 Germany 23.30 21.620 14,500 1.08 9.9 Greece 1.40 0.650 16,000 2.15 17.9 Italy 12.10 16.980 11,900 0.71 8.0 Japan 34.50 21.280 11,500 1.63 18.9 Netherlands 4.00 4.000 14,000 1.00 9.5 Norway 1.40 1.147 13,000 1.22 12.5 Spain 5.50 6.530 7,600 0.84 14.7 Sweden 3.60 2.856 13,200 1.26 12.7 Switzerland 2.60 2.055 13,500 1.27 12.5 United Kingdom 18.71 14.417 14,000 1.30 12.4 United States 303.20 117.147 15,700 2.60 17.5
NOTE: Some figures for "Fuel consumed per 100 km" are over estimated
because a part is attributable to light trucks in Europe and also to heavy trucks in the U.S.A.
(* Comité Professionnel du Pétrole:
(***
Source: OECD 1982
Pétrole 1979 PARIS
(** Argus Automobile N° Special statistique 1980
Fédération Routiere Internationale GENEVE
The proportion of energy in a litre of fuel actually used to propel a vehicle is small. Figure 8 gives approximate percentages of energy use by a car. About 80 per cent is wasted. This includes the energy used by auxiliary items in overcoming friction and losses through cooling and exhaust. Only about 10 per cent is
used in overcoming road load. Vehicle models have been
used to examine the effect of changing the factors which make up road load
1979).
17
Vehicle fuel efficiency is sensitive to the type of journey for which the car is used and to driving patterns. Cylinder disabling techniques have been used to improve vehicle efficiency by matching engine demand to vehicle duty (Hughes Gill 1980).
Where does the energy in the fuel tank of a car go to?
Losses due to the inefficiencies associated wath various parts of the car
[3 Overcoming the various resistive forces assocmted with motion
Work is in hand to determine the various proportions and the way in which these
are affected by driving conditions Present estimates would apportion the energy
as below
'. _ .. 82% 18% Transmission | 495
..
&
i AedeV a 'NC drag Aux-lier! . , $% _ . 12% , Radiation 69651 . was . Exhaust N L _ _ _ . w!. + EP EÅ: _ ' ' _ .5 %% år :::;1 ::_: _L *::g :-: : it- Rolling resistance
' &
k t / :
Coolant
1 NAN ,'(). ' ANDOAO (SIA-CN LÅCOQAYOFV
Fig 8. The Direct use of energy by the car
Source: Walters-Laker 1980
In analysing fuel consumption, it is important to know the structure and development of the car fleet with regard to horsepower, weight and size. In an OECD report it was shown that after the general fuel price increases in 1973, sales of smaller cars were relatively greater, though the phenomenon lasted only some two yearsg
18
In the US however the trend towards smaller cars has tended to continue as a result of the energysaving policies adOpted by the automobile industry (Inter natonal Affairs, US DOT 1981, Ward's Automobile year book, 1977 and 1980). Size In cc GERMANY 2 000 1500-1999 1000-1499 -1000 1970 71 72 73 74 75 76 1977 FRANCE 1 500 -1000-1500 »1000 1970 71 72 73 74 75 76 1977
Fig 9. New car registrations according to the engine size in Germany and France
Source: OECD 1982 Energy saving
One of the most oil-dependent social sectors is the transport sector. In spite of heavy price increases for fuel during the last 6 7 years only slow changes in technology and transport methods have been discern-ible. It has therefore been an urgent task for the
member countries to support develOpment also in transport so that alternative transport systems and fuels can be found. This support has hitherto been aimed primarily at the following main areas:
interaction between geographic location of population and transport
19
development of transport systems (public transport, para transit, ride sharing)
changes in vehicle design motor development
alternative fuels (primarily methanol)
The research and development activities carried out in recent years have provided a relatively good
picture of the fuel savings which are possible. These saving potentials were initially calculated mainly on the basis of theoretical models. During recent years however development has progressed more towards field experiments and demonstration projects. Activities of these types can be described in many ways. The following description has been chosen, where the effects of
different measures to reduce fuel consumption can be determined both in the transport system and in the various components in this system, i e the road, the
vehicle and the road user (driver).
TEQEEEQ£E_EY5299_9£å99299_992å9595
At system level there are primarily three groups of measures for reducing fuel consumption which have been
studied so far. These involve:
effects of various economic measures
effects of different planning assumptions effects of changes in system technique
The term "economic measures" refers to different mea
sures such as increasing fuel taxation, changing speed
limits or changing regulations for ride-sharing (allowing private motorists to charge for rides).
20
All these examples of measures have been studied during recent years. Price elasticity, for example, has been found to be very low (see Brodin Roosmark 1976) and it is only during the last year that a slight decrease in consumption of petroleum products has been observed. Petrol consumption in Sweden, for example, decreased by about 3 % during 1980 which can be seen in relation to an increase during the same year in taxes and
charges on petrol of about 50 % and in kilometre tax by about 60 %.
The depreciation rate of large engine cars increases when fuel is expensive (Thomson 1972, Mogridge 1981). Cross sectional analysis of fuel consumption against
fuel price gives an elasticity of 1. The short term price elasticity is generally found to be about -0.1 to 0.2 (Oldfield 1980). So the much larger cross sectional effect is likely to be due to shifts in the structure of the vehicle market (especially vehicle size) and long term evolution of the travel pattern.
The fact that there are, however, large (theoretical)
savings potentials is of course obvious. The problem lies in organising ride sharing under normal conditions i e when there is no crisis. Demonstration experiments
with ride-sharing have been carried out in a number
of Swedish towns where various types of organisation have been tested with regard to coordination but these have given very poor results. Experiments arranged by various companies with ride sharing on a voluntary basis to and from work were also unsatisfactory.
Longer term measures often comprise those which can be classified as changes in planning assumptions, for
example, with regard to the effects on fuel consumption in when changes occur in habitation structure
21
It was found that, for example, relatively large fuel savings (10-40 %) could be made in the central areas of large cities or if workplaces were decentralised to smaller urban areas. In the latter case large
savings potentials can be obtained mainly through the possibility of moving transport from both private cars and public transport to GCM transport.
Studies at Lund university have shown that better planning of habitation distribution in suburban areas can reduce the fuel consumption of public transport by about 8 %.
The effects of system changes have also been studied during recent years and cover many aspects from substi tutability of transport with the aid of telecommuni-cations to savings potentials in optimising individual traffic light systems. In both cases the results have so far indicated limited savings possibilities.
Corresponding American studies of energy savings in urban areas (see, for example, Wagner 1980, OECD 1982) have suggested relatively small savings potentials. Studies have covered the following areas:
traffic light regulation removal of traffic lights
priority allocation to public transport - ride sharing
alternative working hours
22
Another measure studied during recent years is that of introducing speed limits. The results of these studies of fuel savings with different speed limits made at
the National Swedish Road and Traffic Research Institute
(VTI) are shown in the following table:
Measure/change
Calculated fuel saving
Total for road traffic sector Average motorist 3
m fuel per year % decrease in annual con
sumption in
% decrease during that part of the journey affected the road by the particular traffic measure/change sector 1980 Energy optimisation 10 000 0.2 of individual traffic light system Energy optimisation 10 000 0.2 5 of coordinated
traffic light systems Lower speed limit
Rural roads 45 000 0.7 from to 110 90 km/h 45 000 0.7 110 70 km/h 130 000 2.1 90 70 km/h 300 000 4.9 -- Streets in urban areas 70 60 km/h 1 400 0.1 5
23
Road oriented measures
Fuel and energy savings in road construction have been studied in a number of cases (Kordi 1979, BFR and
others). The problem has been primarily to optimise
transport of large amounts of material in roadbuilding,
to investigate the possibilities for introducing energy saving pavements and to reduce energy consumption in the production process itself (roadbuilding plant, drying methods etc).
The fuel consumption of vehicles travelling on various types of surfaces has been studied at the VTI, see Fig 10.
l/mil
lOcmlömmöx 10 cm loose snow
3 cm loose snow
3 cm lössnö
... ...
x pmmmasmVis d4 . :'ogfk packed snow/ice
o våt/fuktig _ _: f U __________
barma rk we t / d amp b ar e
ga , $%? surface
Torr
bmmmk dry bare surface
A
» ' ' T l U I _?
30 40 50 60 70 80 km/h
25
Ysbielszerieezs§_ms§§9£s§
In order to achieve immediate fuel savings in the existing vehicle fleet a number of technical measures can be implemented. The VTI has investigated these and obtained the following results (in mixed driving
with a Volvo and a Saab car):
Too low tyre pressure about 1 7 % higher fuel consumption
Studded radial tyres " 2 % "
Studded diagonal tyres " 7 % "
Poorly adjusted engine " 2 20 % " Extra load in the car " 2 6 % "
Empty roofrack " 3 4 % "
Automatic gearbox " 5-10 % "
Loaded roofrack " 7 16 % "
Towing a caravan " 50 60 % "
Fitting spoilers " 2 % lower fuel consumption
" electronic ignition system " 1 % " " thermostatic fan " 1 3 % "
" electric engine heater " 0.12 l/occasion
w
Economy tuning lower fuel consumption
Higher overall gearing
N
Ln
N
w
w
Synthetic engine oils "
1-Road user Oriented measures
\0
Fuel savings of up to 15 25 0 achieved through changes in driving pattern have been reported in mainly American investigations. The changes have generally involved slow
acceleration and retardation.
Several studies have also investigated how different drivers! aids such as accelerometers, flowmeters, vacuum meters, pyrometers and accelerator pedal feedback
26
pattern. At present research projects are in progress at the VTI aimed at finding out whether the driver can be encouraged to drive more efficiently with or without technical aids and whether there are any safety aspects connected with a more fuel efficient driving pattern.
LITTERATURE LIST l (2) Asp K and Lundin O (1982) Billösa i bilsamhället.
VTI Rapport under arbete, Linköping.
Asp K and Lundin O (1980) Public transport in the era of the automobile. VTI Rapport 166A. National Swedish Road and Traffic Research Institute, Linköping.
Bilstatistik 1981. Stockholm
Downes JD (1980) Life-cycle changes in household structure and travel characteristics. TRRL Laboratory report 930.
Hughes MTG and Gill GS (1980) A preliminary assessment of controlled cylinder disablement as a potential means of fuel conservation in automobile engines. Conference on Systems Engineering in Land Transport, Institute of Mechanical Engineering, London.
International Affairs, US DOT (1981) The United States automobile
industry, 1980, Report to the President from the Secre tary of Transportation.
Kordi I m fl (1979) Energieffektivitet för person och godstran sporter i Sverige. Transportforskningsdelegationen l979:1 Stockholm.
Mitchell CGB (1981) The influence of the car on personal travel. TRRL supplementary report 681.
Mogridge MJH (1981) A proposal to save energy: intuition and counter intuition in the use of petrol. Paper presented to the 9th Annual Summer Meeting of PTRC, University of Warwick, July 1981.
OECD (1982) Automobile fuel consumption in actual traffic con ditions.
Oldfield RH (1980) Effect of fuel prices on traffic. TRRL Supp lementary report 593.
Roumegoux JP et al (1979) Consommation d'energie par la circula-tion routiére. Institut de Recherche des Transports-CERNE, Note d'information. No 14, Lyon.
Tanner JC (1982) International Comparisons of cars and car usage. TRRL supplementary report 681.
Thomson JM (1972) Methods of traffic limitation on urban areas. Working Paper no 3. Environment Directorate. Paris OECD. TPR 1982:2 Arbetsresorna i Sverige. Transportrådet, Stockholm.
(2)
LITTERATURE LISTWagner FA (1980) Energy Impacts of Urban Transportation
Improvements. Institute of transportation engineers. Alexandria, Virginia, U S A.
Walters, MHL and Laker IB (1980) Research for fuel conser
vation for cars. Department of Transport, Depart
ment of Environment. TRRL LR 921. Crowthorne.
Ward's Automotive Yearbook 1977 and 1980.
Zimmerman C (1981) A Life Cycle of Travel by the American Family. Report 7. 1977 Nationwide Personal Transpor