Héctor Treviño Cantú
Life-Cycle Cost Analysis for
Offshore Wind Farms:
Reliability and Maintenance.
O&M Cost Drivers Analysis
Master’s Thesis
Spring 2011
Héctor Treviño Cantú
Life-Cycle Cost Analysis for
Offshore Wind Farms:
Reliability and Maintenance.
O&M Cost Drivers Analysis
Master’s Thesis
ii
Life-Cycle Cost Analysis for Offshore Wind Farms: Reliability and Maintenance. O&M Cost Drivers Analysis
Author:
Héctor Treviño Cantú
Supervisors:
Thomas Stalin, Vattenfall Vindkraft AB Stefan Ivanell, Gotland University
Examiner:
Jens Nørkær Sørensen
Department of Wind Energy
Gotland Univeristy Cramérgatan 3, 62157 Visby Sweden
Tel: (+46) 49 82 99 900
This thesis is a part of the requirements to achieve the Master’s of Science in Wind Power Project Management at Gotland University. The report represents 15 ECTS points.
ABSTRACT
Operations and maintenance (O&M) activities represent a significant share of the expenses during the lifetime of offshore wind farms. When compared to onshore wind farms, O&M costs are increased for the offshore case, as specialized vessels, weather windows and rough conditions mean more failures, downtime (decreasing availability), spare parts, and man-hours.
This study comprises an analysis of the available O&M data from a selected offshore wind farm. The results and conclusions from this investigation could then be used to evaluate possible reliability improvements and compare options for the maintenance strategies, as well as to ponder the convenience of warranty periods and O&M agreements between wind farm operators and wind turbine manufacturers or O&M service providers.
The life-cycle cost (LCC) concept is utilized in the analysis of the wind farm survey for this thesis. LCC analysis could be the starting point to make decisions regarding specific wind turbine models, as selecting the turbines with the lowest initial cost may not be necessarily the scenario which also costs the least amount of money when taking into consideration the whole life cycle. It may also be a great tool to forecast future operational incomes and expenses of offshore wind farms.
Keywords: Offshore, wind farm, operations, maintenance, O&M, life-cycle cost, reliability.
ACKNOWLEDGEMENTS
I would like to extend my sincere gratitude to the people who helped me during the time this study took place in Vattenfall Vindkraft, particularly to François Besnard, Pär Attermo and Thomas Stalin, as well as Ulla Pettersson from e-for-energy Consulting for their valuable feedback and interesting discussions.
I am grateful to the staff from Gotland University’s Wind Energy Department, especially to Richard Koehler and Stefan Ivanell for their encouragement and support.
Special thanks to my friends in México, the ones spread around the world, and the great people I met in Sweden.
Finally, I owe my deepest gratitude to my family, whose love and support follow me to anywhere I go.
TABLE OF CONTENTS
Abstract ... iii Acknowledgements ... v List of figures ... 1 List of tables ... 3 Abbreviations ... 5 1 Introduction ... 7 1.1 Background ... 8 1.2 Problem statement ... 81.3 Method, delimitations and assumptions ... 9
2 Theory and concepts ... 11
2.1 Wind Power Plant Basics ... 11
2.2 RDS-PP ... 15
2.3 Reliability and Maintenance ... 15
2.4 Maintenance methods and strategies ... 17
2.5 Life-Cycle Cost Theory ... 18
3 Analysis ... 19
3.1 Initial considerations ... 19
3.2 Service orders and spare parts analysis ... 21
3.3 Monthly report analysis ... 28
3.4 Failure/event created database ... 29
3.5 Aggregate analysis ... 32
3.6 Data from other sources ... 32
3.7 LCA Calculator input ... 32
4 Results and discussion ... 35
5 Conclusion ... 39
5.1 Insights ... 39
5.2 Recommendations ... 39
5.3 Next steps ... 39
References ... 41
A RDS-PP simplified Vattenfall Table ... 43
LIST OF FIGURES
Figure 1-1 New installed capacity and de-commisioned capacity in EU 2009
[1] ... 7
Figure 1-2 Overview of cost of wind energy and its relation to O&M [2]... 8
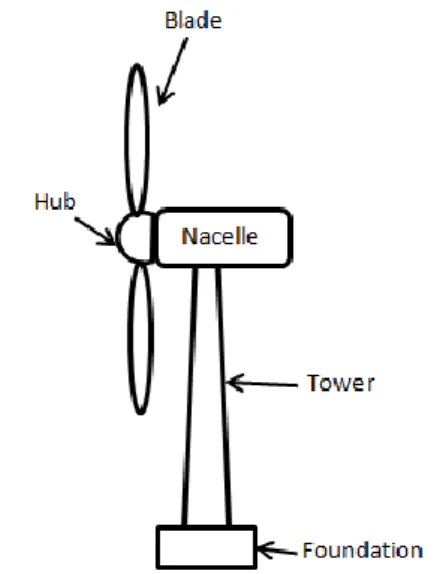
Figure 2-1 Main components of a wind turbine ... 11
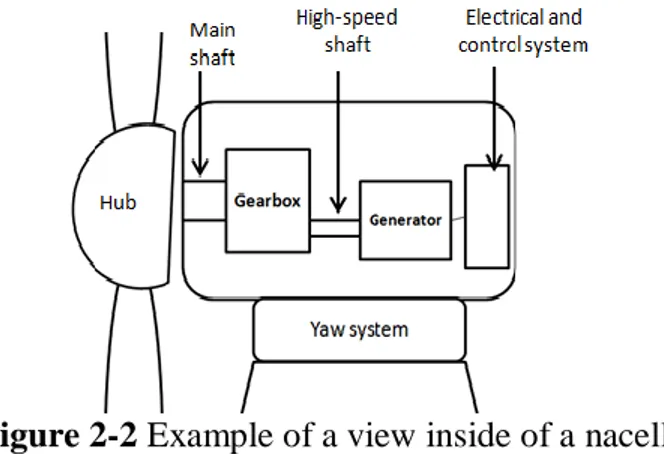
Figure 2-2 Example of a view inside of a nacelle ... 13
Figure 2-3 Maintenance classification... 16
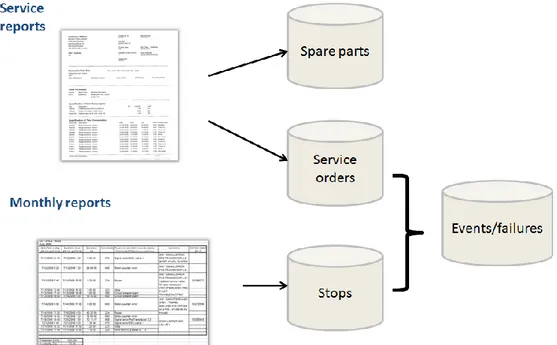
Figure 3-1 Graphical explanation of sources and databases ... 20
Figure 3-2 Number of Monthly Service Reports ... 21
Figure 3-3 Annual service orders per turbine ... 21
Figure 3-4 Manhours vs Service Orders ... 22
Figure 3-5 Type distribution evolution ... 23
Figure 3-6 Type distribution: service orders (left) vs manhours (right) ... 23
Figure 3-7 Total manhours vs cumulative service order occurance by subsystem... 25
Figure 3-8 Spare parts cost distribution by type of service ... 25
Figure 3-9 Spare parts cost distribution by system ... 26
Figure 3-10 Spare parts costs in main (yearly) service ... 27
Figure 3-11 Monthly average stops and downtime per turbine ... 29
Figure 3-12 Monthly events ... 30
Figure 3-13 Event distribution by subsystem ... 30
Figure 3-14 Downtime distribution by subsystem ... 31
Figure 3-15 Event type frequency (left) and downtime (right) ... 31
Figure 3-16 Snapshot of general input data for LCA Calculator ... 32
Figure 3-17 Snapshot of failure data input for LCA Calculator ... 33
Figure 3-18 Snapshot of fault type class data input for LCA Calculator ... 33
Figure 4-1 Distribution of NPV costs with warranty, insurance and maintenance contract ... 36
Figure 4-2 Example of result graph for operational costs ... 36
Figure 4-3 Example of result graph for operational costs excluding serial failures ... 37
LIST OF TABLES
Table 2-1 Maintenance Activity Codes ... 17
Table 3-1 Service orders type and activity distribution break down ... 24
Table 3-2 Relative changes: Year 1 to Year 2 ... 26
Table 3-3 Average manhours and spare costs for main service ... 28
Table 4-1 Example of selected LCA Calculator results ... 35
Table A-0-1 RDS-PP code and descriptive text of power plant components (simplified use at Vattenfall): ... 43
ABBREVIATIONS
DFIG Doubly-Fed Induction Generator
ECN Energy research Centre of the Netherlands
IRR Internal Rate of Return
LCA Life-Cycle Analysis
LCC Life-Cycle Cost
NPV Net Present Value
RDS-PP Reference Designation System for Power Plants SCADA Supervisory Control And Data Acquisition
1
INTRODUCTION
As wind energy has been one of the fastest growing energy sources in the last years, new technologies appear, bringing more challenges for the development and operation of wind farms. Because of the limited land in some cases, and better conditions regarding social acceptance and subsidies, wind power development has been expanding to offshore sites. This allows -and encourages- for larger turbines and wind farms. Along with the positive aspects, mainly the increased rated power, larger turbines and offshore wind farms also bring new thoughts to worry about, such as transportation vessels, adequate ports, weather windows, greater fatigue/loads and corrosion.
Introduction
8
1.1
Background
Being a young industry, wind turbine manufacturers and operators are still figuring out better strategies for the optimal operation and maintenance of the offshore wind farms around the globe. Although onshore wind energy is already being competitive with other sources of energy, the increased cost of construction for offshore wind farms (up to 50 % more) is not the only extra burden. Operation and maintenance costs are also increased for the offshore case, as specialized vessels, weather windows and rough conditions mean more failures, downtime (decreasing availability), spare parts, and man-hours.
Figure 1-2 Overview of cost of wind energy and its relation to O&M [2]
1.2
Problem statement
The objective of the research is to collect and analyze the available O&M data from a selected offshore wind farm. The results and conclusions from this investigation could then be used to evaluate possible reliability improvements and compare options for the maintenance strategies at the end of the warranty period of the wind farm. Moreover, it could provide basis reliability and O&M data for evaluating future offshore projects.
Introduction
1.3
Method, delimitations and assumptions
The report first presents a brief explanation of the relevant theoretical and technical concepts that will be used for the analysis.
The main focus of this thesis is based on what can be extracted from different data sources. The data used as input for the analysis mostly comes from documents in pdf files of captured images of the original service reports and electronic files of monthly reports prepared by the wind turbine manufacturer. These files have been processed into structured databases that can be used as an input in an economic model in Microsoft Excel that is being developed at Vattenfall. Along with these databases, knowledge from interviews with experienced relevant personnel has also been used. Other important listings were also prepared, such as the spare parts along with their costs, to further analyze possible scenarios.
Though the ideal scenario would be to get all the operational data available, it is a long process to prepare the data when not specially registered for field-specific examinations. Because of the time-constraints, the scope has been limited to two operation years of the selected wind farm.
It should be considered that the conclusions from this report are mostly based on the different analyses of the structured databases. This approach might leave out important deviations that come from the source of data, such as inconsistent data capturing or systematic overwriting from the operating remote systems.
The study has been performed on a selected wind farm, but a number of results are treated as relative values and some details are not specified in this report to comply with confidentiality terms. Nevertheless, the raw data and absolute numbers are available to the sponsor of this thesis: Vattenfal Vindkraft AB.
2
THEORY AND CONCEPTS
This chapter intends to give an overview of basic concepts for the Life-Cycle Cost analysis of an offshore wind farm. First, the basic systems and components of a wind turbine are described, followed by a brief note of the power plant classification system used later on for the analysis. Thereafter, an overview of reliability and maintenance concepts is presented, then complemented by Life-Cycle Cost theory explained in a wind farm context.
2.1
Wind Power Plant Basics
Following the expansion of the wind energy industry, wind turbines have emerged as an important power generating system. Constantly described as a young industry, the already challenging environment for the wind turbine manufacturers and wind farm operators, becomes even more important when looking at the offshore wind turbines.
Most of the electricity currently produced from wind energy, comes from horizontal axis, three-bladed wind turbine generators. The offshore scenario is not an exception, having also limited options as not all the wind turbine manufacturers offer models for the offshore market. A brief overview of the main systems and components of wind turbine generators (WTG) will be addressed in this section.
Theory and concepts
12
2.1.1 Foundation
The foundations that a wind turbine is mounted on play a quite important role for their proper function. They must keep the turbine from tipping over while also carry the weight of the tower, rotor and nacelle. They are especially transcendental for the offshore wind farms, as the site´s conditions such as wind speed, depth, wave height and soil type can define which type of foundation is the best suited for each particular case. The most common type of foundations for offshore wind turbines are the monopile, jackets, tripods and gravity foundations. Newer innovative concepts such as floating wind turbines are being tested in pilot projects, but still haven´t been used for wind farms.
2.1.2 Tower
Most towers are conical tubes made of steel. They rely on the foundations and must carry the nacelle and the rotor. For the offshore wind turbines, the lower parts of towers must be designed to endure the ocean´s conditions and avoid corrosion. The towers normally have an access at ground level (sea-level for offshore cases), and generally you can find control systems and electric equipment inside. A ladder or elevator make it possible to go up through the tower to the nacelle.
2.1.3 Rotor
The rotor consists of the hub and the blades. The blades take kinetic energy from the wind and start moving, then turning the hub that will do the same with the shaft inside the nacelle. Because of visual acceptance and convenient efficiency, most commercial wind turbines use three-bladed rotors. The blades are generally made from light yet sturdy materials such as fiberglass, epoxy, wood and carbon fiber. For the turbines with pitch control, the rotor includes the actuators for this system.
2.1.4 Nacelle
The unit mounted on top of a wind turbine tower is called the nacelle. Inside the nacelle there is the gearbox, generator and other mechanical and electrical components [3]. There is a yaw motor that controls the motion of the nacelle in relation to the tower, aligning it accordingly to the wind direction. In the nacelle there is also the main shaft with the main bearings, a generator and the gearbox, as well as the emergency brake. On top of the nacelle, wind-measuring devices such as anemometers are mounted.
Theory and concepts
Figure 2-2 Example of a view inside of a nacelle
2.1.5 Drive train
The drive train is where the mechanical energy provided by the hub is converted into electricity. It consists of the shafts between the hub, the gearbox and the generator. The main shaft connected to the hub rotates with low speed, which is then processed by the gearbox, having as an output the high-speed shaft, which then is connected to the generator.
2.1.6 Gearbox
The gearbox converts low-speed rotational speed from the main shaft to high-speed rotational speed that must be fed into the electrical machine for further conversion into electrical power. The main types of gearboxes found are parallel shaft and planetary. Because of the constant movement and friction, they require regular lubrication.
2.1.7 Generator
For wind turbines, two main types of generators are used: induction generator and doubly-fed induction generator (DFIG). These cases mostly apply for gearbox technologies, as other alternatives can be used for gearless WTGs. These electrical machines transform mechanical energy into electrical power. It is connected to the electrical system and supplies the produced electricity into it.
2.1.8 Electrical system
The electrical power produced by the turbines and that is fed into the grid, must comply with certain values of frequency and voltage. For this, converters and transformers may be needed. The transformers increased the voltage and decrease the current of the electrical input that goes into the grid. They are normally at the bottom of the tower, and for wind farms it is common to have a transformer substation collecting the power and later on feeding into the grid.
In modern wind turbines, the properties of the electric power that is fed into the grid can be governed by power electronics to achieve the phase angle and reactive power that the
Theory and concepts
14
2.1.9 Control system
Turbine manufacturers and wind farm operators monitor the operation and control of a WTG on-line. When something malfunctions, alarms are triggered to alert the people managing the site. The Supervisory Control And Data Acquisition (SCADA) is a widely used control system in the wind energy sector. It relies on alarms triggered when the sensors on the turbine detect any extraordinary activity. It also allows checking operational data, which in turn can be analyzed and used by the operators to decide if any service might be relevant. This system makes it possible to reset remotely the operation of the turbine, in cases where specific alarm codes might suggest it necessary.
Components such as wind measurement devices and elements related to Condition Monitoring System (also referred as vibration guard), are classified as part of the control system.
2.1.10 Safety system
It is essential to be able to stop the WTG from functioning, when service and maintenance must be performed. It is normally forbidden to have the turbine operating while there is any person performing any type of inspection or repair.
For this, both aerodynamic and mechanical brakes are part of the wind turbine system. When the pitch system is used as a part of the braking system it shall be considered as part of the protecting system and evaluated as such [4]. The pitch system is based on the principle of pitching the blades, as to have an angle of attack of the wind in which less energy can be extracted. Mechanical brakes are installed in the drive train, either using discs or springs to hinder any movement.
When the turbine must be stopped, but for problems with the grid and the transmission or electrical power rather than mechanical problems, circuit breakers come into play. They are installed between the generator and the connection to the grid. In case of failures or short circuits, they disconnect the turbine.
Other elements considered as part of the safety systems include fog signals, naval, warning and aviation lights.
2.1.11 Hydraulic system
The pitch and yaw systems, as well as the mechanical brake, require a hydraulic system. Components of this system include pumps, pressure valves, tanks and filters. As this
Theory and concepts
system utilizes change in pressure principles, it is not uncommon to find sludge and oil leaks that later may cause other failures in the wind turbine system.
2.2
RDS-PP
Throughout the study, the Reference Designation System for Power Plants (RDS-PP) is used. It results from further development of the successful KKS Identification System for Power Plants [5]. This classification system is rather new, and provides standardization of power plants, including newer technologies such as wind power plants. For this reason, it was decided to use this classification system for the failure analyses in this study. The table in Appendix A shows the relevant RDS-PP codes for the correspondent components of a wind power plant (Vattenfall simplified version).
2.3
Reliability and Maintenance
One of the main issues regarding the technical and economical feasibility and convenience of wind farms into power systems is the risk of insufficient reliability. Measures have to be taken to ensure that wind power variations do not reduce the reliability of power systems [6]. When looking in-depth only into a wind farm, the reliability of its operation greatly depends on the proper function of its wind turbine generators. A better understanding of the WTGs components and a more precise forecast of the potential failures can lead to an improved operation of the wind farm.
2.3.1 Definitions
Reliability is the ability of a component or system to perform required functions under stated conditions for a stated period of time [7].
Failure is the event when a required function is terminated, while fault is the state of an item characterized by inability to perform a required function, excluding the inability during preventive maintenance or other planned actions, or due to lack of external resources [7]. It could be implied that a failure could then provoke a fault. During this thesis, failures will be the main focus. To be clear about failures, they will be also referred and treated as events.
Maintenance, being the combinations of all technical and corresponding administrative actions, including supervision actions, intended to retain an entity in, or to restore it to, a state in which it can perform its required function [7].
2.3.2 Maintenance types
Theory and concepts
16
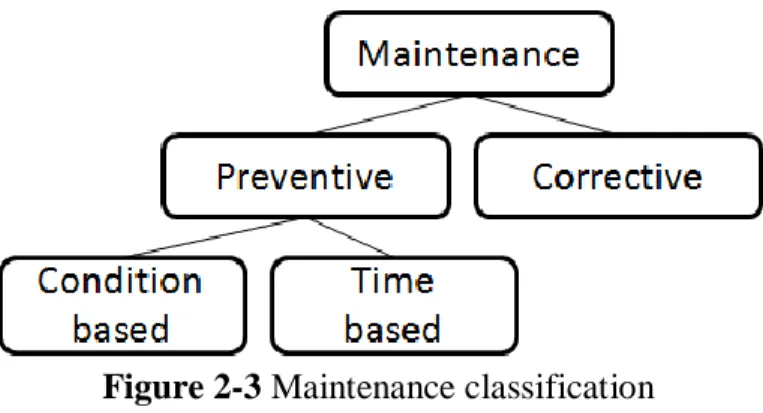
Figure 2-3 Maintenance classification
For this analysis, a classification internally proposed by Vattenfall is used: corrective, modification, extra-preventive, and scheduled maintenance.
Corrective maintenance is when a service is carried out after a failure, with the purpose of bringing back the item into a functioning state. Usually means repairs and/or replacements are needed.
Modification or retrofit refers to the additions or replacements of newer models of items or technologies. These actions could also be thought of updates, with the objective of improving the performance and/or functions of the items.
Extra-preventive maintenance refers to extra condition or functional checks not originally included in the maintenance plan.
Scheduled maintenance includes any planned activities, such as main services, specific certifications, and audits.
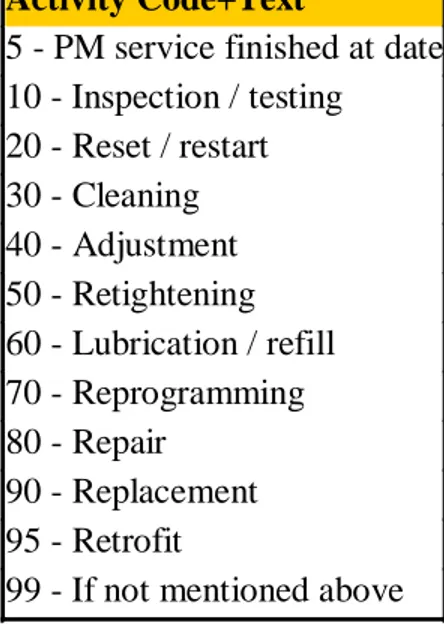
2.3.3 Activity types
Besides classifying each event or service provided according to the description given in the service order from the manufacturer, they have also been divided into different types of activity. This field was intended for a better description of what each service implies, regardless of the type of maintenance. The possible activity types are listed in Table 2-1.
Theory and concepts
Table 2-1 Maintenance Activity Codes
2.4
Maintenance methods and strategies
Preventive maintenance, though performed on a regular basis and with scheduled activities, can follow different approaches.
Age-based maintenance: when the service is carried out at a specific age of the item. For wind turbines the age concept most likely refers to time in operation, as compared to other contexts in which other time concepts may apply.
Clock-based maintenance: when the maintenance is carried out at specific calendar times. This is applicable especially for offshore wind farms, as weather conditions and seasons greatly affect the weather windows to reach the site.
Opportunity maintenance: when maintenance tasks to other items or components of the system are done, or the system has a shutdown which provides an opportunity for carrying out maintenance on other items that were not the cause of the failure.
Condition-based maintenance: based on measurements of condition(s) of the items. When the measurement indicates that the item is out of the acceptable range, then the maintenance action is performed.
Activity Code+Text
5 - PM service finished at date 10 - Inspection / testing 20 - Reset / restart 30 - Cleaning 40 - Adjustment 50 - Retightening 60 - Lubrication / refill 70 - Reprogramming 80 - Repair 90 - Replacement 95 - Retrofit
Theory and concepts
18
2.5
Life-Cycle Cost Theory
The Life-Cycle Cost (LCC) will be the base utilized in the analysis of the wind farm survey for this thesis. Life-Cycle Cost is defined as the sum of all costs incurred during the lifetime of an item, including total procurement and ownership costs [8]. In a wind farm context, a simple way of explaining the relevance of the LCC concept is knowing that a specific wind turbine model with the lowest initial cost may not be necessarily the one which also costs the least amount of money in the long run. Operations and maintenance costs come to mind, as they can even exceed the acquisition costs.
2.5.1 LCC applications in a wind power context
The outcomes from the LCC analysis for wind farms may not only be useful for structuring operations and maintenance strategies, but also to develop a better understanding of the different wind turbine options, and complement the procurement analysis when thinking of new wind farms. It may also be a great tool to forecast future budget needs.
2.5.2 LCA Calculator
An LCC model for offshore wind farms has been developed at Vattenfall. The model is based on a calculator developed by Energy research Centre of the Netherlands (ECN) to estimate yearly Operation and Maintenance (O&M) costs [9]. The input data for the LCC model includes component failure rates, maintenance strategies, maintenance procedures and maintenance support structure (vessels, staff, equipment, spare parts), as well as warranties and insurance expenses that can influence the operations and maintenance costs.
3
ANALYSIS
This chapter intends to examine the data regarding the operations and maintenance activities carried out for the wind farm subject to study. First, considerations and perspectives will be explained, as well as the story behind each database. Then the analysis will be addressed by each data source, with a final aggregate view which will be then linking to what can be concluded.
3.1
Initial considerations
The outcome of these analyses should be taken with special care, as the sources can cause some bias in the results. Service orders are filled in by the technicians in charge of the maintenance activities. These service orders do not necessarily follow the storyline that the downtime summaries, which come from SCADA reporting, might be portraying for the wind farm. In other words, though a service order might report that on January 15 an inspection was done at turbine A-3, the monthly report might not show that there was any downtime during that time lapse.
The data may not necessarily represent precisely what has been happening in the wind farm in reality, but it can still give us interesting insights on the way resources are being spent. Knowing this, a series of different break-downs is presented.
3.1.1 Performance indicators
Wind power is a unique energy source, as for the cost and efficiency analysis, a different approach must be taken, in comparison to other types of power plants. For instance, the conversion efficiency is not as relevant because the fuel, which is the wind, is free. What matters is the cost-efficiency. Some ratios such as cost of production or investment per year are being calculated to measure and compare the different wind farms’ performance. It is along this reasoning that this thesis will try to analyze the operations and maintenance costs, trying to relate indicators based on installed MW or kWh, and not as absolute costs that could greatly vary depending on the size of the turbines and/or wind farms. Nevertheless, the analysis will start with basic numerical
Analysis
20
However, the first steps will be to explore the absolute and relative values of variables such as the number and/or cost of events, service orders, man-hours and spare parts.
3.1.2 Database sources
It is common that the first years of the lifetime of a wind farm, the operations and maintence services are included as part of the warranty period, which most commonly ranges from 2 to 5 years. The original service order reports as managed by the turbine manufacturers can provide useful information, such as manhours reported for each specific case, spare part consumption, and description of the failure and/or service executed at the turbine.
Another source that was taken in consideration is a set of monthly reports handled from the manufacturer to the operator. These reports commonly detail any failure or downtime for every turbine, graph the availability, and present follow-ups of retrofit activities, among other concepts.
The subject of analysis is an offshore wind farm, and the period covers two years of its operations. For the spare parts cost analysis, the price estimation process involved prices given by the manufacturer when suggesting spare parts and consumables for frequent services for the wind farm subject of study, prices given by the manufacturer for spare parts for the same wind turbine model but for other wind farm, prices given by the manufacturer for similar wind turbines in other wind farms and educated guess or estimation from a Senior Offshore Project Manager [10].
Analysis
3.2
Service orders and spare parts analysis
3.2.1 General examination
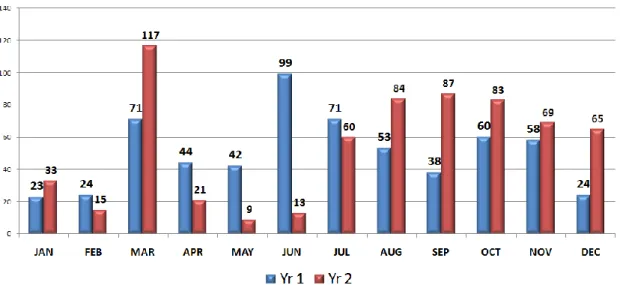
The first value to look at was the total number of service orders. It was noted that for the second year, there was an increase of 8 %. The following figure shows the monthly distribution of the service orders for the two years. June is a month to further look into, as there is a significant drop of service orders from one year to another.
Figure 3-2 Number of Monthly Service Reports
A break down of service orders per turbine was graphed, to try to detect if there is any problematic turbines or major differences in the amount of services, hence work, that must be put into the WTG. Figure 3-3 shows no major patterns, with perhaps some curious jumps from one year to another in some turbines, such as C1.
Analysis
22
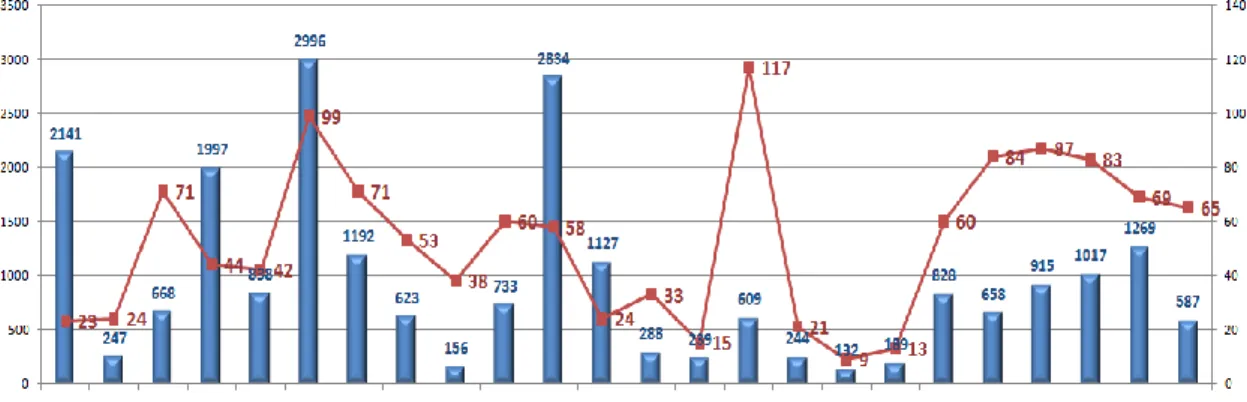
But raw values might be deceiving, so when trying to look at several numbers there might be more of an idea of what can be a relation or a lack of it. A graph putting together the relation between the monthly manhours and service orders during the two year period on study, tells us that there is no direct correlation or pattern suggesting that more service orders equals more manhours. This means there are in existence significant services, such as gearbox exchanges, which can take more the 500 hours; but there is the other side which could mean many service orders which represent an hour or half of it of manpower.
Figure 3-4 Manhours vs Service Orders
The previous graph might be better understood by further looking into the data and knowing that the first year of analysis there were more gearbox exchange activities. That is why the total number of manhours decreased drastically for the second year. The peak in number of service orders during March of the second year might suggest either a troublesome month with fast maintenance services needed, or a possible malpractice of accumulating services and reporting them in batches, instead of having the real dates.
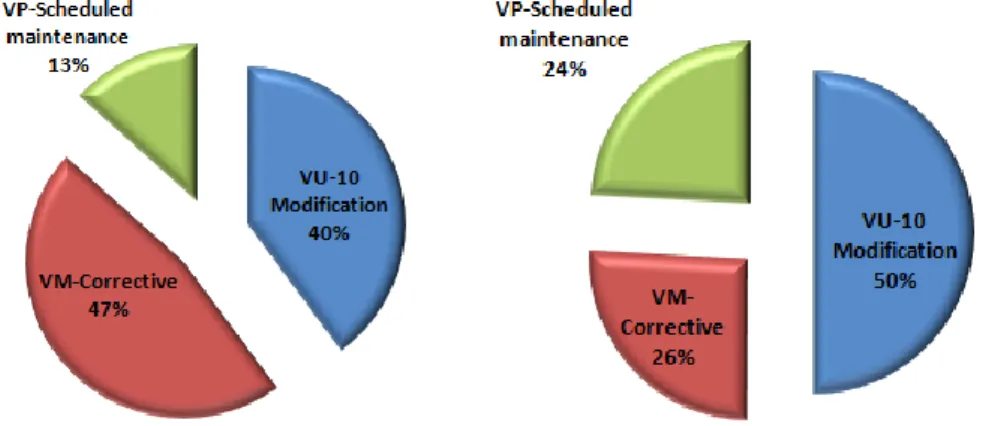
Since the data was not classified in the raw data, part of the manual data processing included assigning an activity and type tag to each one of the registries. From
Figure 3-5, when looking at the type of service, the corrective maintenance services have an important and increasing share, from around a 40 % to a figure over 50 %. A first target should be to reduce the amount of these services, which would mean there is less failures and unplanned downtime. Having the planned or scheduled services as the least common only means that there is much work to be done to get to a better operational practice for the offshore wind farm. Nevertheless, the high number of modifications, or retrofits, is common in this context, as offshore wind farms are a rather new and still developing type of power plant. Also, during the time period
Analysis
analyzed, the turbines were still under the warrenty period. As technological developments from manufacturers, along with experience from the operators start to find the best practices in this industry, retrofits should be decreasing.
Figure 3-5 Type distribution evolution
Knowing that corrective maintenance services are increasing, it is important to analyze not only the number of services, but also the implications of the manhours that are needed. The following pie charts, comparing the type distribution in terms of number of service orders with the manhours used, suggests that the retrofits might be for the most part short, fast services. On the other hand, the scheduled maintenance activities, which refer to main services and regular certification inspections, account for one third of the manhours reported during this two-year period.
Analysis
24
While the type of maintenance can give an idea of what is being done to the turbines, a more descriptive field, the activity, was also assigned during the data processing. Table 3-1 shows that most of the corrective services are replacements or inspections, followed by lubrication issues. As there are a variety of possible activities, there is a concentration on specifics regarding retrofits, mostly being replacement of components, testing and some cases of reprogramming which were software upgrades. A better classification would be achieved if more details were provided consistently in the service reports, as some of the inspections might have actually been other activities such as adjustements or repairs, but if not noted, they were just left as inspection.
Table 3-1 Service orders type and activity distribution break down
TYPE ACTIVITY %*
VM-Corrective 10 - Inspection / testing 31% 20 - Reset / restart 0%
30 - Cleaning 1%
47%
60 - Lubrication / refill 40 - Adjustment 5% 9% 70 - Reprogramming 1%80 - Repair 4%
90 - Replacement 48% 95 - Retrofit 0% 99 - If not mentioned above 1% VU-10 Modification 10 - Inspection / testing 36%
40 - Adjustment 1%
40%
70 - Reprogramming 90 - Replacement 13% 39% 95 - Retrofit 13% VP-Scheduled maintenance 5 - PM service finished at date 83%13%
10 - Inspection / testing 40 - Adjustment 8% 8% *Values are rounded, so 0% represents some cases, which on relative values become negligible.After looking at how the service orders are distributed, depending on the month, turbine, type or maintenance activity, it becomes necessary to start to look at the subsystems and components that might be requiring these services (See Appendix B for the breakdown classification of the subsystems into RDS-PP codes). Figure 3-7 reveals that 60 % of the service orders are grouped in 5 subsystems: ancillary systems, control equipment, pitch, gear and hydraulic system. Gear stands out on the manhours employed, as expected, due to the gearbox exchanges throughout the wind farm. The other field with a high value of manhours is the WTG system, which refers to the main services mostly.
Analysis
Figure 3-7 Total manhours vs cumulative service order occurance by subsystem
For the spare parts analysis, the major exchanges such as the gearboxes and generators where left out. This was decided because their high prices would not add value in analyzing a comparable scenario for what the real operational activities on an ideal year (with no major component exchanges).
The spare parts cost distribution appears to follow the manhours behavior, as shown in the chart below. Corrective actions take a 45 % of the spare parts cost, while the scheduled services represent one third of the expense in components.
Analysis
26
When looking further into which systems are the ones requiring more replacements or consuming more materials, the following figure clarifies that main services and maintenance activities regarding the pitch system are more than 50 % of the spare parts cost.
Figure 3-9 Spare parts cost distribution by system
For a better understanding of the operational practices, the differences from one year to another might prove helpful. In this case study, the summary of changes can be put into a simple table as shown below. Though the number of service orders increased, manhours and spare parts expenses decreased during the second year. Naturally, the average time for a service order in manhours dramatically decreased from 26 to 11 hours.
Table 3-2 Relative changes: Year 1 to Year 2
Value evolution
Manhours ↓ 66%
# orders ↑ 8%
Manhours/ order ↓ 59% Spare parts expenses ↓ 45%
3.2.2 Case focus: main (yearly) service
As it is one of the most frequent maintenance activities that occur on the wind farm, a specific examination into the main service will be conducted. Important differences in the spare part costs and manhours needed in this service can only mean that there is still
Analysis
a necessity to understand the way the WTGs would be better managed, as this should be the one standardized activity.
An interesting fact that came out of the data analysis is that the main service is ranked in the top 10 most expensive activities, when looking at the spare parts average cost only. Any improvement in this service would mean reduction on what can be considered a fixed cost for each and every turbine.
When comparing the cost of spare parts and consumables used for each service report, it can be noticed that for the second year of analysis, there was a reduction in the average Euros spent. It must also be noted that the first year had quite large variations in the spare parts expenses in main service depending on the turbines. The following graph shows how a service could be between 2.000 to almost 10.000 EUR. Year 2 presents a more standardized fashion, keeping a regular cost.
Figure 3-10 Spare parts costs in main (yearly) service
The reasons for the outliers and the variations in costs for the first year were looked into the data. The items that can be blamed for these differences are brushes for the gear, fan units with filter and water pumps. This finding suggests that some replacements took place along with the main service, but just for specific turbines. More information would be useful, as to know if the need for the new components could be treated as an extra-preventive service, and also to know if similar replacements might be soon needed in the other turbines. Nevertheless, the service orders just list the items and until the analysis is done, they might not stand out as a different service.
Analysis
28
Putting the trend analyzed by the previous graph into average numbers, it is a simplified conclusion to say that the spare parts costs were reduced from year 1 to year 2. When looking at the average manhours employed, as registered by the service orders, a reduction can also be noticed. The following table summarizes the average values for the two years:
Table 3-3 Average manhours and spare costs for main service
The 14 hours reduction in manhours can be simply thought of as one day less needed for the service, which can also imply reducing one trip needed from the vessel. This is a quite simple assumption, as it can vary depending on the number of technicians needed at the same time and the convenience of the vessel trips planning according to the capacity and other factors such as weather windows. In a broader perspective, all these time savings can later have an impact in the availability, and hence in the production income. Converting the 14 manhours into Euros, by using the estimated value of 93 EUR/hr for labour cost [10], the improvement means approximately 1 300 EUR saving per turbine, that when added to the 1 500 EUR savings from spare parts, sums up to more than 2 800 EUR saved per turbine (only direct savings, without considering other inherent costs like vessels and production losses).
3.3
Monthly report analysis
The monthly report delivered by the wind turbine manufacturer contains detailed information on any relevant status for each wind turbine. It summarizes in a general wey activities carried out in the wind farm, presents availability charts, follow-ups on retrofit plans, weather window tables, among other things. The data used for this study was the downtime summary. It is a list of each time that any turbine was stopped, detailing time of stop, time of run, downtime, reason for downtime, comments and service orders related to each stop. When looking at different samples, it was noticed that the event codes and reasons are not really describing reasons for downtime as such. Instead, they are mostly named “New service” or “Emergency stop”, and it is in the comments that a more descriptive manual input can be found. Some cases have one or several service report numbers assigned to them, but it is a task not done automatically, but someone from the manufacturer goes through these records and manually decides what to put in the comments and service report fields.
Because the main focus of this study is on the maintenance activities, for the monthly reports analysis the main values into scrutiny were downtime and number of stops. The
Analysis
availability charts are already available for analysis, so new insights come from a different perspective on this part. The graph below shows that no significant pattern or correlation between the number of stops and the downtime can be inferred. In other words, more stops do not necessarily mean more downtime.
Figure 3-11 Monthly average stops and downtime per turbine
3.4
Failure/event created database
For a more detailed and perhaps more real way of depicting how things happen in a wind turbine, a new database with human input was created. The human factor was to decide, based on several factors such as the proximity and duration of each downtime record, if they belonged to the same failure event.
When graphing the number of events to try to compare the monthly behavior from the two years in this study, a similar pattern can be noticed for the late part of each year. On the other hand, while it can be noted a big jump during March of the second year, the events distribution is quite different when compared to the service orders numbers.
Analysis
30
Figure 3-12 Monthly events
Looking at how the events were distributed in terms of subsystem, the mayor occurrence were for the gear and pitch systems. These were followed by the wind turbine system, which refers mostly to the main or yearly services. These three subsystems account for more thatn 40 % of the events.
Figure 3-13 Event distribution by subsystem
When analyzing not the occurrence but the downtime, the gear and the generator account for moe than 70 % of the time. When having a problem related to either the gear or the generators, it can be expected to have the turbine out of function for longer
Analysis
periods of time. In terms of costs, it could be said that from a production point of view, the gear and the generator troubles are the main concerns in this wind farm.
Figure 3-14 Downtime distribution by subsystem
Although the most frequent reason for stopping a turbine might be due to a corrective action, what is taking longer to solve, or keeps the turbine not producing for a longer period are the retrofits. Fifty porcent of the downtime is due to a modification service, and a low 5 % of downtime is assigned to the scheduled activities. This can be explained by the contract agreements in which the manufacturer commits to a maximum downtime for main or yearly services, which encourages the team of technicians to prioritize the fulfillment of the service in a timely manner.
Analysis
32
3.5
Aggregate analysis
Each separate analysis might suggest different things, but it is important to take what is thought of the best outcome from the combinations that are possible. As an example, the spare parts analysis concluded that main services are expensive maintenance activities. On the other hand, from the event database it can be inferred that the gear and generator systems are responsible for most of the production losses, which also represent economic costs.
3.6
Data from other sources
There was a necessity to get data from the relevant department of in this case the wind farm operator, which sometimes was in a form of a direct interview, but other times could be an email or even from previous presentations. Examples of these data inputs include the costs (both fixed and variable) for the vessels being used at site, cost of the hourly rate of a technician, and insurance payments. These figures are also very important, but the focus of this study is in the reliability and maintenance, which relies for the most part in the failure frequency. Hence, the main analysis goes into depth on these variables.
3.7
LCA Calculator input
The main input to the Life Cycle Analysis (LCA) Calculator are the failure frequencies, classified according to the system and subsystem (or RDS-PP code) and with the educated guess of what kind of vessels and equipment might be needed. As it is not the intention to give an in-depth description of the model developed at Vattenfall, and to avoid getting into confidential details, only a brief overview of the input data is addressed.
General input data includes the rated power of the wind turbine model, capacity factors according to the season, kWh price and investments costs. All of these fields were put into the file, some of them being calculated from performance data like the capacity factors, and others given by interview of a Senior Offshore Project Manager [10].
Analysis
The most detailed data input for the model is the one specifying the wind turbines’ systems, subsystems and a description of failures. Each failure also should have a frequency value, as well as material costs. These data is the result of the analyses addressed in the previous chapter. The figure below shows a snapshot of this part of the data input of the LCA Calculator.
Figure 3-17 Snapshot of failure data input for LCA Calculator
Other relevant modules of data input within the LCA model include a sheet in which different combinations of the equipment needed for a service are listed. These combinations, called fault type class, consider the type of vessel, time needed for the service and if cranes are also required, among other factors. See a snapshot exemplifying this in the figure below.
4
RESULTS AND DISCUSSION
Gathering more than 1 300 service order reports and putting them together to find out how things evolve over time proved an interesting task. It is necessary to understand where the data comes from, in terms of the process to get to a number finally used as input for the model, to better interpret what the different results suggest.
Provided that the LCA model seeks to break down several economic indicators, such as the internal rate of return (IRR) or the break-even year, the results suggest the project evaluation with the selected input. In this case, the failure frequencies are based on actual data from two years, but it should also be noted that a major assumption on having to change gearboxes and generators after 10 years is used.
The figure below presents only a part of several listed results. The main analyses in this study were focusing on the O&M activities, which turned out to represent almost 39 % of the cost after it was levelized considering the complete life-cycle of the wind farm, assumed to be 20 years.
Table 4-1 Example of selected LCA Calculator results
There are other results in form of graphs, like figure below that breaks down the distribution of the NPV of costs with warranty, insurance and maintance contract. Out of the 39 % of the O&M share, it is important to note the 10 % that serial failures account for. In this particular scenario, the gearbox and generator exchanges were treated as serial failures, and the warranty period was considered only for the first 5 years. Different runs of this model could be made with different warranty period scenarios, which could change significantly the configuration of the NPV costs. It should also be noted that corrective maintenance and insurance are the cost concepts
Results and discussion
36
Figure 4-1 Distribution of NPV costs with warranty, insurance and maintenance contract
Other results with graphic display include the operational costs, presented first for a scenario without warranty, insurance and maintenance contract (see Figure 4-2) and then also presented without serial failures. In this particular case the serial failures (gearbox and generator exchange) affect greatly the magnitude of the expenses, as seen in the years: 4,5,6, 16 and 17 in Figure 4-3.
Results and discussion
For a more detailed view of the distribution for the yearly costs, figure below, which excludes the serial failures, can be an example of how important the corrective services could be along the years.
Figure 4-3 Example of result graph for operational costs excluding serial failures
Also part of the results, a graph compares the distribution of the maintenance costs and the downtime per system or type. These graphs are based on scenarios according to the data input, and because of the consideration of the whole lifetime (20 years), is not the same as the results of the two years analyzed from the O&M data.
5
CONCLUSION
After looking at the outcomes of the LCA calculator, complemented by the separate analyses carried out for the O&M activities at the selected wind farm, conclusions and recommendations can produce actions that improve the operational cost performance for not only the studied wind farm, but ideally also other existing and future wind parks.
5.1
Insights
The analyses suggest that major failures, which include generator and gearbox exchanges, seem to be of great significance to the costs over the lifetime of a wind farm, so they should be looked further in-depth along with the warranties and insurance.
In this case study, O&M reached an approximate value of 39 % of the NPV costs.
5.2
Recommendations
To further increase the quality and precision of the results, it would be highly recommended to improve the way data is being handled. A major challenge relies in synchrochronyzing efforts from personnel from the manufacturers, operators, and subcontractors. It might prove difficult to align the priorities of the different players involved in the O&M of offshore wind farms, but trying to establish processes which lead to a more-detailed and correctly structured registry of data would help the industry to better understand how the operational costs can be reduced, thus making the offshore wind farms more competitive.
A study of this kind, with more data input would give further perspectives of what can be expected for an offshore wind farm.
5.3
Next steps
These results can be enriched with feedback from relevant people related to the operation and maintenance activities taking place at the wind farm. Some gaps on the information and missing pieces might be put together when combining the results from a statistical analysis with the experience and knowledge of the processes carried out that the people at site have.
Conclusion
40
Further research is needed to determine if tendencies are similar in other wind farms (same manufacturer having similar distribution of troublesome systems).
To optimize the time consumed for analyses of this kind and get faster and better results, processes (including administrative, operational and technological) should be designed in a structured way. The data registry should be oriented in a practical point of view, but with the objective of getting the most out of the data warehouse.
REFERENCES
[1] European Wind Energy Association (EWEA). Wind Energy Factsheets. 2010. [2] Krohn, S. Awerbuch, S. and Morthorst, P. E. The economics of wind energy,
EWEA, 2009.
[3] Wizelius, T. Developing wind power projects: theory and practice. Earthscan, 2007. London, UK.
[4] Van Hulle, F. J. L., Nath, C., Jensen, P. H., Eriksson, C. and Vionis, P.
European Wind Turbine Certification Guidelines. EWTC, 2001.
[5] Königstein, H., Müller, H., and Kaiser, J. RDS-PP – Transition from the KKS
to an international standard. VGB PowerTech, 2007.
[6] Ackermann, T. Wind Power in Power Systems. Royal Institute of Technology (KTH), Wiley & Sons, 2005.
[7] Rausand, M. and Hoyland, A. System Reliability Theory: Models, Statistical
Methods, and Applications. 2nd edition. Wiley, 2004.
[8] Dhillon, B. S. Life cycle costing: techniques, models and applications. Gordon and Breach Science Publishers, 1989.
[9] Rademakers, L.W.M.M., Braam, H. and Obdam, T. S. Estimating costs of
operation & maintenance for offshore wind farms. In proc. of the European
Wind Energy Conference 2008, 31st March-3rd April, Brussels, 2008.
[10] Stalin, T. Senior Offshore Project Manager. Vattenfall Vindkraft AB. Interview, July 2011.
A
RDS-PP SIMPLIFIED VATTENFALL TABLE
Table A-0-1 RDS-PP code and descriptive text of power plant components (simplified use at Vattenfall):
RDS-PP Code+Text
A - Grid and equipotential bonding systems AA - Electrical grid and distribution system AAG - Medium-voltage distribution system AAG10 - Medium-voltage switching system AAG10QA001 - Circuit-breaker panel AB - Equipotential bonding system ABA - Earthing/grounding system ABG - Lightning protection system
B - Electrical auxiliary power supply system BF - Low voltage main supply system BFA - Low voltage distribution board BFA10 - Panel placed at bottom BFA20 - Panel placed in nacelle
BR - Uninterrupted power supply system UPS BRA - UPS distribution board
M - Systems for generation and transmission MD - Wind turbine system
MDA - Rotor system MDA11 - Rotor blade A MDA12 - Rotor blade B MDA13 - Rotor blade C
MDA50 - Aerodynamic brake system MDA20 - Hub
MDA20UL001 - Cast body of hub MDA20UL002 - Spinner
MDA30 - Rotor blocking MDC - Pitch system
MDC10 - Pitch blade A-C total MDC10KF001 - Pitch control MDC11 - Pitch blade A
RDS-PP simplified Vattenfall Table
44
MDC12 - Pitch blade B
MDC12RL001 - Blade blocking B MDC12UP001 - Blade bearing B MDC13 - Pitch blade C
MDC13RL001 - Blade blocking C MDC13UP001 - Blade bearing C MDK - Drive train
MDK10 - Rotor shaft
MDK10UP001 - Rotor bearing front MDK10UP002 - Rotor bearing rear MDK10WQ001 - Rotor hollow shaft MDK20 - Gear
MDK20TL001 - Main gear MDK31 - Hydraulic Brake system MDK40 - Clutch(es)
MDK40XN001 - Clutch between main gear and generator MDK51 - Main gear oil system
MDK51GP001 - Main gear oil pump(s) MDK52 - Off-line gear oil system MDK52GP001 - Off-line gear oil pump MDL - Yaw system
MDL10 - Yaw drive system MDL10BG001 - Nacelle position MDL20 - Yaw brake system MDL20RL001 - Yaw locking
MDY - Control and protection equipment MDY10 - Electrical control system
MDY10BG001 - Meteorology, wind direction MDY10BS001 - Meteorology, wind velocity
MDY10BU001 - Meteorology, wind measurement combined MDY10BS002 - Vibration guard
MDY10KF001 - Control unit top MDY10KF002 - Control unit bottom MDY15 - Slip ring system
MDY15WD001 - Slip ring on transmission MDX - Hydraulic system
MDX10 - Hydraulic system in nacelle MDX10GP001 - Hydraulic pump
MDX10XL001 - Hydraulic rotating coupling MDX11 - Hydraulics blade A
MDX12 - Hydraulics blade B MDX13 - Hydraulics blade C
MK - Generator system including cooling MKA - Generator system
RDS-PP simplified Vattenfall Table
MKA10UP001 - Generator bearing DE MKA10UP002 - Generator bearing NDE
MKA10WD001 - Generator slip ring arrangement MKF - Primary cooling system, water
MKJ - Primary cooling system, air
MKY - Control and protection system(generator) MKY10 - Control including conversion
MKY10TA001 - Converter
MS - Transmission of electrical energy MSC - Generator circuit-breaker, and cooling MST - Generator transformer, and cooling MU - Common systems
MUD - Nacelle enclosure
U - Structures connected to production UM - WTG and WTG transformer building UMD - WTG structures
UMD10 - Foundation UMD20 - Tower
UMS - WTG transformer building X - Ancillary systems
XA - Ventilation and AC system XG - Fire extinguishing system XM - Cranes and hoists
XMA - Cranes
XMA20 - Crane tower XMA30 - Crane nacelle XN - Elevator system
XNM - Elevator, climbing assistance XS - Safety system XSD - Warning lights XSD10 - Naval lights XSD30 - Aviation lights XSF - Acoustic warning XSF10 - Fog signal
B
SUBSYSTEM BREAK DOWN INTO RDS-PP
Table A-0-2 Subsystems with grouped RDS-PP codes
INTERNAL GRID A - Grid and equipotential bonding systems
AAG10 - Medium-voltage switching system
EQUIPOTENTIAL BONDING SYSTEM ABG - Lightning protection system
ELECTRICAL AUXILIARY POWER SUPPLY BR - Uninterrupted power supply system UPS
WIND TURBINE SYSTEM MD - Wind turbine system
ROTOR SYSTEM MDA - Rotor system
HUB, ROTOR BLOCKING… MDA30 - Rotor blocking
PITCH SYSTEM MDC - Pitch system
MDC10 - Pitch blade A-C total MDC10KF001 - Pitch control
DRIVE TRAIN, ROTOR SHAFT MDK - Drive train
MDK10 - Rotor shaft
GEAR MDK20 - Gear
MDK20TL001 - Main gear
BRAKE SYSTEM, CLUTCH/COUPLING MDK31 - Hydraulic Brake system
MDK40XN001 - Clutch between main gear and generator AUXILIARY SYSTEM DRIVE TRAIN, MAIN GEAR OIL SYSTEMMDK51 - Main gear oil system
MDK51GP001 - Main gear oil pump(s)
YAW SYSTEM MDL - Yaw system
MDL10 - Yaw drive system
CONTROL AND PROTECTION EQUIPMENT MDY - Control and protection equipment
MDY10 - Electrical control system MDY10BG001 - Meteorology, wind direction MDY10BS001 - Meteorology, wind velocity MDY10BS002 - Vibration guard
MDY10BU001 - Meteorology, wind measurement combined MDY10KF001 - Control unit top
MDY10KF002 - Control unit bottom
HYDRAULIC SYSTEM MDX - Hydraulic system
MDX10 - Hydraulic system in nacelle MDX10GP001 - Hydraulic pump MDX10XL001 - Hydraulic rotating coupling
GENERATOR SYSTEM MK - Generator system including cooling
MKA - Generator system MKA10 - Generator
MKA10WD001 - Generator slip ring arrangement MKF - Primary cooling system, water
CONTROL AND PROTECTION SYSTEM (POWER ELECTRONICS FOR GENERATOR)MKY - Control and protection system(generator) MKY10 - Control including conversion MKY10TA001 - Converter
TRANSMISION OF ELECTRICAL ENERGY, TRANSFORMERMSC - Generator circuit-breaker, and cooling MST - Generator transformer, and cooling
MACHINERY ENLOSURE, NACELLE, MAINFRAME MUD - Nacelle enclosure
WIND TURBINE STRUCTURES, TOWER, FOUNDATION UMD10 - Foundation
UMD20 - Tower ANCILLARY SYSTEMS, CRANES, VENTILATION, ELEVATOR, SAFETY SYSTEMX - Ancillary systems
XA - Ventilation and AC system XMA - Cranes
XMA30 - Crane nacelle XN - Elevator system XS - Safety system XSD - Warning lights XSD10 - Naval lights
Department of Wind Energy Gotland Univeristy Cramérgatan 3, 62157 Visby Sweden Tel: (+46) 49 82 99 900
![Figure 1-1 New installed capacity and de-commisioned capacity in EU 2009 [1]](https://thumb-eu.123doks.com/thumbv2/5dokorg/3273341.15560/17.893.279.659.634.1056/figure-new-installed-capacity-commisioned-capacity-eu.webp)
![Figure 1-2 Overview of cost of wind energy and its relation to O&M [2]](https://thumb-eu.123doks.com/thumbv2/5dokorg/3273341.15560/18.893.140.718.387.764/figure-overview-cost-wind-energy-relation-o-amp.webp)