Research
Radiological examinations of children:
a study of method options
2016:14
Author: Håkan JorulfBengt Isberg Ulla Svahn
SSM’s perspective
Background
SSM performed a previous study of justification in the area of computed tomography in Sweden. The findings were based on a team of physicians determining retrospectively, on the basis of referrals, whether a sample of CT examinations performed in Sweden over the course of one day showed that the examinations were justified. The study resulted in a report published by the Swedish Radiation Safety Authority, SSM, enti-tled “National Survey on Justification of CT-examinations in Sweden”, SSM Report 2009:03. These were the key findings:
• Approx. 20 per cent of the examinations performed were considered as not justified;
• The quality of the referral content was generally good;
• Justification varied depending on the part of the body examined; • There were minor regional differences in Sweden;
• There were no differences between examinations on the part of males and females; and
• The level of justification was lower for children and adolescents. Radiation protection rests on three basic principles: justification, opti-misation and dose constraints. Justification implies the benefit of radia-tion exposure outweighing the risk of detriment. For each patient, one is to adapt (optimise) the examination to this patient and his or her illness. No dose limits are applied in connection with medical exposures as this could have a negative impact on the examination or treatment.
Assessing justification as per ICRP guidelines is performed at three levels. The first level involves determining whether or not to use radia-tion as part of medical care. The second level involves determining whether any type of examination could give an answer to a particular clinical question. Medical care programmes developed by medical care regions or professional organisations often serve as the basis of level two decisions. Level three involves determining the kind of examination or treatment that is optimal for the individual patient. The referring prac-titioner and the specialist performing the examination both determine whether an individual examination is justified. The referring practi-tioner has the task of determining whether an examination is needed. An adequate referral is to help the radiologist decide on an optimal choice of examination and give input for optimisation.
Aim
The purpose of this study was to verify whether the results from the first study were correct, that is, whether the level of justification is indeed relatively inferior on the part of children and adolescents in relation to adults. For the purpose of investigation, all referrals for computed tomography (CT), ultrasound (US) and magnetic resonance imaging (MRI) were collected from paediatric examinations performed over the course of two weeks at Swedish hospitals.
Outcome
This report largely confirms the findings from the previous study. The national survey also shows a considerable level of disagreement in Sweden in terms of when to perform a CT examination in paediatrics, since the reviewing physicians and performing radiology departments were only in agreement for 51 per cent of the examinations. This indi-cates suboptimal assessment of justification at level 2. It is crucial that medical care regions and scientific societies develop referral guidelines for diagnostic imaging.
Project information
Contact person at SSM: Sven Richter Reference: SSM 2011-1413
2016:14
Author: Håkan Jorulf, Bengt Isberg, Ulla Svahn Stockholm
Radiological examinations of children:
a study of method options
This report concerns a study which has been conducted for the Swedish Radiation Safety Authority, SSM. The conclusions and view-points presented in the report are those of the author/authors and
Table of contents
SSM’s perspective ... 2 Background ... 2 Aim ... 3 Outcome... 3 Table of contents ... 6Medical care regions in Sweden, 2012... 8
Team of experts ... 9
Reviewing physicians ... 9
1. Executive summary ... 11
2. Introduction ... 13
3. Background ... 14
Risk of developing cancer following CT examinations ... 15
4. Purpose of this study ... 16
Approaches ... 17
Confidentiality and patient participation ... 17
Questionnaire to heads of departments ... 17
5. Review study ... 18
Population ... 18
Design: Collecting material comprising referrals and responses ... 18
Descriptive data ... 18
Reviewing physicians ... 19
Data entry: descriptive information ... 20
Review of referrals ... 21
Referral procedure and referral quality ... 21
Reviewer assessments ... 21
Referral quality ... 22
Justification ... 22
Method options ... 23
6. Outcomes ... 24
Material and statistics ... 24
Justification and referral quality ... 37
Method options: agreement and disagreement ... 40
Questionnaire ... 56
7. Discussion ... 58
Therapy and diagnostics ... 58
Justification ... 59
Design of this study ... 61
Method selection ... 61
The time period of the study and examination quantities ... 61
Representativeness ... 62
Reviewing physicians... 62
Material collection and review work ... 63
Referral quality and justification ... 63
Reviewing referrals: agreement and disagreement ... 64
8. Conclusions ... 67
Age and gender ... 67
Referral quality, justification and level of medical care ... 67
Proposed measures ... 68
The method options of CT, MRI and US ... 68
Proposed measures ... 69
Proposed measures ... 70
CT of children: frequency ... 71
Proposed measures ... 71
Medical care regions in Sweden, 2012
Region CT MRI Million residents Number of children Percentage of children (%) North 18 14 0.88 147,000 16.8 Uppsala-Örebro 39 29 1.97 341,000 17.4 Stockholm-Gotland 39 39 2.11 404,000 19.1 West 38 24 1.73 311,000 18.0 Southeast 22 18 1.00 176,000 17.6 South 34 25 1.73 310,000 17.9
Team of experts
Håkan Jorulf. Associate professor, former specialist adviser in diag-nostic radiology and medical adviser for medical services as part of the Stockholm Medical Council of Stockholm’s County Council. Praktikertjänst AB.
Bengt Isberg. PhD, head physician, medical radiology, Läkarhuset Odenplan, Stockholm.
Ulla Svahn. Research assistant. Praktikertjänst AB.
Reviewing physicians
Bajic, Dragan. PhD, head physician, medical imaging and functional medicine, paediatric radiologist, Uppsala University Hospital. Evemark, Inger. head physician, paediatric radiologist, Linköping University Hospital.
Finnbogason, Thröstur. PhD, head physician, paediatric radiologist, Astrid Lindgren Children’s Hospital, Karolinska University Hospital, Stockholm.
Holm, Stefan. PhD, head physician, paediatric oncologist, Astrid Lindgren Children’s Hospital, Karolinska University Hospital, Stock-holm.
Hugosson, Claes. PhD, head physician, paediatric radiologist, Läkarhuset Odenplan, Stockholm.
Jorulf, Håkan. Associate professor, paediatric radiologist, Praktiker-tjänst AB, Uppsala.
Laurencikas, Evaldas. PhD, head physician, paediatric neuroradiolo-gist, Danderyd University Hospital, Stockholm.
Lindblom, Maria. head physician, paediatric radiologist, Linköping University Hospital.
Megyeri, Ilona. head physician, paediatric radiologist, County Hospi-tal, Falun.
Müller, Lennart. PhD, head physician, radiology, County Hospital, Halmstad.
Pech, Peter. Associate professor, head physician, paediatric radiolo-gist, Uppsala University Hospital.
Penno, Eva. head physician, paediatric radiologist, Uppsala University Hospital.
Rehnberg, Lars. Associate professor, head physician, paediatric ortho-paedist, emeritus, Astrid Lindgren Children’s Hospital, Karolinska University Hospital, Stockholm.
Relefors, Björn. head physician, radiologist, District Hospital, Hudiksvall.
Toporski, Jacek. Associate professor, head physician, paediatric on-cologist, Skåne University Hospital, Lund.
Wiklund, Marie. head physician, paediatric radiologist, Skåne Univer-sity Hospital, Lund.
Åmark, Per. Associate professor, head physician, paediatric neurolo-gist, Astrid Lindgren Children’s Hospital, Karolinska University Hos-pital, Stockholm.
1. Executive summary
The Swedish Radiation Safety Authority, SSM, decided in 2011 to investigate the justification of the use of diagnostic computed tomo-graphy (CT) for children up to fifteen years of age. The reason is the fact that CT is the main contributor to ionising radiation to the popula-tion. During the last decade, the annual number of CT examinations increased by 200%, and during the last 16 years, by 320%.
In the present study, 3,149 CT, magnetic resonance imaging (MRI) and ultrasound (US) examinations in Sweden of children and adoles-cents aged 0-15 were performed over a 14 day period in 2011, encom-passing all health care regions. Evaluation was performed by 18 expe-rienced paediatric clinicians and radiologists. The observers were blinded for the referring practitioners’ choice of method as well as for the performed examination method, but they had access to all other information given in the request forms (referrals). Each examination was judged by at least two observers, in a few cases by three or four observers.
Findings: Radiological examinations were judged as justified or
probably justified for 96% of all examinations and as probably unjus-tified for 4% of the examinations. The information in the request forms was judged to be adequate or almost adequate, while 4% of the requests were considered as not fully adequate.
The observers agreed on the choice of examination method,
between the observers as well as with the requested and per-formed method, in 88% of requested US, in 68% of MRI and in 51% of CT examinations.
The observers agreed among themselves on preferring another
examination method than the one requested and other than the performed method in 2% of US, in 5% of MRI and in 14% of CT examinations.
The observers disagreed among themselves and at least one
observer agreed on the requested choice of method in 9% of US, in 25% of MRI and in 32% of CT examinations. Regional variation in the use of CT was demonstrated.
Discussion: There is a high level of national consensus among
paedi-atric clinicians and radiologists concerning the use of US as the ade-quate method of choice in actual clinical practice. The lower level of agreement regarding CT as the method of choice suggests that clinical guidelines either do not exist, or are suboptimal, or have not yet reached common acceptance in the paediatric healthcare community. During the past decade, parallel to the development of much more
MRI has slowly but steadily improved at almost all Swedish county hospitals. Still, there may be clinically unacceptable, long waiting times for MRI (and especially for MRI of children in general anaes-thesia), leading to the next best choice of CT for the examination. These circumstances may be important and one reason behind the lev-el of disagreement becoming evident in the present study. The paedi-atric physician in routine practice may not only be able to choose the most appropriate examination with the lowest radiation dose to the child, but must for example consider choosing between drop-in for CT and very long waiting times for MRI.
In the present study, regional differences were assessed. CT requested by university and county hospitals was considered to be more justified than CT requested by physicians in primary care, though requests from primary care were infrequent.
In a similar investigation in 2004 on the use of MRI, conducted by the same team of experts, the observers considered about one-third of the studied MRI examinations as being unjustified and 20% to 25% of the requests were considered to be inadequate.
It is of material importance to increase efforts to define and establish optimal referral guidelines for paediatric imaging in general and for the use of CT for children in particular.
2. Introduction
One of the basic principles of radiation protection in radiological di-agnostics is for the benefit for the patient to outweigh the estimated detriment/risk from an examination involving ionising radiation. There is a consensus concerning replacement of examinations involv-ing ionisinvolv-ing radiation by examinations that do not involve radiation, provided that the replacement examination has the
suffi-cient/necessary diagnostic accuracy for the given clinical question. This consensus is based on the general precautionary principle and avoidance of potential risks; for example, future development of ma-lignancy or other illnesses. As computed tomography (CT) currently contributes more than half of the total radiation dose received by the Swedish population, a national survey of the choice between CT, magnetic resonance imaging (MRI) and ultrasound (US) examinations as alternative methods is of particular importance for paediatrics. The Swedish Radiation Safety Authority (SSM) appointed a project team for this assignment, referred to as the team of experts in this re-port. This review team had carried out three similar studies on use of magnetic resonance imaging (MRI) by Stockholm County Council in 2001 and 2004, in addition to a national survey on use of computed tomography in 2006. All the studies were retrospective and observa-tional. The total number of radiological imaging procedures in Swe-den is constant in relation to the population, with a significant shift towards more radiation-based CT (1, 2, 3).
Alternative methods to paediatric CT show satisfactory distribution, mainly US. The level of access to CT is generally high and examina-tion times are short, at the same time as access to MRI is limited. Children under six years of age may in exceptional cases undergo MRI examinations without anaesthesia, which limits their use. During drop-in time, access to anaesthesia is limited. The degree of justifica-tion of paediatric examinajustifica-tions has not been surveyed previously.
3. Background
Modern CT equipment offers very good imaging of the body and is in many cases a necessary diagnostic tool for confirming or ruling out serious illness, or for planning of treatment; CT is frequently used for follow-ups. CT is faster and gives better image quality in a free choice of directions and has good availability around the clock, thus contrib-uting to gradually increased use.
In 2006, the Swedish Radiation Safety Authority (SSM) initiated a national study on use of CT procedures. The study encompassed 2,345 CT examinations performed over the course of 24 hours in the month of March 2006 (Report 2009:3) (1). Report 2009:3 covered a small number of children and adolescents ages 0-15 (N = 111/2,345). CT represents more than half of the collective dose from diagnostic radiology; use of CT is increasing by 5–10% annually. In Stockholm County, the total number of CT examinations rose from 65,000 in 1996 to approx. 210,000 in 2011, thus more than tripling over a 16-year period. For the 16-year 2011, it was estimated that nearly one mil-lion CT examinations in total were carried out in Sweden. In relation to the population, an estimated one out of ten adults are examined an-nually using CT. The number of paediatric CT examinations has not been studied previously. New areas of application have arisen replac-ing conventional radiology, for instance for trauma examinations, ves-sels, the urinary tract and 3-D reconstructions.
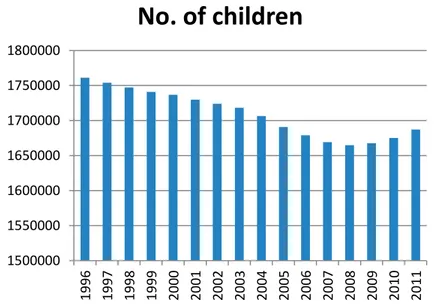
Figure 1 Number of children in Sweden between 1996 and 2011 (source: Statistics Sweden)
Development in the number of children throughout Sweden under the age of 16. The lowest number of children was in 2008. This was followed by an increase. The total decline amounted to 4.2% during the period.
1500000 1550000 1600000 1650000 1700000 1750000 1800000 19 96 19 97 19 98 19 99 20 00 20 01 20 02 20 03 20 04 20 05 20 06 20 07 20 08 20 09 20 10 20 11
No. of children
Risk of developing cancer following CT examinations
The general perception is that there is no absolute lowest level for radiological medical exposure in terms of cancer risk. This is why procedures follow the principle of using the lowest possible radiation dose in connection with radiological examinations. The absolute risk of developing a cancer illness due to diagnostic medical exposure is small and generally the benefits outweigh the potential risk of devel-oping cancer.
Epidemiological studies show that children have greater sensitivity to ionising radiation than adults. Given that they have a longer life ex-pectancy than adults, children and adolescents run a higher risk of radiation injury. There is a risk that children will receive a higher ra-diation dose than necessary for giving sufficient diagnostic infor-mation. Children and adolescents altogether run a multiple risk of de-veloping radiation-related cancer illnesses compared with adults who have undergone the same kind of radiological imaging procedure. Previous estimates of the radiation hazard for children showed that the lifelong risk of developing cancer rose substantially for children, indi-cating the need to limit radiation doses (5, 6). The first study pub-lished that specifically assessed the risk of developing cancer follow-ing CT examinations in childhood was released in June 2012 (7). Scrutiny revealed that for 176,587 patients, the risk was cumulative in pace with higher radiation dose. A dose of 50-60 mGy to the skull region was estimated to triple the risk of developing a brain tumour. The same radiation dose to bone marrow, for example when examin-ing bone marrow areas such as in the thorax/chest, spine and abdo-men, triples the risk of developing leukaemia. A corresponding group of individuals who did not undergo a radiological examination was estimated to receive a cumulative dose of less than 5 mGy.
4. Purpose of this study
The assignment was to perform an analysis of justification, method options and referral quality in the area of paediatric CT examinations for children and adolescents between the ages of 0 and 15.
It is crucial to comply with guidelines and to have a high level of clin-ical quality when using diagnostic imaging involving medclin-ical expo-sures of children and adolescents. This particularly applies to CT ex-aminations. US and MRI are methods of diagnostic imaging that do not expose patients to ionising radiation. It is assessed as important to perform analyses on the extent to which CT, US and MRI performed on children were justified, and on whether the selected method is cor-rect.
SSM’s regulations require licensees to ensure that all medical expo-sure is justified and optimised. SSM has introduced the concept of “diagnostic reference levels” for some examinations, a dose level which should not be exceeded. This has led to successful optimisation work in health and medical services.
Justification is defined by SSM regulation 2008:35 (8). Alternatively, justification can be defined in accordance with guidelines for request-ing imagrequest-ing diagnostics (Referral guidelines for imagrequest-ing: Radiation Protection 118, EU 2000, 2008) (9, 10).
The objectives of the study were to:
a) look into areas such as equipment standard and the existence of protocols at Swedish medical diagnostic departments that perform paediatric examinations;
b) present areas such as:
i. statistics on the number of paediatric examinations us-ing the methods CT, MRI and US, categorised by age category, gender, medical care region, county, level of medical care, referrers’ specialty, organ areas examined and public/private medical services,
ii. the reviewers’ assessment of referrals in terms of the referrals’ quality and the examinations’ justification, and
iii. the reviewers’ choice of preferred method independent-ly of the referring practitioner’s and examining radiol-ogist’s choice, in addition to the level of agreement be-tween reviewers and agreement bebe-tween reviewer and referring practitioner; and
c) analyse the outcomes, mainly review work, and based on anal-ysis and interpretation, suggest areas of focus for improvement
work on guidelines and care programmes on national and re-gional levels.
Approaches
In order to strive to achieve the objectives, the decision was made to conduct a simple survey in addition to a review study.
The questionnaires, which were completed by heads at all diagnostic imaging departments in Sweden, were intended to shed light on exist-ing and available equipment and whether the dose reduction software for CT was applied on a routine basis. Responses were sought on an-aesthesia options and protocols (care programmes) for paediatric radi-ological examinations using CT, MRI and US.
The review study implied examining referrals and responses over a 14 day period of producing CT, MRI and US examinations at all radi-ology departments in Sweden for the purpose of forming an opinion on the reviewers’ assessments of justification, referral quality and the selected method. The review was based on the reviewer personally assessing which method of CT, MRI or US that was most appropriate on the basis of referral details.
Confidentiality and patient participation
Copies of referrals for assessment by the reviewers were de-identified. Only the first name and four digits of the personal identity number were not de-identified. All referral details that could potentially be traced to a specific patient referral or subsequently performed exami-nation were also removed. Opinions on examiexami-nations were compiled, but the reviewers did not have access to a specific opinion. Patients and their guardians did not take part in this study.
Questionnaire to heads of departments
SSM sent a questionnaire to heads of diagnostic medical imaging de-partments in Sweden. The questionnaire sought responses to the fol-lowing questions:
- Was CT, MRI and US equipment available at the clinic?
- Was there dose reduction software for CT, and if so, which soft-ware was it?
- Was there access to anaesthesia for general anaesthesia, in particu-lar for MRI scans of children?
- Were there protocols (care programmes) for diagnostic imaging examinations of children (CT, MRI and US, but also other
meth-5. Review study
PopulationThe material consisted of referrals and responses (results of examina-tions) for all the CT, MRI and US examinations of children aged 0-15 performed during the period as of 0:00 hours, Wednesday 23 March 2011 up to and including 24:00 hours, Tuesday 5 April 2011 at all departments located in Sweden. In the event any modality was non-operational for a maximum of six hours during a particular 24-hour period of the selected timespan, that day was replaced by compilation during an alternative day immediately before or after the period stud-ied.
Design: Collecting material comprising referrals and responses
The study is retrospective and observational.
The material collected in Sweden comprised all complete referrals with results of examinations for children under 15 years of age (ex-cluding 15 years and older, with the exception of a few individual adolescents aged 15 and up who are included and are still being cared for in paediatrics), and material on performed or not completed CT, MRI and US examinations during the period as of 00:00 hours, 23 March 2011 up to and including 24:00 hours, 5 April 2011, compiled electronically or as paper copies.
In the event any modality was non-operational for a maximum of six hours during a particular 24-hour period, that day was replaced by compilation during a day before or after the studied period. Referrals were to contain all patient details and complete clinical details, includ-ing information about the clinic, hospital (or outpatient care) and county council where the referring practitioner worked.
Following collection, surnames and personal identity numbers were de-identified by SSM, the Swedish Radiation Safety Authority.
Descriptive data
Referrals and responses for all examinations were assigned a unique number. All the below referral details were entered into the study da-tabase:
- The referring practitioner: county council, specialty, care level, clinic/department, public or private
- The diagnostic imaging department performing the examina-tion: county council, care level, clinic/department, public or private
- The examination requested by the referring practitioner: meth-od option, part of the bmeth-ody
- The performed examination: method, part of the body - Referral date and examination date
- If the serum creatinine value was provided
- If information was provided on the patient not being pregnant - If the examination was performed with or without using I.V.
contrast injection
- If the referral was handwritten - Any referral comments
Reviewing physicians
The team of experts turned to radiology representatives for selection of reviewing physicians with expertise in the practice. The representa-tives suggested suitable reviewers. All the reviewers have specialist competence and extensive professional experience.
The reviewers who represent clinics were to have as their main occu-pation clinical work involving paediatric patients in medical care, covering the modalities CT, MRI and US, have extensive and broad clinical experience and, as a minimum, be partly in charge of an oper-ation involving a high proportion of paediatric patients referred for diagnostic CT, MRI and US.
Reviewers who are radiologists were to be clinically oriented, have extensive and broad imaging and functional diagnostics experience, primarily in paediatric and adolescent radiology, and be well known collaborative partners for clinics/referring practitioners.
All reviewers were to be acknowledged as being of sound judgement and known for their integrity. The 18 reviewers engaged represented university hospitals, county hospitals, district hospitals, both public and private. The reviewers are specialists in paediatric and adolescent radiology, in paediatric and adolescent medicine, and in clinical sub-specialties of orthopaedics, surgery, neurology and oncology. The reviewers held posts at departments in Lund, Halmstad, Linköping, Stockholm (Solna), Stockholm (Danderyd), Stockholm (MRAB), Uppsala, Falun and Hudiksvall.
Data entry: descriptive information
The team of experts entered all descriptive information (see above) into a specially designed database. All 18 reviewers were provided with a unique database copy. The reviewers were assigned a workset comprising 200 to 550 referrals.
The following collected details were registered centrally by the team of experts:
Patient: Birth year, month, day, gender
Referral date, examination date
Referring practitioner: County council, department, specialty,
owner, care level, department
Level of medical care (university hospital, county hospital, district hospital), outpa-tient care
Ownership (public, private practitioners under own management, private care en-terprise)
Requested by the referring practitioner:
method, part of the body
Radiologist: Region, county council, department,
own-er, care level
Level of medical care (university hospital, county hospital, district hospital), outpa-tient care
Ownership (public, private practitioners under own management, private care en-terprise)
Method, part of the body. Referral date, examination date.
Any deviating creatinine value
Examination: Requested examination – method and part
of the body/organ
Performed examination – method and part of the body/organ
Information about denied pregnancy Was I.V. contrast medium used? Handwritten referral
Review of referrals
The copies of referrals supplied to the reviewers had not only the ex-amination method de-identified, but also any other information that could potentially be used to deduce the method of examination per-formed.
Consequently, the reviewers assessed referrals where the patients’ birth year, month and day, in addition to their first name, were acces-sible. Moreover, the reviewers could access all referral details in other respects. The reviewers could not access examination results.
Each reviewer received own copies of selected referrals for the pur-pose of entering their assessments and preferred choice of method in their own database. All the assessments were merged as part of a large shared database. Each referral was examined by a minimum of two reviewers, radiologists or clinics. Some referrals were examined three or four times.
Referral procedure and referral quality
The standard for referrals can be defined as criteria developed, estab-lished and accepted by the profession for referral content required for an investigation or for consultation (10).
Radiation protection regulations impose restrictions on examinations involving ionising radiation. A radiologist has not only an obligation, but also the right, to consider the justification and choice of examina-tion method. This procedure includes changing the examinaexamina-tion sug-gested by the referral in order to ensure protection of patients. Local procedures for complete referral management must be issued (11, 12, 13).
Reviewer assessments
The reviewers were asked to adopt a standpoint on all the referral in-formation available to them (see above), using this inin-formation to as-sess and grade the referral quality and justification, in addition to choosing the preferred examination method and part of the body to investigate.
The reviewers were instructed to grade referral quality and justifica-tion in accordance with definijustifica-tions. In other respects, there was no requirement on specific knowledge of applicable international, nation-al or regionnation-al guidelines or care programmes. Assessments were main-ly to be based on proven experience, but also on national guidelines or
generally accepted principles to the extent that a reviewer was aware of them.
When assessing referral quality and justification, the reviewers were instructed to learn about definitions for grading these aspects. Referral quality
Referral quality is measured by the degree to which referral infor-mation is sufficient and adequate. The definition of “degree” is based on the possibility to, from the referral details, assess an examination’s
efficacy (= required technical and diagnostic accuracy) and its justifi-cation (see definitions of “justifijustifi-cation”). Degrees of adequate referral
information may be defined in accordance with the following: - Adequate referral information: efficacy and justification can
be assessed.
- Relatively adequate referral information: efficacy can be as-sessed, it is not self-evident that justification can be assessed. - Relatively inadequate referral information: it is not
self-evident that efficacy can be assessed, justification is difficult to assess.
- Inadequate referral information: the referral lacks details to a degree preventing the question’s relevance from being as-sessed. Efficacy and justification cannot be asas-sessed. Justification
There are two definitions for justification of diagnostic imaging exam-inations. One definition is provided by the EU’s “Referral guidelines for imaging” (9). Another definition is laid down by SSM’s regulation SSMFS 2008:35 (8). See the discussion below contained in the pre-sent report, where these definitions are cited and their implications are discussed.
The degree of justification has been defined by this study as a re-sponse to this question: Can the outcome of this examination – posi-tive or negaposi-tive – be expected to be of significance for further investi-gations or therapy, or, alternatively, give a sufficiently accurate diag-nosis:
Definitely - Justified examination
With a high level of
probability - Justified examination probable
level of probability
Not at all - Unjustified examination
Cannot be assessed - The referral details are insufficient for
assessing the possible outcome of the examination
Since the reviewers were neither aware of the examination methods requested nor performed, the emphasis of the review definition was automatically placed on the general definition and not on SSM’s defi-nition. The reviewers were instructed to adopt a standpoint as to whether any diagnostic imaging examination was justified judging from the referral information; the next step for them was to choose their preferred examination method.
Method options
The reviewers were asked to, on the basis of the available referral in-formation, choose the most justified examination method without knowing what the referring practitioner requested or the method used for the examination. The choice did not force the reviewers to decide between CT, MRI or US. Instead, they could select other diagnostic imaging or interventional methods, such as conventional X-ray, scin-tigraphy or conventional angiography. The choice of method was to be made if the reviewer assessed that the examination was justified, its justification highly probable, or unlikely. The reviewers were also asked to choose a part of the body to investigate. If a reviewer was of the opinion that two examinations with different methods were justi-fied, an additional examination and respective part of the body could be indicated.
6. Outcomes
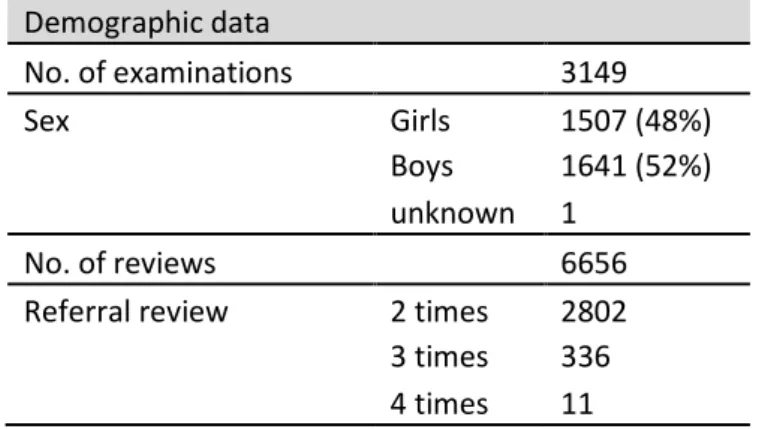
Material and statisticsThe study included 3,149 examinations performed over two weeks in Sweden, between 23 March and 5 April 2011, involving CT, MRI and US of children aged 0–15 (Table 1).
1,507 girls and 1,641 boys were examined, with one patient of un-known gender on the basis of referral details (Table 1, Figure 2).
Table 1. Number of examinations, gender perspective and number of reviews.
Number of examinations CT, MRI and US performed in paediatrics, children aged 0-15, with a small number of patients over 15 years of age still being monitored by paediatric services. The period studied comprised 14 days between 23 March and 5 April 2011. Demographic data No. of examinations 3149 Sex Girls 1507 (48%) Boys 1641 (52%) unknown 1 No. of reviews 6656
Referral review 2 times 2802
3 times 336
4 times 11
The number of examinations performed was 3,149. Each examination was reviewed by a minimum of two independent reviewers; a few examinations were reviewed by three or four reviewers. The total number of reviewed examinations was 6,656. The period of the study was selected based on anticipated full production in health and medi-cal services for acute and elective care. Actual yearly production should be somewhat lower than what can be estimated by extrapolat-ing from production durextrapolat-ing the period studied.
For the purpose of drawing conclusions, the number of examinations is deemed sufficient during the period of time as far as concerns methods, organ areas and the respective medical care regions.
Figure 2. Number of examinations performed during the selected peri-od, CT, MRI and US, by gender and age category.
The number of examinations for babies and infants predominate, followed by a gradual decrease and subsequently slow increase. The category children aged 0-1, from the neonatal period and up to the 12th month, represents serious illnesses.
Of the number of examinations performed (3,149), 653 were CT, 663 MRI, 1,832 US and 1 X-ray. The distribution was 1/1/2.7 (Table 1, Figures 3, 4, 5).
Figure 3. Number of examinations performed during the selected peri-od, CT, MRI, US and X-ray.
US is the predominant modality. MRI and CT are relatively evenly distributed among the number of examinations. Ratio CT/MRI/US: 1/1/2.7.
0 50 100 150 200 250 300 350 400 450 0 1 2 3 4 5 6 7 8 9 10 11 12 13 14 15 Girls Boys
Number of examinations (CT, MRI, US and X-ray)
No. of e xam in at ion s Age 0 200 400 600 800 1000 1200 1400 1600 1800
2000 No. of examinations performed
Figure 4. Number of examinations performed during the selected peri-od, CT, MRI, US and X-ray, per age category from 0-15 years.
US predominates considerably for children up to two years, mainly for ages 0-1 during the neonatal period. The number of CT and MRI examinations slowly increases with children’s age.
Figure 5. Number of examinations performed using the method re-quested by the referring practitioner, CT, MRI, US and X-ray, per age category from 2 to 15 years.
The number of US drops after infants’ first 12 months. CT and MRI are used to a limited extent for younger ages, with their use increasing gradually with the children’s age.
CT and MRI increase somewhat by number of examinations with ris-ing age, whereas US examinations predominate durris-ing the neonatal period (40% of all US were of children aged 0-2), dropping to a stable
0 100 200 300 400 500 600 700 0 1 2 3 4 5 6 7 8 9 10 11 12 13 14 15 16 US CT MRI X-ray
No. of examinations performed
Age 0 20 40 60 80 100 120 140 2 3 4 5 6 7 8 9 10 11 12 13 14 15 16 US CT MRI X-ray
No. of examinations performed
frequency per age category from 2 years of age and older (Figures 2, 4, 5, 6).
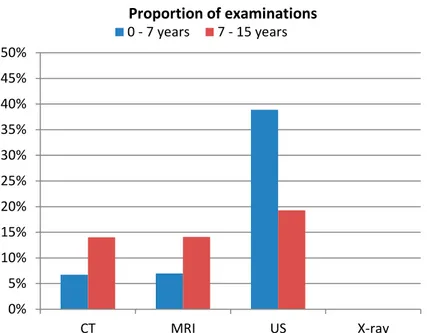
Figure 6. Proportion of CT, MRI and US for children aged 0–7 and 7–15.
US is the predominant modality, particularly for ages 0–7.
The distribution of examinations (N=3,149) in six medical care re-gions is shown per million children. The lowest number of tions was performed in the Uppsala-Örebro region (1,611 examina-tions per million children). The highest number was performed in the Stockholm-Gotland region (2,192 per million children) (Figure 7).
Figure 7. Number of CT, MRI and US examinations per million children during the selected period per medical care region (number of children aged 0-15 according to Statistics Sweden).
0% 5% 10% 15% 20% 25% 30% 35% 40% 45% 50% CT MRI US X-ray
0 - 7 yearsProportion of examinations 7 - 15 years
0 500 1000 1500 2000
As regards the Stockholm-Gotland region, a higher number of US contribut-ed to the total number of examinations (+18%) excecontribut-eding the national aver-age. A higher number of US for the Stockholm-Gotland region may be due to concentration of specialist care with a high level of access to US at a small number of departments, compared with Sweden on a national level.
The number of CT, MRI and US examinations per million children varies between county councils, counting from the mean value, from +56% (Västerbotten County Council) to –35% (Region Halland) (Fig-ure 8).
Figure 8. Number of CT, MRI and US examinations per million children aged 0-15 by county council (number of children as per 1 January 2011 according to Statistics Sweden).
There is a discernible variation in the use of CT, MRI and US between coun-ty councils. The highest number of examinations is represented by Väs-terbotten County Council. The lowest number of examinations is represented by the Halland region, disparity factor of 2.4 per million children. A large var-iation is also discernible in terms of method selection. The highest number of CT examinations is shown by Norrbotten County Council; the lowest by Gäv-leborg County Council, factor 6.6.
0 500 1000 1500 2000 2500 3000 US MRI CT
The number of referrals for CT examinations per million children was lowest in the Uppsala-Örebro region, at 310, and highest in the North region, at 529 (Figure 9).
The number of referrals for MRI examinations per million children was lowest in the West region, at 296, and highest in the Southeast region, at 499 (Figure 9).
The number of referrals for US examinations per million children was lowest in the Southeast region, at 902, and highest in the Stockholm-Gotland region, at 1,405 (Figure 9).
Figure 9. Number of referrals for CT, MRI, US and X-ray per million children and by region.
US predominated in the Stockholm-Gotland region. The Southeast region had the highest proportion of MRI, and CT was predominant in the North region.
The frequency of performed examinations in paediatrics is dominated by university hospitals at 49%, followed by county hospitals at 30%, district hospitals at 16% and outpatient care at 5%. The distribution of examinations at care level is shown by Table 2.
0 200 400 600 800 1000 1200 1400 1600 US CT MRI X-ray
Referrals from outpatient care (13%) were more common than exami-nations at departments in outpatient care (5%) (Table 2).
Table 2. Comparison of the number and percentage of examinations at different care levels, requested by a clinic and performed at the respec-tive diagnostic imaging department at a university hospital, county hospital or district hospital, and requested by non-hospital affiliated outpatient care.
Referring practitioners may work at a care level that is different from the care level of radiology departments. Outpatient care refers a relatively high per-centage of patients to a higher care level; this is also a desirable situation. A significant concentration of examinations at diagnostic imaging departments at higher levels of medical care, 49%, were performed at university hospi-tals, with 30% performed at county hospitals.
Referrer Examiner No. No. University hospitals 1494 47% 1556 49% County hospitals 845 27% 938 30% District hospitals 397 13% 508 16% Outpatient care 409 13% 147 5% Other 4 0%
Table 3. Number and percentage of examinations requested and per-formed within the public care sector, a department in a private care company or by a physician with an own practice.
The public care sector predominates as far as concerns both referring de-partments and radiology dede-partments.
Care provider Referrer Examiner
Public 2999 96% 3007 96%
Private company 103 3% 101 3%
Private doctor 45 1% 41 1%
It is common for examinations to be requested and performed at uni-versity hospitals (Table 2; Figure 10).
The percentage of examinations requested by non-hospital affiliated outpatient care (family doctors, outpatient care specialists) was high-est in Stockholm-Gotland (19%) and lowhigh-est in the North region (7%) (Figure 10). The percentage of examinations requested by university hospitals was highest in the Stockholm-Gotland region. Requests from county hospitals predominated in the Uppsala-Örebro region.
Figure 10. Number of CT, MRI and US examinations requested by clin-ics at university hospitals, county hospitals and district hospitals, and requested by non-hospital affiliated outpatient care, grouped by medi-cal care region.
The structure of health and medical services varies between regions. The Stockholm-Gotland region has a concentrated structure, with the largest number of residents and paediatric care clustered at Astrid Lindgren Chil-dren’s Hospital. An equivalent structure is also discernible in the West re-gion. The other regions offer more medical services at county hospitals. At the same time, however, the Stockholm-Gotland region has a higher per-centage of referring practitioners in outpatient care than compared with the other regions. 0 100 200 300 400 500 600 700
University hospitals County hospitals
District hospitals Outpatient care
The largest number of referrals and performed examinations com-prised cases involving the brain/skull, abdomen/pelvis and
kid-neys/urinary tract (Tables 4, 5, 6).
Table 4. Requests from different care levels grouped by most common organ areas.
The predominant organ areas are brain/skull, abdomen/pelvis and kid-neys/urinary tract. 45 requested X-ray examinations were changed to US, CT and MRI. One X-ray examination was performed nevertheless.
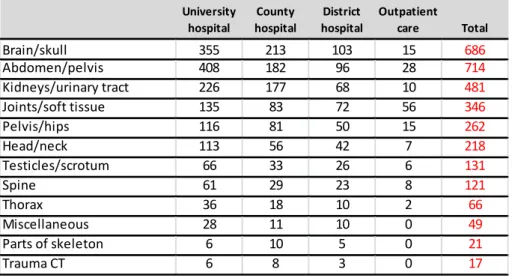
Table 5. Performed examinations from different care levels, grouped by most common organ areas.
The predominant organ areas were brain/skull, abdomen/pelvis and kid-neys/urinary tract, with the examinations mainly performed at university hos-pitals or county hoshos-pitals. Only a small number of examinations were per-formed using a method other than the one requested by the referring practi-tioner; compare with Figure 15.
University
hospital hospitalCounty hospitalDistrict Outpatient care Total
Brain/skull 331 213 98 81 723 Abdomen/pelvis 394 180 72 74 720 Kidneys/urinary tract 208 156 60 49 473 Joints/soft tissue 137 68 43 98 346 Pelvis/hips 112 76 40 33 261 Head/neck 103 51 30 31 215 Testicles/scrotum 71 28 20 13 132 Spine 62 29 15 16 122 Thorax 36 17 6 7 66 Miscellaneous 28 13 5 6 52 Parts of skeleton 6 6 5 1 18 Trauma CT 6 8 3 0 17 University
hospital hospitalCounty hospitalDistrict Outpatient care Total
Brain/skull 355 213 103 15 686 Abdomen/pelvis 408 182 96 28 714 Kidneys/urinary tract 226 177 68 10 481 Joints/soft tissue 135 83 72 56 346 Pelvis/hips 116 81 50 15 262 Head/neck 113 56 42 7 218 Testicles/scrotum 66 33 26 6 131 Spine 61 29 23 8 121 Thorax 36 18 10 2 66 Miscellaneous 28 11 10 0 49 Parts of skeleton 6 10 5 0 21 Trauma CT 6 8 3 0 17
Table 6. Number and percentage of CT, MRI and US examinations for the most common organ areas. Brain/skull is the predominant organ area
for both CT, at 41.7%, and MRI, at 47.2%. The organ area abdomen/pelvis, at 34.0%, is predominant as far as concerns US.
CT No. Brain/skull 272 41.7% Head/neck 120 18.4% Abdomen/pelvis 58 8.9% Spine 50 7.7% Joints/soft tissue 49 7.5% Thorax 40 6.1% Miscellaneous 18 2.8% Trauma CT 17 2.6% Parts of skeleton 14 2.1% Pelvis/hips 12 1.8% Kidneys/urinary tract 3 0.5% MRI No. Brain/skull 313 47.2% Joints/soft tissue 169 25.5% Spine 71 10.7% Head/neck 35 5.3% Abdomen/pelvis 33 5.0% Pelvis/hips 18 2.7% Thorax 16 2.4% Parts of skeleton 7 1.1% Kidneys/urinary tract 1 0.2% US No. Abdomen/pelvis 623 34.0% Kidneys/urinary tract 477 26.0% Pelvis/hips 232 12.7% Brain/skull 138 7.5% Testicles/scrotum 131 7.2% Joints/soft tissue 127 6.9% Head/neck 63 3.4% Miscellaneous 31 1.7% Thorax 10 0.5%
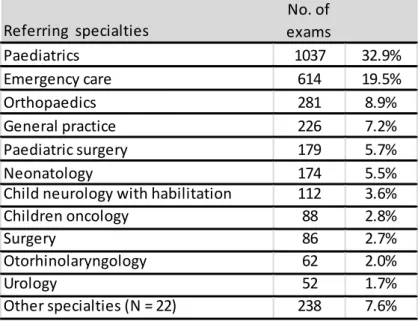
The most common referrer’s specialty was paediatric and adolescent medicine, followed by acute medical care and orthopaedics (Tables 7,
8).
Table 7. Number and percentage of examinations requested by respec-tive specialty.
Paediatric and adolescent medicine was the predominant specialty. Several specialties belong to acute medical care, though they are not specified in the requests. Consequently, only limited conclusions can be drawn in terms of specialty.
Table 8. The referring practitioner’s requested method options of CT, MRI, US and X-ray, grouped by most common specialty (most refer-rals). Several specialties are accounted for that belong to acute medi-cal care.
The specialty paediatric and adolescent medicine represents the majority of requests. The availability of MRI for acute medical care is low and more diffi-cult to deal with, above all for children < 5 years.
Referring specialties examsNo. of
Paediatrics 1037 32.9% Emergency care 614 19.5% Orthopaedics 281 8.9% General practice 226 7.2% Paediatric surgery 179 5.7% Neonatology 174 5.5%
Child neurology with habilitation 112 3.6%
Children oncology 88 2.8%
Surgery 86 2.7%
Otorhinolaryngology 62 2.0%
Urology 52 1.7%
Other specialties (N = 22) 238 7.6%
Referring specialties US CT MRI X-ray Total
Paediatrics 653 134 237 12 1036 Emergency care 397 177 31 9 614 Orthopaedics 111 58 110 2 281 General practice 113 37 59 15 224 Paediatric surgery 129 33 17 0 179 Neonatology 151 3 20 0 174
Child neurology with habilitation 29 35 48 0 112
Paediatric oncology 38 14 35 1 88
Surgery 57 20 5 4 86
Otorhinolaryngology 10 38 12 1 61
In 38 cases, examinations were performed using a different method with a higher radiation dose than the method requested by the refer-ring practitioner. In 23 cases, examinations were performed using a different method with a lower radiation dose than the method
request-ed by the referring practitioner (Table 9).
Table 9. Performed method other than the method requested, involving a higher, lower or the same radiation dose. The left-hand column shows the referrers’ specialty.
The overall conclusion is that a changed method might imply either a higher or reduced radiation dose. The proportion of examinations that were
changed is shown as a percentage.
Marginal differences were found between requested and performed examinations on the part of all the modalities of CT, MRI and US for
all organ areas (Tables 10, 11, 12).
Table 10. The most common organ areas for CT. A comparison be-tween requested and performed examinations.
There were marginal differences between requested and performed CT ex-aminations for all organ areas. The highest number was represented by brain/skull.
Note that the total number of reviews of referring practitioners’ requests for CT, MRI and US examinations was 6,642. Seven examinations, correspond-ing to 14 reviews, were cases of the referrcorrespond-ing practitioner havcorrespond-ing chosen a different examination that is not presented.
Examinations - other than requested Examinations - with increased dose Examinations - with lower dose Examinations
performed Percentage change to higher dose Paediatrics 16 9 7 888 1% Emergency care 12 7 5 602 1% Orthopaedics 2 1 1 279 0% General practice 18 11 7 206 5% Paediatric surgery 1 1 0 178 1% Paediatric oncology 1 1 0 87 1% Surgery 6 4 2 80 5% Otorhinolaryngology 2 1 1 60 2% Urology 1 1 0 51 2% Paediatric cardiology 1 1 0 16 6% Neurosurgery 1 1 0 16 6%
Table 11. The most common organ areas for MRI. A comparison be-tween requested and performed examinations.
There were marginal differences between requested and performed MRI examinations for all organ areas. The highest number was represented by brain/skull.
Table 12. The most common organ areas for US. A comparison be-tween requested and performed examinations.
There were marginal differences between requested and performed US ex-aminations for all organ areas. The highest number was represented by ab-domen/pelvis. CT Brain/skull 277 44.1% 272 41.7% Head/neck 111 17.7% 120 18.4% Abdomen/pelvis 54 8.6% 58 8.9% Joints/soft tissue 44 7.0% 50 7.7% Spine 42 6.7% 49 7.5% Thorax 41 6.5% 40 6.1% Miscellaneous 17 2.7% 18 2.8% Trauma CT 17 2.7% 17 2.6% Parts of skeleton 12 1.9% 14 2.1% Pelvis/hips 11 1.8% 12 1.8% Kidneys/urinary tract 2 0.3% 3 0.5% Referrals Examinations MRI Brain/skull 305 46.6% 313 47.2% Joints/soft tissue 168 25.7% 169 25.5% Spine 71 10.9% 71 10.7% Abdomen/pelvis 35 5.4% 35 5.3% Head/neck 34 5.2% 33 5.0% Pelvis/hips 18 2.8% 18 2.7% Thorax 16 2.4% 16 2.4% Parts of skeleton 6 0.9% 7 1.1% Kidneys/urinary tract 1 0.2% 1 0.2% Referrals Examinations US Abdomen/pelvis 624 34.4% 623 34.0% Kidneys/urinary tract 467 25.7% 477 26.0% Pelvis/hips 229 12.6% 232 12.7% Brain/skull 136 7.5% 138 7.5% Testicles/scrotum 132 7.3% 131 7.2% Joints/soft tissue 124 6.8% 127 6.9% Head/neck 64 3.5% 63 3.4% Miscellaneous 31 1.7% 31 1.7% Thorax 9 0.5% 10 0.5% Referrals Examinations
Brain/skull was the most common organ area examined using CT and MRI (Tables 6, 10, 11), and for US, abdomen/pelvis (Tables 6, 12). The median waiting time for examinations was four days.
Occasional-ly, extended waiting times are attributed to planned checks (Table 13).
Table 13. Waiting times from referral date to examination date. Comment
The median value is 4 days; the maximum value is 767 days, which can be explained by follow-up visits over the course of 1 to 1.5 years.
The number of children in Sweden over a 16-year period decreased by 4% up to and including 2011 (Figure 1). In the Stockholm region, the number of children rose constantly over the same period by 16%. (Ref. specialist adviser in radiology, Stockholm County Council) (3).
Justification and referral quality
The reviewers assessed that the radiological examination was justified or probably justified in 96% of the cases, and unlikely to be justified in 4% of the cases. The percentage of assessed justification is shown by region (Figures 11, 12).
Waiting time Days
Min 0
Max (e.g. planned checkups) 767
Average 23
Figure 11. The reviewers’ assessment of referrals in terms of justifica-tion.
Assessment by reviewers showed a very high level of justification, at 84% of the cases, and probably justified in 12% of the cases, on the basis of referral information.
The difference was marginal between regions in terms of the review-ers’ assessment of justification (Figure 12).
Figure 12. Percentage of reviews with assessed degree of justification, presented by region.
In percentage of reviewed referrals. Assessment by reviewers showed a high proportion of the examinations as being justified, or probably justified, on the basis of referral information. The Stockholm-Gotland region had the largest percentage of requested examinations deemed unlikely to be
justi-0% 10% 20% 30% 40% 50% 60% 70% 80% 90% 100% Justified Probably
justified be justifiedUnlikely to Not justified Cannot bejudged
Assessment of justification 0% 10% 20% 30% 40% 50% 60% 70% 80% 90% 100%
Not justified Unlikely to be justified
Probably justified Justified
fied. A small number of the examinations (<1%) were assessed to be unjusti-fied.
Referral quality was assessed as high; 96% were considered adequate or relatively adequate, 3% somewhat inadequate, and 1% inadequate. Assessed referral quality is shown by region (Figures 13, 14).
Figure 13. The reviewers’ assessment of referrals in terms of referral quality.
The reviewers’ assessment of referral quality showed a very high proportion of adequate referrals, at 82% of the cases, and relatively adequate referrals at 14%.
The difference was marginal between regions in terms of the review-ers’ assessment of referral quality (Figure 14).
0% 10% 20% 30% 40% 50% 60% 70% 80% 90% 100% Adequate Relatively
adequate inadequateSomewhat Inadequate Cannot bejudged
Assessment of referral quality
0% 10% 20% 30% 40% 50% 60% 70% 80% 90% 100%
Stockholm South Uppsala
Örebro West Southeast North
Inadequate Somewhat inadequate
Relatively adequate Adequate
In percentage of reviewed referrals. The reviewers’ assessment of referral quality showed very high or relatively high referral quality on the basis of referral information. The North region shows a somewhat lower level of re-ferral quality.
Method options: agreement and disagreement
All combinations of the requested method, performed method and method preferred by a reviewer, plus the number of reviews with each combination, are shown for CT (Table 14), MRI (Table 15), US (Ta-ble 16) and X-ray (Ta(Ta-ble 17).
Table 14. Number of reviews showing all combinations of the referring practitioners’ requested CT examinations, the methods performed, and the reviewers’ preferred methods. A green cell indicates a reduced ra-diation dose.
In only 30 reviews (2%), a method involving non-ionising radiation was cho-sen by the radiologist. On the other hand, in 324 reviews (25%), a method involving non-ionising radiation was chosen by the reviewer. The reviewers chose a method option without previous knowledge about the modalities available.
Table 15. Number of reviews showing all combinations of the referring practitioners’ requested MRI examinations, the methods performed and the reviewers’ preferred methods. A red cell indicates an increased radiation dose.
Of the MRI examinations requested by a referring practitioner, the radiologist chose a method involving ionising radiation in less than 1% of the 1,422 reviewed referrals. The reviewers preferred a method involving ionising radi-ation in 201 review cases (14%).
The reviewers chose a method option without previous knowledge about the modalities available.
Requested
method Method used for examination Method chosen by reviewer No. of reviews
CT CT CT 863 CT CT MRI 208 CT CT X-ray 126 CT CT US 90 CT MRI MRI 17 CT US US 9 CT MRI CT 3 CT US CT 1
Table 16. Number of reviews showing all combinations of the referring practitioners’ requested US examinations, the methods performed and the reviewers’ preferred methods. A red cell indicates an increased radiation dose.
Of the US examinations requested by a referring practitioner, the radiologist chose a method involving ionising radiation in less than 0.3% of the 3,811 reviewed referrals. The reviewers preferred a method involving ionising radi-ation in 197 review cases (5%).
The reviewers chose a method option without previous knowledge about the modalities available.
Requested
method Method used for examination Method chosen by reviewer No. of reviews
MRI MRI MRI 1153
MRI MRI CT 120
MRI MRI X-ray 76
MRI MRI US 60
MRI CT CT 4
MRI CT MRI 5
MRI CT US 3
MRT MRI Scintigraphy 1
Requested method Method used for
examination Method chosen by reviewer No. of reviews
US US US 3523 US US X-ray 122 US US MRI 79 US US CT 68 US US Scintigraphy 4 US CT US 7 US CT CT 3 US MRI US 2 US MRI MRI 1 US US US-guided punction 1 US CT MRI 1
Table 17. Number of reviews showing all combinations of the referring practitioners’ requested X-ray examinations, the methods performed and the reviewers’ preferred methods. A green cell indicates a reduced radiation dose.
Of the X-ray examinations requested by the referring practitioner, the
radiol-ogist chose a method involving reduced dose from ionising radiation in 36%
of the 88 review cases. The reviewers preferred a method without ionising radiation in 24 review cases (27%).
The reviewers chose a method option without previous knowledge about the modalities available.
The reviewers agreed on the referring practitioners’ chosen method, which was also used for the respective examination, as regards CT in 51% of the cases; MRI, 68%, and US, 88%, out of all the
examina-tions performed (Tables 18, 19, Figures 15, 16, Tables 20, 21).
Table 18. The reviewers’ agreement with referring practitioners and radiologists as regards the preferred method options encompassing US, MRI, CT and X-ray.
The reviewers showed a high level of agreement with the referring practi-tioners and radiologists when it comes to US. This suggests significant con-sensus when it comes to using US. The reviewers showed a lower level of agreement with the referring practitioners and radiologists when it comes to CT and MRI. This situation led to analyses of the level of agreement be-tween reviewers vis-à-vis referring practitioners and radiologists on the part of various organ areas; see below (in the case of six examinations, the refer-ring practitioner requested ‘Other’, which is not presented here).
Requested method Method used for
examination Method chosen by reviewer No. of reviews
X-ray CT X-ray 28 X-ray CT CT 23 X-ray US US 18 X-ray US X-ray 11 X-ray CT US 3 X-ray US MRI 2
X-ray X-ray MRI 1
X-ray MRI X-ray 1
X-ray CT Scintigraphy 1 Method Reviewers agree No. of exams Requested method No. of exams Method used No. of exams US 1592 1816 88% 1832 87% MRI 447 654 68% 663 67% CT 322 628 51% 653 49% X-ray 0 45 1 Other 6
The reviewers agreed on a preferred method other than the referring practitioners’ chosen method, which was also the one used for the respective examination, as regards CT, 14%; MRI, 5%; and US, 2%; out of all the examinations performed (Table 19, third line, Figures 15, 16, Table 20, third line, Table 21, third line).
The reviewers had mixed preferences among the method options. At least one of the reviewers preferred the same method as the referring practitioner, which was also the one used for the respective examina-tion, as regards CT, 30%; MRI, 24%; and US, 9%; out of all the ex-aminations performed (CT: Table 19, second line; MRI: Table 20, second line; US: Table 21, second line, Figure 16).
Table 19. The reviewers’ agreement with referring practitioners and radiologists as regards choice of the method option CT.
Line 1: The reviewers agreed among themselves and with the referring prac-titioners’ choice of method.
Line 2: The reviewers disagreed among themselves, where at least one re-viewer preferred the same method as the referring practitioner and as per-formed by the radiologist.
Line 3: The reviewers agreed among themselves on a different method than requested by the referring practitioner and as performed by the radiologist. Line 4: Total number of examinations where the reviewers were in disa-greement, and none of them preferred the same method as the referring practitioner or as performed by the radiologist, and the number of cases where the respective examination used a method differing from the one re-quested by the referring practitioner.
Compared to MRI and US, a smaller percentage agreed on using CT (51%). There was a larger percentage of reviewers who were in agreement on a different method (14%). A larger percentage of the reviewers disagreed among themselves (30%).
Table 20. Agreement data for MRI; quantity and percentage.
Little agreement on not performing MRI (5%). A significant percentage of examinations where the reviewers were in disagreement (25%).
All examinations No.
CT, agreement CT (all indications) 322 51%
CT, no agreement 187 30%
CT, agreement on not using CT 91 14%
Other 28 4%
All examinations No.
MRI, agreement MRI (all indications) 447 68%
MRI, no agreement 160 25%
MRI, agreement on not using MRI 35 5%
Table 21. Agreement data for US; quantity and percentage.
Very high level of agreement on performing US (88%). Very little agreement on performing a method other than US (2%).
Figure 15. Agreement data; quantities for all methods.
Considerable agreement on US as the preferred method; little agreement on CT according to the reviewers.
US, agreement US 1592 88% 944 87%
US, no agreement 170 9% 102 9%
US, agreement on not using US 40 2% 26 2%
Other 14 1% 9 1%
All US 2 years and older
No. of exams No. of exams
0 200 400 600 800 1000 1200 1400 1600 1800 2000 CT MRI US
Agreement wrong method Others
No agreement Agreement right method
Figure 16. Agreement data; percentages for all methods.
High level of agreement for US (88%), less agreement on MRI (68% ), least agreement on CT (51%). The highest level of agreement among the review-ers on not performing CT (14%). Little agreement on not performing MRI (5%). Very little agreement on not performing US (2%).
Outcome for CT: regional quantities and percentages
The reviewers agreed among themselves with the referring practition-ers’ respective choice of method, i.e. = the used method of CT, from the lowest level of 43% (West) to the highest level of 57% (South) (Figures 17, 18).
The reviewers agreed among themselves on a preferred method option that was not CT, where CT had been chosen by the referring practi-tioner, i.e. = the method used, from 10% (Stockholm-Gotland) to 24% (Southeast) (Figures 17, 18).
The reviewers showed internal disagreement. At least one of the re-viewers preferred CT, where CT had been chosen by the referring practitioner, i.e. = the method used, from 15% (Southeast) to 37% (Stockholm-Gotland) (Figures 17, 18). 0% 10% 20% 30% 40% 50% 60% 70% 80% 90% 100% CT MRI US
Agreement wrong method Others
Figure 17. Agreement data for CT. Quantities by region.
Figure 18. Agreement data for CT. Percentages by region.
The highest level of agreement (blue) on performing CT in the South region, the lowest level in the West. The highest level of agreement on not perform-ing (purple) CT in the Southeast and the lowest level in Stockholm-Gotland.
Outcome for MRI: regional percentages
The reviewers agreed among themselves on the referring practitioners’ respective choice of method, i.e. = the method used, MRI, from 59% (Southeast) to 79% (West) (Table 20, Figures 19, 20).
The reviewers agreed among themselves on preferring a method op-tion that was not MRI, where MRI had been chosen by the referring practitioner, i.e. = the method used, from 3% (West) to 13% (South) (Table 20, Figures 20, 21). 0 20 40 60 80 100 120 140 160
Stockholm South Uppsala/Örebro West Southeast North
CT agreement not CT Others
CT no agreement CT agreement
Reviewers' agreement with referrers and examiners
0% 10% 20% 30% 40% 50% 60% 70% 80% 90% 100%
Stockholm South Uppsala/Örebro West Southeast North
agreement not-CT Others
CT no agreement CT agreement
The reviewers showed internal disagreement. At least one of the re-viewers preferred MRI, i.e. = the method used, from 17% (West) to 32% (Southeast) (Table 20, Figures 19, 20).
Figure 19. Agreement data for MRI examinations by region
Figure 20. Agreement data for MRI. Percentage of examinations by re-gion.
Comment
The highest level of agreement (blue) on performing MRI in the West region, lowest level in the Southeast. The highest level of agreement on not (purple) performing MRI in the South region, and the lowest level in the West region.
The reviewers agreed among themselves on the referring practitioners’ respective choice of method, i.e. = the method used, US, in 88% of the cases. 0 20 40 60 80 100 120 140 160 180
Stockholm South Uppsala/Örebro West Southeast North
MRI agreement not-MRI Others
MRI no agreement MRI agreement
Agreement data for MRI
0% 10% 20% 30% 40% 50% 60% 70% 80% 90% 100%
Stockholm South Uppsala/Örebro West Southeast North
MRI agreement not-MRI Others
MRI no agreement MRI agreement
The reviewers agreed among themselves on preferring a method op-tion that was not US, where US had been chosen by the referring prac-titioner, i.e. = the method used, in 2% of the cases.
The reviewers showed internal disagreement. At least one of the re-viewers preferred US, where US had been chosen by the referring practitioner, i.e. = the method used, in 9% of the cases (Figure 16, Table 21).
The reviewers preferred an examination reducing radiation dose in 399 of the reviewed cases and a method raising the radiation dose in 489 of the reviewed cases, out of a total of 6,656 reviewed cases (Ta-bles 14, 15, 16, 17).
Outcome: brain/skull and region
The reviewers agreed among themselves on the referring practitioners’ respective choice of method, i.e. = the method used, CT of brain/skull, from 34% (West) to 68% (Southeast) (Figures 22, 23).
The reviewers agreed among themselves on preferring a method op-tion other than the referring practiop-tioner’s choice, i.e. = the method used, CT of brain/skull, from 9% (Stockholm-Gotland) to 32% (West) (Figures 21, 22).
Figure 21. Agreement data for CT of brain/skull. Quantities by region.
0 10 20 30 40 50 60 70 80 90 100
Stockholm South Uppsala/Örebro West Southeast North
CT agreement not-CT Others
CT no agreement CT agreement
Figure 22. Agreement data for CT of brain/skull. Percentages by region.
The highest level of agreement on performing CT was shown by the South-east region, with the lowest level of agreement shown by the West region. The highest level of agreement on not performing CT was shown by the West region, with the lowest level of agreement shown by Stockholm-Gotland.
Outcome: CT of brain/skull
The brain/skull is the most common organ area for CT at 42% of all CT examinations.
The reviewers agreed among themselves on the referring practitioners’ respective choice of method, i.e. = the method used, CT of the
brain/skull, in 48% of the cases.
The reviewers agreed among themselves on preferring a method op-tion other than the referring practiop-tioner’s choice, i.e. = the method used, CT of brain/skull, in 16% of the cases.
The reviewers showed internal disagreement. At least one of the re-viewers preferred CT of the brain/skull, where CT had been chosen by the referring practitioner, i.e. = the method used, in 31% of the cases (Table 22). 0% 10% 20% 30% 40% 50% 60% 70% 80% 90% 100%
Stockholm South Uppsala/Örebro West Southeast North
CT agreement not-CT Others
CT no agreement CT agreement