Store image perceptions
A case study of the hypermarkets in Jönköping
Master’s thesis within Consumer Behavior
Author: Linus Wikström
Tutor: Adele Berndt
Acknowledgements
First and foremost the author would like to acknowledge the valuable advice and unwave-ring patience of his tutor, Associated Professor Adele Berndt, for never giving up on him throughout the process of writing this thesis.
Further, the author would like to thank his family and friends for their support, as well as fellow students that helped develop the final product of this thesis through suggestions of improvement during the seminars held.
Lastly the author would like to thank the store managers of Ica Maxi, Coop Forum and City Gross for allowing the study to take place at their stores.
Thank You!
Jönköping, May 2015
Master’s Thesis in Consumer Behavior
Title: Store image perceptions – A case study of the hypermarkets in
Jönköping
Author: Linus Wikström
Tutor: Adele Berndt
Date: 2015-05-11
Subject terms: Store image, Customer satisfaction, Store Loyalty, Perception, Re
tail mix
Abstract
Background The food retail business is characterized by fierce competition
be-tween a few large actors and low switching costs for consumers due to the similar offerings of the stores. In an oligopolistic market struc-ture like this it is critical for stores to create a loyal customer base in order to gain a competitive advantage. This is achieved through gen-erating customer satisfaction, which is an outcome of a positive evaluation of the store image. In the market of Jönköping there is one hypermarket, Ica Maxi, which enjoys a dominating market position over its two closest competitors, Coop Forum and City Gross, which must mean that more consumers chose to make their grocery shop-ping at this particular store. Therefore it is interesting to investigate the store image perceptions that the consumers of Jönköping hold of these three hypermarkets, and whether there is large difference be-tween them.
Purpose The main purpose of this thesis is to find out and measure how con-sumers in Jönköping perceive the store images of the three hyper-markets operating in the city, and what importance the different parts of the retail mix weighs on the consumers choice in what store to fre-quent. Further it aims to analyze the findings from the study in order to investigate if there are any differences in the store image percep-tions, and if they might help explain a part of the dominating position Ica Maxi holds on the market.
Method Since store image is already a well defined concept within the market-ing literature, it was most suitable to conduct a quantitative rather than a qualitative study. This was implemented through a question-naire that was distributed to three separate samples, one per investi-gated hypermarket. The data collected was then processed mainly through One-way Analysis of Variance (ANOVA), which allowed for comparisons between the three samples.
Conclusion The consumers of Jönköping ranked the influence of the store image
dimensions on their choice of hypermarket as following; (1) mer-chandise, (2) customer service, (3) reputation, (4) location, (5) price, (6) store layout and design, and (7) advertising and promotion. The perceptions held of the stores images were different between the stores. Ica Maxi was shown to have the most positive store image,
closely followed by City Gross, and Coop Forum had a significantly less favorable image than both its competitors. The difference be-tween Ica Maxi and Coop Forum does explain why the stores have such different market shares. However, there was not a large enough difference in Ica Maxi’s and City Gross’ scores to justify the market share gap between them solely based on store image.
Table of Contents
1
Introduction... 1
1.1 Background ... 1 1.1.1 Store Loyalty ... 1 1.1.2 Customer Satisfaction ... 1 1.1.3 Store Image... 21.1.4 Swedish food retial market ... 2
1.1.5 The hypermarkets in Jönköping ... 3
1.1.6 Ica Maxi ... 3 1.1.7 Coop Forum ... 4 1.1.8 City Gross... 4 1.2 Problem... 5 1.3 Purpose... 6 1.4 Research questions ... 6 1.5 Delimitations... 7 1.6 Definitions ... 7 1.7 Research contribution ... 7
2
Literature review... 8
2.1 Store Image... 82.1.1 Dimensions of store image... 9
2.2 Perception ... 15
2.3 Customer satisfaction... 16
2.3.1 Satisfaction as a process ... 16
2.3.2 Satisfaction as an outcome ... 17
2.3.3 Customer satisfaction in food retailing ... 18
2.4 Customer loyalty ... 18
2.4.1 Behavioral loyalty ... 18
2.4.2 Attitudinal loyalty ... 19
2.4.3 Multi-dimensional loyalty ... 19
2.4.4 Store loyalty in food retailing ... 21
2.5 Relationship between store image, customer satisfaction, and store loyalty... 22
3
Methodology ... 23
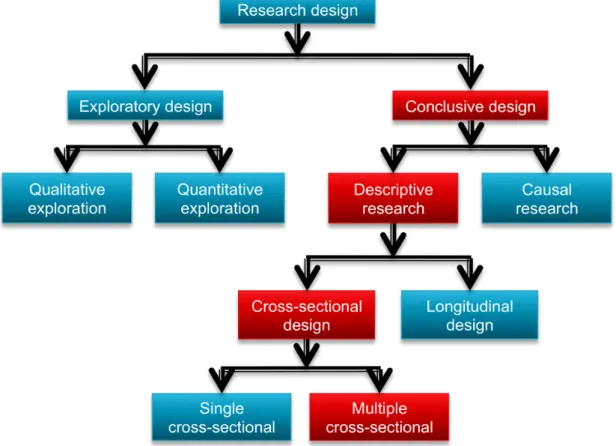
3.1 Research Design... 23
3.1.1 Conclusive research... 24
3.1.2 Descriptive research... 24
3.2 Quantitative and qualitative approach... 25
3.3 Target population ... 25
3.4 Sampling technique... 26
3.5 Sample size... 26
3.6 Data collection... 26
3.6.1 Questionnaire design ... 27
3.6.2 Pretesting the questionnaire... 29
3.7 Data analysis... 29
3.8 Reliability... 29
3.9 Validity... 30
4
Empirical findings ... 32
4.1 Reliability... 32
4.2 Descriptive statistics – entire sample ... 33
4.2.1 Ica Maxi sample ... 34
4.2.2 Coop Forum sample... 35
4.2.3 City Gross sample ... 36
4.3 Importance of store image dimensions in store choice ... 39
4.4 Dimension ratings of the hypermarkets... 40
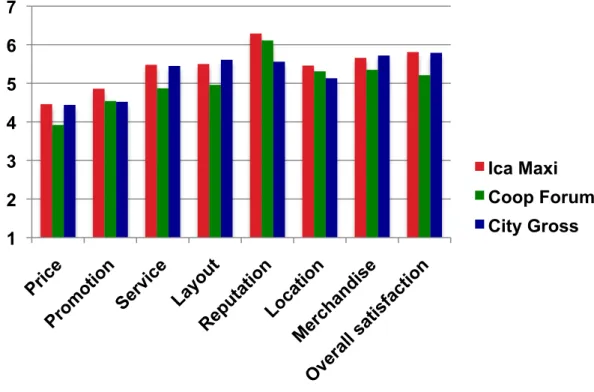
4.4.1 Price ... 41 4.4.2 Advertising... 42 4.4.3 Service ... 43 4.4.4 Layout... 44 4.4.5 Reputation ... 45 4.4.6 Location... 46 4.4.7 Merchandise... 46 4.5 Overall satisfaction... 47
5
Analysis... 48
5.1 Importance of price ... 485.1.1 Store performance and differences ... 48
5.2 Importance of advertising and promotion... 49
5.2.1 Store performances and differences ... 49
5.3 Importance of merchandise... 50
5.3.1 Store performances and differences ... 50
5.4 Importance of store layout and design ... 51
5.4.1 Store performances and differences ... 51
5.5 Importance of customer service and selling... 52
5.5.1 Store performances and differences ... 52
5.6 Importance of store location... 53
5.6.1 Store performances and differences ... 53
5.7 Importance of reputation ... 54
5.7.1 Store performances and differences ... 54
5.8 Customer satisfaction... 55
5.9 Store loyalty ... 55
5.10 Ica Maxi – Dominant performance? ... 56
6
Conclusion ... 59
6.1 Purpose... 59
6.2 Concluding answers to the research questions ... 59
6.3 Managerial implications... 60
6.4 Limitations ... 60
6.5 Suggestions for future research ... 61
Figures
Figure 1-1 Swedish firm market shares. Source: MarketLine (2012b). Food
Retail in Sweden Reference Code: 0181-2058 ... 3
Figure 2-1 Relationship between store image, customer satisfaction and store loaylty ... 8
Figure 2-2 Retail mix and store image... 9
Figure 2-3 Perceptual process ... 15
Figure 3-1 Classification of research designs. Source: Salomon et al. (2012) ... 23
Figure 4-1 Rated importance of store image dimension on hypermarket choice ... 39
Figure 4-2 Differences in importance ratings between samples ... 39
Figure 4-3 Scores on store image dimensions and overall satisfaction per store ... 41
Figure 5-1 Performance on store image dimensions and overall satisfaction56
Tables
Chart 1-1 Store comparison of hypermarkets in Jönköping ... 6Chart 1-2 Key terms and definitions ... 7
Chart 2-1 Store image dimensions ... 10
Chart 2-2 Relative attitude-behavior relationship ... 21
Chart 3-1 Dimensions and attributes for questionnaire ... 28
Chart 4-1 Reliability of scales ... 32
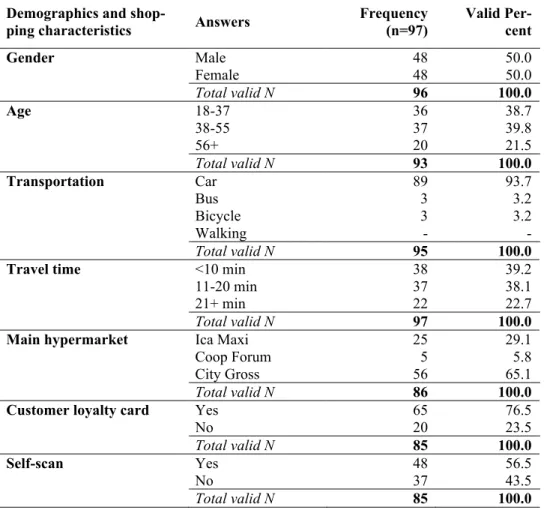
Chart 4-2 Demographics of the entire sample... 33
Chart 4-3 Demographics of the Ica Maxi sample ... 34
Chart 4-4 Demographics of the Coop Forum sample... 35
Chart 4-5 Demographics of the City Gross sample ... 36
Chart 4-6 Descriptive statistics ... 36
Chart 4-7 ANOVA importance of dimensions on store choice... 40
Chart 4-8 ANOVA of price dimension... 41
Chart 4-9 Significant items in price dimension ... 41
Chart 4-10 ANOVA of Advertising dimension... 42
Chart 4-11 Significant items in advertising dimension... 42
Chart 4-12 ANOVA of service dimension ... 43
Chart 4-13 Significant items in service dimension... 43
Chart 4-14 ANOVA of layout dimension ... 44
Chart 4-15 Significant items im layout dimension... 44
Chart 4-16 ANOVA of reputation dimension... 45
Chart 4-17 Significant items in reputation dimension ... 45
Chart 4-18 ANOVA of location dimension ... 46
Chart 4-19 Significant items in location dimension... 46
Chart 4-20 ANOVA of merchandise dimension ... 47
Chart 4-21 Significant items in merchandise dimension... 47
Appendix
Appendix 1 ... 67 Appendix 2 ... 70
1
Introduction
This chapter will provide the reader with a brief introduction to the structure of the food retailing market on both a general and a more specific level. Further it will describe the three Swedish food retailers that are cen-tral to this thesis on the firm level. Lastly, the city of Jönköping and the three operating hypermarkets in-cluded in the study are introduced.
1.1
Background
The world of retailing is ever evolving and has seen some of its major changes in the last century. The changes have affected every aspect of the retail industry as technology is con-stantly being improved and the effects of globalization are becoming apparent. Due to the drastic changes in its environment it is imperative for a retailer to keep up with the current changes and adapt to them in order to stay viable (Dunne & Lusch, 2008). This certainly holds true within the food retail industry, which will be the focus of this thesis. Mainly, the changes of the industry has been the shift from many smaller individual mo-and-pop type stores to having a few large chains that dominate the market, as well as the introduction of much larger store formats such as the hypermarket. According to Oxford Dictionaries (2013, n.p) a hypermarket is “a very large self-service store with a wide range of goods and a large car park, typically situated outside a town”. Today the industry is characterized by being highly competitive with a few large retailers, which control a large share of the mar-ket. The explanation for the fierce competition in the industry can be found in the market structure, which is oligopolistic competition that is dominated by a few large actors and where the stores offer very similar products and prices. It is as well characterized by having a low switching cost for the consumers, which is why building a strongly loyal customer base is considered to be very difficult (Keh & Park, 1997; Dunne & Lusch, 2008)
1.1.1 Store Loyalty
Consumer loyalty is a widely researched phenomenon that is characterized by a great com-plexity, thus researchers have been unable to produce a single conclusive definition of the concept. The main divide within the field regards whether customer loyalty can be ex-plained solely from a behavioral perspective, or whether the attitudes a consumer holds of the particular retailer influences the loyalty. From the behavioral perspective the focus is on purchasing patterns that define loyalty through repeat purchase of a certain brand, which is believed to lead to customer loyalty (Bandyopadhyay & Martell 2007). The other school of thought claims that in order for consumers to be truly loyal to a retailer they have to not only demonstrate a repeat purchasing pattern, but also hold a positive relative attitude to-wards the retailer. The relative attitude is derived from the consumer evaluating an object where the outcome is placed on a continuum ranging from negative to positive (Dick and Basu, 1994). The relative attitude created towards a food retailer can be simplified to repre-sent customer satisfaction, which is an attitude on a negative-positive scale held by a con-sumer towards a store created through evaluating the shopping experience of the store. Customer satisfaction is therefore widely held as an antecedent of store loyalty (Thang & Tan, 2003; Chang & Luan, 2010).
1.1.2 Customer Satisfaction
Measuring the customer satisfaction of a retailer is thought to be an important way to evaluate the quality of its products and services. Further it has been claimed by Kotler (1991, cited in Anderson & Sullivan, 1993) that customer satisfaction is directly linked to the future profits of a retailer, thus a higher satisfaction will lead to greater financial
suc-cess. For these reasons many retailers have focused on increasing their customer satisfac-tion in order to use it as a competitive advantage (Anderson & Sullivan, 1993; Burns & Bowling, 2010). Just as customer loyalty is a complex concept customer satisfaction does not seem to have one agreed upon definition within the marketing literature. Parker and Mathews (2001) state that there are two main fields of thought among academics regarding customer satisfaction. The first being that satisfaction is a product of a cognitive process where the consumer makes an internal evaluation of the perceived actual performance and compare it to the expected performance, where if the actual performance is higher than the expected the customer will be satisfied. The second is that satisfaction is an outcome based on more affective connections to the shopping experience such as the emotions connected to shopping or the fulfillment of the one’s self-image.
When consumers form their satisfaction of a food retailer it is widely accepted that the ob-ject of evaluation is the store image, which is therefore generally agreed to be antecedent of customer satisfaction, which in turn is an antecedent to store loyalty (Thang & Tan, 2003; Chang & Luan, 2010; (MarketLine, 2012a).
1.1.3 Store Image
The image that a consumer holds of a certain store can be likened to a personality that is projected on the store. This personality consists of several different tangible and intangible attributes that are evaluated by the consumer to form an overall impression. The factors that generally play a big role in the formation of the store image are the products sold, the service quality of the staff, the location of the store, and the atmosphere in the store (Solomon, Bamossy, Askegaard & Hogg, 2006). Martineau (1958, p.47) offers an early definition of the concept of store image as “the way in which the store is defined in the shopper’s mind”. For the retailer it is crucial to create a positive store image since the be-havior of consumers is much determined by the perception they hold of the store. This in-cludes the decisions of what store to visit, how frequently to shop there, how much money will be spent, as well as how strong the loyalty to the store will be (Chang & Luan, 2010).
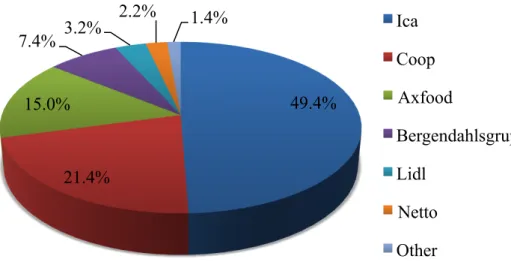
1.1.4 Swedish food retial market
The Swedish food retail industry is, just as the global, dominated by a relatively small num-ber of companies. The four main actors on the market are ICA, Coop, Axfood and Ber-gendahlsGruppen. Together they account for more than 90% of the industry’s market share with ICA being the largest single actor having a market share of 49.4% in 2011. Two successful foreign discount chains that have gained substantial market shares are German Lidl (3.2 %) and Danish Netto (2.2%) (USDA, 2012). The market shares per firm are shown in figure 1.1.
Figure 1-1 Swedish firm market shares. Source: MarketLine (2012b). Food Retail in Sweden Reference Code: 0181-2058
1.1.5 The hypermarkets in Jönköping
Jönköping is located in the southern part of Sweden. It was the eighth largest city in Swe-den in 2010 (SCB, 2010). In 2011 the county had a population of 128,305 and in the city it was 59,781. The city has a logistically strategic location as it connects Stockholm, Sweden’s capital and largest city, with both Gothenburg and Malmö, the second and third largest cit-ies. The city has three operating hypermarkets, which will be further introduced below.
1.1.6 Ica Maxi
Ica Maxi in Jönköping opened in April of 2000 and is owned and operated by an independ-ent retailer. The store has a total floor space of 7,100 m2 of which about 60% are dedicated
to food products and 40% to non-food products. The store has approximately 39,200 cus-tomers per week and generated a 668 million SEK revenue in 2011. Ica Maxi had the larg-est market share on the entire food retail and service market with 16.3% in 2011. When the store was built the location was considered to be in the outskirts of the city, but due to the expansion of the city new residences have been built close to the store and given it a more central location (R. Johansson, personal communication, February 4, 2013). Other than the store there is little commerce in the surrounding area.
Ica Maxi has a wide assortment of food and non-food products. In the food section it of-fers products from both national brands and from Ica’s private label brands. In addition it sells fresh baked goods from its own in store bakery, a salad bar, grilled chicken and ribs, delicatessen and catering food. Non-food products include for example clothing, house wares, media products and a range of garden equipment. There is also an in-store pharmacy (Ica, 2013a).
The store offers its customers a number of services additional to the sale of food. At the customer service desk customers are offered postal services and betting and gambling. Cus-tomers in the Ica customer loyalty program have the option to self-scan and self-checkout and get loyalty card that register information for future promotions. In the store food sam-ples are offered to customers. The customers park for free and have access to a recycling station. The store is open between 07-22 each day (Ica, 2013a).
49.4% 21.4% 15.0% 7.4% 3.2% 2.2% 1.4% Ica Coop Axfood Bergendahlsgruppen Lidl Netto Other
Ica Maxi distributes direct mail advertisement with weekly promotions. The promotions are connected to Ica’s TV commercials. In the store computers are set up where loyalty cus-tomers can swipe their loyalty card to find out their specific promotions (Ica, 2013a).
1.1.7 Coop Forum
Coop Forum store in Jönköping was opened in 2002. It is located at the A6 shopping cen-ter in the eascen-tern part of the city. The total floor space of the store is 9,000 m2, with
ap-proximately 70% devoted to food products and 30% to non-food products (B. Filhage, personal communication, March 26, 2013). The store had a market share of 6.8% of total food retail sales in the county and a revenue of 251 million SEK in 2011 (R. Johansson, personal communication, February 4, 2013). The location at A6 generates large amounts of consumer traffic, as it is one of Jönköping’s largest commercial areas. On average the store has 20,000 visiting customers per week.
Coop Forum is a hypermarket with a large assortment of both food and non-food prod-ucts. The store carries products from Coop’s private label brands as well as from national brands in a wide range of product categories. It also offers the customer fresh fish inside the store. The non-food products offered are for example kitchenware, clothing, books and media (Coop, 2013).
Services provided to customers include free parking, a recycling station, and betting and gambling. Customers that have signed up for Coop’s customer loyalty program have the option to self-scan their goods and self-checkout at the register. By using the loyalty card customers can check their promotions on computer terminals inside the store. The store also offers home delivery of a predetermined basket of goods to customers doing online shopping. The store’s operating hours are 07-22 (Coop, 2013).
Coop Forum offers customers to sign up for an e-mail subscription of their weekly promo-tions, and send out weekly circulars with promotions to consumers in Jönköping. Coop also offers a smartphone application where the customer can see the weekly promotions, recipes and make shopping lists. For its loyalty customers Coop offers a refund of up to 5 % of yearly shopping spending registered to the loyalty card (Coop, 2013).
1.1.8 City Gross
The City Gross hypermarket in Jönköping opened in October 2010. It is located at the A6 shopping centre. The total floor space of the store is 8,000 m2, 65% of the space is
allo-cated to food products and 35% is alloallo-cated to non-food products. The store had a 7.3% market share of the food retail and service market in Jönköping, and the revenue in 2011/2012 was 300 million SEK (J. Åkesson, personal communication, February 12, 2013). By having a location at a popular shopping area a lot of consumer traffic passes by the store. On average the store has 20,000 visiting customers per week.
The store offers consumers a wide range of products in both food and non-food product categories. Besides national brands the store also has products from their own private label brands. The store has a focus on fresh foods, the meat is cut and packaged on location and fresh fish is available in the store. It also has an in-store bakery and charcuteries cut to or-der. It also sells non-food products such as clothing, kitchenware, books, toys and interior design products. City Gross also has a pharmacy in the store (City Gross, 2012).
Customers are offered additional services such as gambling and betting, recycling and free parking. As a loyalty customer the option of self-scanning of goods and self-checkout is
available. Customers that do their shopping online can have the goods delivered to their homes. The store operating hours are 7-22 every day (City Gross, 2012).
The store sends weekly to promotions to consumers through direct mail. When customers use the customer loyalty card information is collected to tailor promotions to individual customers (City Gross, 2012).
1.2
Problem
As was previously stated the food retailing industry is characterized by very intense compe-tition between the acting firms. It is also an industry that has to be very adaptive to the ever-changing demographics of the consumers, and the changes in demand that inevitably follows. These demographic changes have not only changed the generally preferred retail store format to larger stores that satisfy one-stop-shopping, but many changes also involve the expectations on the products the retailers offer. If retailers are not able to satisfy the consumers’ demands on quality, variety and affordability etc. they risk losing customers to their competitors. The intense competition combined with the similar assortments of the different retailers has led to the switching-cost incurred on a consumer that changes from one store to the other is considered to be very low (MarketLine, 2012a). In research find-ings regarding switching behaviors in food retail it has been shown that consumers in food retailing are prone to switch between stores (Leszczyc & Timmermans, 1997; Leszczyc, Sinha & Timmermans, 2000).
The market structure that is closest to explaining that of the hypermarkets in Jönköping is oligopolistic competition, which is characterized by having a few large firms controlling the market, similar product offerings and a high transparency where changes in one firm is no-ticed and reacted to by its competitors. In this type of market it is crucial to develop a competitive advantage that cannot be copied by competitors in order to gain and maintain market shares (Dunne & Lusch, 2008).
Between the three hypermarkets in Jönköping the market is dominated by Ica Maxi, which accounted for 54.8% of all sales in 2011, whereas the competitors Coop Forum and City Gross have 20% and 25% respectively. The market share of the Ica Maxi in Jönköping is larger than Ica’s national market share of 49.4 %. However the national market share fig-ures are not representative of the competition between three hypermarkets on a limited lo-cal market, because a lot of the national domination by Ica can be explained by having sig-nificantly more retail outlets nationwide. Accounted for the number of stores operated by each firm the market shares would be: Ica 41 %, Coop 29 %, and BergendahlsGruppen 30 % (USDA, n.d.). Thus the dominating role of Ica Maxi in the Jönköping market segment becomes even more substantial.
Considering the market structure under which the hypermarkets are operating, and the fierce competition it is characterized by, the substantially larger market share held by Ica Maxi makes it clear that the store must have gained a larger share of the consumers in Jönköping as their loyal customers. Thus it is interesting to find out whether the consumers in Jönköping perceive the stores to have significantly different store images, which is the first step in building customer loyalty. In order to achieve this, the consumers’ perceptions of the store images of the hypermarkets have to be measured, as they are currently un-known. It is also pertinent to find out the importance that the consumers in Jönköping as-sign to each part of the retail mix, as an increased performance on the least important fac-tor will not impact consumer behavior as much as an increase in the most important one.
The three hypermarkets in Jönköping offer consumers very similar merchandise, services and prices. Table 1.1 provides an overview of the stores offerings.
Chart 1-1 Store comparison of hypermarkets in Jönköping
Store Comparison Ica Maxi Coop Forum City Gross
Merchandise
Wide Assortment ✔ ✔ ✔
Private Labels ✔ ✔ ✔
Fresh Fish in Store - ✔ ✔
In-Store Bakery ✔ - ✔
Fresh Meat Counter - - ✔
In-Store Pharmacy ✔ - ✔
Services
Operating Hours 07-22 07-22 07-22
Customer Loyalty Program ✔ ✔ ✔
Self-Scanning & Self
Check-out ✔ ✔ ✔
Post Services ✔ - -
Betting & Gambling ✔ ✔ ✔
Recycling ✔ ✔ ✔
Free Parking ✔ ✔ ✔
Location
Other Commerce Little Much Much
Proximity to Residential
Ar-eas OK Poor Poor
Bus Connectivity Poor OK OK
Price level
PRO survey 1,155 SEK 1,397 SEK 1,162 SEK
Source: City Gross (2012); Coop (2013); Ica (2013); PRO (2012)
1.3
Purpose
The main purpose of this thesis is to find out and measure how consumers in Jönköping perceive the store images of the three hypermarkets operating in the city, and what impor-tance the different parts of the retail mix weighs on the consumers choice in what store to frequent. Further it aims to analyze the findings from the study in order to investigate if there are any differences in the store image perceptions, and if they might help explain a part of the dominating position Ica Maxi holds on the market.
1.4
Research questions
Based on the problem discussion the following research questions have been formulated: What store image dimension has the greatest impact on the consumers when making the choice of what hypermarket to shop at?
Are the hypermarkets store images perceived differently by consumers, and if so what are the differences?
Does the store image perception of Ica Maxi correlate with the substantial market share gap?
1.5
Delimitations
This thesis will only focus on the geographical market of Jönköping. Although competition in the food retail market includes smaller stores as well as restaurants, this thesis will focus on the hypermarket segment.
1.6
Definitions
Chart 1-2 Key terms and definitions Definitions and key terms
Hypermarket a very large self-service store with a wide range of goods and a large car park, typically situated outside a town (Ox-ford Dictionaries, 2013).
Ica Maxi refers to the Maxi Ica Stormarknad store in Jönköping.
ICA refers to Ica Sweden.
Coop Forum refers to the Coop Forum store in Jönköping.
Coop refers to KF subdivision Dagligvarugruppen.
City Gross refers to the City Gross store in Jönköping.
BergendahlsGruppen is the company that own City Gross.
Perception is the subjective meaning consumers assign to an object (Solomon, Bamossy, Askegaard & Hogg, 2006). Store image is the overall perception a consumer has of a store based on a number of attributes (Dunne & Lusch, 2008). Store image
dimen-sion is a number of similar attributes grouped together, such as store layout (Chang & Luan, 2010).
Store image attributes are specific characteristics of a dimension, such as aisle size, signage and fixtures (Chang & Luan, 2010).
1.7
Research contribution
This thesis will contribute to the field of consumer behavior research since little research has been conducted on store image in the Swedish context. Further, it will add to the litera-ture regarding store image of hypermarkets through conducting a study that compares sev-eral stores. The thesis will also contribute to hypermarket managers understanding of what factors are important to the consumer in the choice of hypermarket.
2
Literature review
This chapter will provide the reader with an overview of the literature regarding store image, customer satis-faction and store loyalty, as well as explain the relationship between the three concepts. It will detail the di-mensions of store image that were chosen for this study. It will also detail the perceptual process, which is an important part of how consumers assign meaning to the different store image dimensions. Figure 2.1 shows the relationship between store image, customer satisfaction and store loyalty that will be the main model used to analyze the results of the following study. The model is here shown in a simplified version and will be ex-plained in more detail during this chapter.
Figure 2-1 Relationship between store image, customer satisfaction and store loaylty
2.1
Store Image
The concept of store image can be explained as the store’s personality. This personality is a construct that has two sides to it. On the one side it is the image that the retailer wants to create and convey to the consumers, and on the other side is the image that is perceived by the consumer. The main motivation of a consumer to visit a retailer is to satisfy a need, and the main object of the retailer is to satisfy this need in order to convert a visiting consumer into a paying customer. In order for the consumer to choose to frequent a certain retailer the store must be perceived to be able to satisfy that need. This is why it is crucial to the re-tailer to identify the optimal retail mix that satisfies the needs of as many consumers as possible (Dunne & Lusch, 2008; Solomon et al., 2006).
The overall store image is a construct consisting of several different dimensions, which in turn consist of specific attributes. An example of a dimension could be the location of the store, which is evaluated through the attributes such as accessibility and availability of par-king etc. Through the perception and evaluation of several dimensions a consumer creates an overall image of the store (Chang & Luan, 2010; Solomon et al., 2006). Within the mar-keting literature the concept of store image has been given many different definitions; “the way in which the store is defined in the shopper’s mind.” (Martineau, 1958, p. 47), “the complex of a consumer’s perceptions of a store on different (salient) attributes.” (Bloemer & de Ruyter, 1998, p. 501), “the overall perception the consumer has of the store’s envi-ronment.” (Dunne & Lusch, 2008, p. 524) and “the complex of a consumer’s perceptions of a store on different attributes based on the customer’s previous experience.” (Chang & Luan, 2010, p. 513). When a consumers creates the store image of a certain retailer their past experience with this retailer as well as the emotional responses involved in the process have a strong effect on whether the outcome is positive or not (Newman & Cullen, 2002, in Chang & Luan, 2010). The general consensus in the literature regarding store image crea-tion is that it is a process in which the consumer evaluates a store on a number of salient factors to which the outcome is a subjective impression of the store that will guide the con-sumers behavior. After the concon-sumers have created a perception of a store’s image they will determine whether the overall image is positive or not. A positive store image will increase the chances of the consumer choosing a certain retailer to frequent, whereas a negative one will rather make the consumer avoid that store. The store image does not only have an im-pact on the choice of store, but it also affects how the consumer perceives the products sold in the store (Solomon et al., 2006).
2.1.1 Dimensions of store image
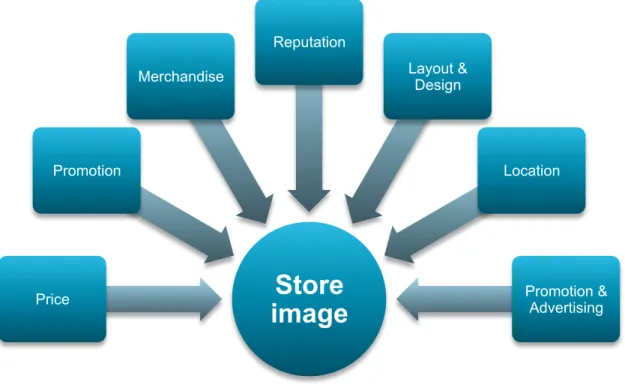
As previously mentioned, store image is often treated as the result of a multi-attribute mo-del where a consumer evaluates several salient store characteristics according to the weigh-ted importance the consumer subjectively assigns to them. One consumer might for ex-ample find that a convenient location of the store is more important than low prices. This consumer will then have a more positive evaluation of a store with a convenient location and high prices than a consumer who would foremost value low prices (Bloemer & de Ruy-ter, 1998). Although some dimensions may have a stronger influence on the store image perception than others, consumers will evaluate them all and generate an overall impression (Solomon et al., 2006). Further, it has been shown in research that dimensions can affect the behavior of consumers even though they are not consciously noted. This means that when a dimension that was previously less salient is changed to the negative it will be con-sidered more important and therefore affect the consumers’ overall perception of the store image, as well as their behaviors (Turley & Milliman, 2002). If for example a consumer does not reflect much over the impact of store layout on the shopping experience, and then the layout is changed to be perceived as more confusing, it may lead to a more negati-ve store image. The construct of store image is illustrated in figure 2.2 below.
Figure 2-2 Retail mix and store image
Although the process is explained here as an evaluation of different dimensions it is a simp-lification of a much more complex process that is further explained later in this chapter. What is worth noting here is that the dimensions are groupings of many underlying attribu-tes, for example attributes of the location dimension are availability of parking, proximity to work or home, accessibility by any means of transportation etc (Dunne & Lusch, 2008; Solomon et al., 2006). Since the process is subjective it is impossible to cover all attributes that can be evaluated in the process, which is why those that are generally considered as sa-lient in literature on the subject will be chosen for this study.
Store
image
Price Promotion Merchandise Reputation Layout & Design Location Promotion & AdvertisingThe store image dimensions that are included in the evaluation of store image are those included in the retail mix (Bloemer & de Ruyter, 1998). Dunne and Lusch (2008) explain the retail mix as a combination of the six dimensions; 1.) merchandise, 2.)price, 3.) adverti-sing and promotion, 4.) customer service and selling, 5.) store layout and design, and 6.) lo-cation that are used to appeal to the retailer’s target market. However, different authors have proposed many different sets of dimensions included in the retail mix over the years as shown in table 2.1. In this thesis the retail mix proposed by Dunne and Lusch (2008) will be used, and added to it will be the dimension of reputation. This retail mix offers a smaller number of well-defined dimensions that are broad enough to capture all the important cha-racteristics that influence the store image. This allows for the attributes that make up the dimension to be adapted to the characteristics of different industries. In this thesis the retail mix can be adapted to suit the food retailing industry in Sweden and in particular to the hypermarket store format. Other definitions of the retail mix are less appropriate for this thesis as they contain either too many dimensions, or too few. Some of the dimensions, such as fashion in the Porter & Claycomb (1997, in Chang & Luan, 2010) retail mix are not suitable to a study of hypermarkets since although the stores sell clothes it is not their main objective, and the clothes sold are rarely considered to be fashionable. The decision to add the dimension of reputation was taken because two of the hypermarkets in this thesis are privately owned and one is cooperatively owned, and previous research has found large dif-ferences in performance between privately operated and cooperatively operated food retai-lers (Jørn Juhl, Kristensen & Østergaard, 2002). Another reason for adding reputation is that City Gross has only existed in Sweden for 20 years, whereas Ica and Coop have both existed for about 100 years. The City Gross hypermarket in Jönköping is also fairly new as it opened in late 2010, and the competitors have existed for more than 10 years each. Chart 2-1 Store image dimensions
Authors Dimensions
Fisk (1961) Convenient location, product’s suitability, price, selling promo-tion, store atmosphere, post-transactional satisfaction
Hansen & Deut-scher (1977)
Merchandise, service, clientele, physical facilities, convenience, promotion, store atmosphere, institutional factors, post-transactional satisfaction
Porter &
Clay-comb (1997) Fashion, selection, quality of merchandise, customer service, sa-les personnel, physical condition, store atmosphere Cox & Brittain
(2000) Merchandise, store location, promotion, pricing policy, service, store clientele, store atmosphere, layout Burt &
Carralero-Encinas (2000) Customer service, store reputation, produce range, physical cha-racteristics, character and pricing policy Davies & Ward
(2002) Merchandise (assortment, quality, brand mix and price); store (location, internal and external environment, atmosphere and name/fascia); service (personnel and levels of quality); promo-tion (advertising/public relapromo-tions and in-store)
Thang & Tan
Chang & Luan (2010)
Merchandise, service personnel, convenience, store atmosphere, services
Source: Adapted from Chang and Luan (2010); Thang and Tan (2003)
2.1.1.1 Price
The pricing of its products is a crucial task to the retailer since it is directly connected to the profitability of the firm. The retailer has to choose a pricing strategy that will both en-sure that it can compete with other stores, and at the same time it has to generate profit (Dunne & Lusch, 2008). The price level of the store is also of high importance to the con-sumer since it is salient dimension to most. In many studies that have been conducted on store image of food retailers the consumers have rated price to be one of the most impor-tant dimensions (Amine & Cadenat, 2003; Baltas & Papastathopoulou, 2003; Chang & Luan, 2010). This is why it is not only important for the retailer to choose a pricing strate-gy, but to also convey it to consumers. The price dimension of the retail mix includes the stores overall price level and its price range (Amine & Cadenat, 2003). The overall store price image (OSPI) is the belief a consumer holds of the general price level of a store based on the prices of individual products, often those that mount up to high costs and are fre-quently bought. Consumers form different OSPI’s for different stores and use this when making comparisons between stores (Desai & Talukdar, 2003). For example a family that purchase a lot of meat at their regular store will use those prices in a comparison with a new store and form OSPI based on its price of meat. Dunne and Lusch (2008) argue that the price dimension is the least effective in differentiating a retailer as competitors easily can copy any changes to the strategy. This has become the reality of French grocery super-stores, where competitive pricing has led to all stores having practically the same price level (Amine & Cadenat, 2003). As the price study by PRO in table 1.1 shows, this is the situa-tion between Ica Maxi and City Gross where the price difference is only 7 SEK, or 0.06%. However Coop Forum is approximately 21% more expensive than its competitors accor-ding to the study. Since the hypermarkets in Jönköping are competing in a oligopolistic market structure the price competition is crucial to the stores (Dunne & Lusch, 2008). The OSPI formed by consumers of a store has an impact on the choice of what store they will primarily shop at (Alba, Broniarczyk, Shimp, & Urbany, 1994; Desai & Talukdar, 2003). In a study conducted by Baltas and Papastathopoulou (2003) price was found to have a moderate influence on consumers’ store choice. Geuens, Brengman and S’Jegers (2003) found that consumers do not want to look for the best prices, but instead have fair prices guaranteed by the retailer. They also found that consumers want prices to be presen-ted in a way that makes them easy to compare between products. In a study by Krukowski, McSweeney, Sparks and Smith West (2012) most participants expressed that perceived costs, such as OSPI, were of importance in the choice of grocery retailer. The study also showed that the price image of certain product groups were more important than others. 2.1.1.2 Merchandise
Merchandise management consists of the analysis, planning and purchasing, and handling of a retailer’s merchandise. The analysis must be performed in order to make sure the as-sortment and quality of the merchandise meets the expectations of consumers. After it is determined what merchandise to acquire it is important to plan the purchases to make sure the store is not out of stock, which can lead to upset customers. The handling of merchan-dise ensures that products are presented in the right place and that it is not damaged. The goal of merchandise management is to find the optimal merchandise mix. This includes de-ciding the variety, breadth and depth of product assortment that best satisfies customers
(Dunne & Lusch, 2008). Most consumers will prefer a wide assortment of products for three main reasons; the first is that there is an increased chance of finding what they want, secondly, consumers want to learn about their alternatives, and lastly to satisfy their variety seeking (Hoch, Bradlow & Wansink, 1999). According to Amine and Cadenat (2003) con-sumers tend to form an assortment image on the store level based on how they perceive the variety within specific product categories that are important to them. The best perfor-ming food retailers are often those that offer their customers a broader assortment of pro-ducts (Dhar, Hoch & Kumar, 2001).
Baltas and Papastathopoulou (2003) found that merchandise quality and merchandise varie-ty were the most important attributes when consumers make their choice of store. These attributes have also been shown to have a significant impact on customer satisfaction (Sha-rif, 2012). Martínez-Ruiz, Jiménez-Zarco and Izquierdo-Yusta (2010) found that the quality perception of a retailer has significant influence on customer satisfaction. According to the study by Krukowski et al. (2012) the availability and quality of fruit, vegetables and meat is important to consumers in their store choice.
One part of merchandising that has had a growing importance lately is that of private label branding. By having private label brands in their assortment retailers can differentiate themselves from competitors through offering low-cost products exclusive to that retailer (Dunne & Lusch, 2008). When retailers started introducing private label brands the pro-ducts where low-cost and low-quality copies of manufacturer brands (Dawson, 2013). Ho-wever as retailers realized the competitive advantage of private labels they have invested in increasing product quality (Nies & Natter, 2012). According to Dhar et al. (2001) the most successful retailers have in common that their private label brands are perceived as being high quality. In a study by Nies and Natter (2012) the quality of a private label brands was found to have a positive effect on both the store image and store choice. However, private labels have in another study been shown to only have a weak influence on store choice compared to other attributes (Baltas & Papastathopoulou, 2003). Gonzales-Benito and Martos-Partal (2012) found that private label brands also have, to a certain degree, a positi-ve impact on store loyalty.
2.1.1.3 Advertising and promotion
Retailers use advertising and promotion to make consumers aware and interested in their product offerings. Advertising is used to inform consumers about the price and availability of products. This is usually communicated through television, newspapers and printed cir-culars. Popular sales promotions such as coupons, frequent buyer programs, in-store dis-plays, and sampling are used to create demand and stimulate trial. The overall objectives of advertising and promotions are to create a positive store image, attract new customers and increase patronage of existing customers (Dunne & Lusch, 2008). One promotional activity that has gained grounds is customer loyalty schemes, where consumers earn points when shopping (Lundberg & Lundberg, 2010). The loyalty schemes are incentives to create repe-at purchases (Lewis, 2004). The nrepe-ature of the cumulrepe-ative promotions is thought to incur a switching cost on the consumer, therefore increasing the customer retention (Meyer-Waarden & Benavent, 2009).
Chang and Luan (2010) found that promotions and membership schemes do significantly influence the store image. They are however among the attributes with the lowest influen-ce. Similarly Thang and Tan (2003) found that promotions and advertising have the wea-kest influence on store preference. The results of Lundberg and Lundberg (2010) study suggests that loyalty programs do influence store choice when it comes to large basket
shopping. They also found that most Swedish consumers are members of at least three lo-yalty programs. Meyer-Waarden and Benavent (2009) found that lolo-yalty programs only have little impact on purchasing behavior and that the loyalty is short lasting.
2.1.1.4 Store layout and design
One of the main objectives of the store environment is to create a positive store image. This is accomplished through managing the four main elements of the store environment. (1) Visual communication; such as point-of-sale signage. (2) Store planning; regards space allocation and layout. (3) Store design; which includes exterior design, lighting and ambian-ce. (4) Merchandising; includes the selection of fixtures, merchandise presentation and vi-sual merchandising, such as choosing the optimal shelf placements (Dunne & Lusch, 2008). Many customers value convenient store layouts that will save them time when shopping. A poor store layout that confuses and delays will incur a psychic cost on the customers, which will make them more prone to generate a negative store image (Baker, Parasuraman, Grewal & Voss, 2002). In food retailing it is more important to consumers that the store environment is clean and functional rather than having attractive fixtures and displays (Martinelli & Balboni, 2012).
The study by Thang and Tan (2003) showed that store atmosphere does have a significant influence on customers’ store preference, however the influence was found to be among the weakest of the dimensions. Other studies have found that the store atmosphere is one of the most important contributor to store image. The most important attribute of the sto-re layout dimension was found to be the ease of finding the goods, which sto-requisto-res a clear layout with good signage (Chang & Luan, 2010; Baltas & Papastathopoulou, 2003). Partici-pants in the Geuens et al. (2003) study expressed the importance of the store environment to reduce stress when shopping. They also concluded that the store should be spacious, bright and play appropriate music.
2.1.1.5 Customer service and selling
Dunne and Lusch (2008) define customer service as “all those activities performed by the retailer that influence (1) the ease with which a potential customer can shop or learn about the retailer’s offering, (2) the ease with which a transaction can be completed once the cus-tomer attempts to make a purchase, and (3) the cuscus-tomer’s satisfaction with the transac-tion.” (p. 393). The customer service activities are performed before, during and after the transaction is being made. Pre-transaction services are for example having convenient ope-rating hours, which makes it easier for consumers to visit the store. The services that are performed during the transaction include personal selling, additional facilities such as a café and restrooms, as well as making sure that customers do not have to spend to much time waiting to check out at the register. The post-transaction services include handling returns and complaints from dissatisfied customers. The quality of the sales staff plays a major role in the services that are offered during and after the purchase. The consumers visiting the store will evaluate the performance of the staff based on their perceived knowledge, availa-bility, attitude and the efficiency at the checkout. In a hypermarket the staff’s knowledge is especially important in the sections containing fresh food, and the availability is important to help customers find the products they are looking for since hypermarkets are large and have thousands of items in the assortment. The service attitude of the staff has a great ef-fect on the shopping experience and the perception of the store image (Chang & Luan, 2010; Dunne & Lusch, 2008; Mehta, Lawani & Han, 2000). The quality of the customer service is one of the most important dimensions of the retail mix for building a competitive advantage when other dimensions such as merchandise, price and location are similar to the competition. A retailer with high quality customer service that exceeds the consumer’s
expectations will increase its customer satisfaction and loyalty (Dunne & Lusch, 2008; Mar-tinelli & Balboni, 2012).
The study by Chang and Luan (2010) showed that the quality of the service personnel is one of the most important factors in determining store image. The friendliness, attitude and expertise of the staff have been mentioned as important personnel attributes (Chang & Luan, 2010; Krukowski et al. 2012, Geuens et al., 2003). Participants in the Geuens et al. (2003) study wanted their food retailers to offer additional services such as cafeterias, re-staurants, child care services, the availability of recycling and home delivery. Thang and Tan (2003) found that in-store services were significant in creating store preference. However post-transaction services were not found to be significant. The results of Martinelli and Balboni (2012) study showed that service quality is an antecedent to both customer satis-faction and store loyalty.
2.1.1.6 Location
The store location is one of the main competitive factors for a retailer, as consumers prefer to shop at the most convenient location (Dunne & Lusch, 2008). Many consumers will choose to patronize a specific retailer solely because it has a location that is most conveni-ent to them (Rowley, 2005). The distance a customer has to travel to get to a retailer is an important determinant of store patronage (Uncles & Kwok, 2009). Besides proximity the accessibility, whether through private or public transportation, is also an important factor in store choice (Baltas & Papastathopoulou, 2003). This includes the availability of parking facilities and the proximity to public transportation (Dunne & Lusch, 2008). Accessibility is important to consumers because it will make shopping more time efficient (Thang & Tan, 2003). In a market where competitors have almost identical product offerings, even a small advantage in location convenience can lead to superior performance (Craig, Ghosh & McLafferty, 1984).
In the Thang and Tan (2003) study the accessibility dimension, consisting of the attributes ease of travel, parking, and duration of travel, was found to be the second most important in the consumers choice of store. The convenience of location and availability has been shown to have positive influence on store image (Chang & Luan, 2010). They also found that although retailers are located close to each other consumers do perceive differences in accessibility. Geuens et al. (2003) found that consumers who do not own cars value public transportation. Those that own cars dislike looking for parking space, and therefore value large parking lots.
2.1.1.7 Reputation
The reputation of a corporation is formed through the aggregation of individual images of the corporation. The aggregate consists of both the individual evaluations of corporate ac-tivity and perceptions of the corporate identity (Fombrun & Rindova, 2000, in Rolfe & Barron, 2009). The reputation then is the general consumer perception of a corporation rather than the individual perception of its image. If an individual holds a positive image of a corporation that has a general negative image, the reputation of the corporation as a who-le will not be affected. According to Thang and Tan (2003) store reputation is the impres-sion consumers form of a store based on attributes such as heritage, location and past re-cord of reliability. The reputation of a company has a major impact on how consumers perceive the quality of their products (Veloutsou & Moutinho, 2009). A company’s reputa-tion is highly affected by word-of-mouth (WOM), as customers will share their experiences with other people in their environment. If a company can generate positive WOM it will lead to a more positive reputation. However negative WOM often has a stronger influence
on consumers than positive WOM (Solomon et al., 2006). Due to WOM a consumer may have created a perception about the characteristics of a company without having any first hand experiences with it. For example a consumer that has never owned an Apple product may have a negative perception of the iPhone if many of his peers have had trouble with their phones. The reputation of the hypermarket chains is interesting in this thesis for a number of reasons. First, one of the hypermarkets is cooperatively owned and operated, whereas the other two are private enterprises. Jørn Juhl et al., (2002) found large differen-ces in consumers’ perceptions of cooperative and private food retailers. The cooperative retailers were found to be more old-fashioned and expensive than the private retailers. The private retailers were found to have more loyal customers as well as higher levels of custo-mer satisfaction. Secondly, two of the food retail chains, Ica and Coop, are two of the ol-dest chains in Sweden and have had strong market presence for a long time. City Gross however has only existed in Sweden for 20 years with most of its operations being run in southern Sweden. Therefore it can be assumed that the recognition of the brands are more well known when it comes to Ica Maxi and Coop Forum.
The reputation of a food retailer is an important attribute for creating a positive store ima-ge and customer loyalty. In the study by Chang and Luan (2010) the reputation was found to be the hypermarket attribute that was most important to consumers. Another study by Thang and Tan (2003) found that the reputation has a strong influence on what retailer is preferred by consumers.
2.2
Perception
Since consumers are exposed to great amounts of different sensations, such as sights, smells, and sounds, in their daily life they need to decide which ones deserves attention. This is done through the perceptual process, an internal process in which the consumer as-signs meaning to an object through subjective evaluations (Solomon et al., 2006). The per-ceptual process is shown in figure 2.3.
Figure 2-3 Perceptual process
In the first step of the process the consumer is exposed to sensory stimuli such as smells, sights, sounds, tastes or textures. Due to the great amount of stimuli a consumer is exposed to each day, the strength of the exposure to each stimulus will vary depending on whether it is noticed by a consumer. As consumers are not able or willing to process all stimuli they create perceptual filters based on their past experiences, which allows them to select what stimuli to pay attention to. A stimulus is more likely to be noticed if it is related to the con-sumer’s current needs. Some stimuli will be noticed subconsciously while some are not no-ticed at all. The repetition of exposure over time will also influence the likelihood of pro-cessing a stimulus (Solomon et al., 2006). When consumers are shopping at a hypermarket they are exposed to a great amount of stimuli in one visit to the store. Therefore the
con-sumer will choose to pay attention only to those stimuli that are considered important to that specific consumer. However if the consumer is pleased with the store and chooses to re-visit it the unprocessed stimuli from the last visit may be paid more attention.
After the consumer has been exposed to sensory stimuli, the second part of the process re-gards the attention that is given to the stimuli. Attention is described as the amount of fo-cus that is put on the stimulus during the exposure to it. The amount of attention paid to stimuli varies depending on its importance to the consumer (Solomon et al., 2006). For ex-ample if a consumer is very price sensitive, then stimulus regarding the price level of a store will be paid much attention.
Once attention has been paid to a stimulus the consumers enters the final step of the pro-cess, which is the interpretation of the stimulus. This is the step where the consumer as-signs meaning to the sensory stimuli. The interpretation of the stimulus is heavily influen-ced by the person’s previous beliefs and feelings. The meaning that is assigned to the sti-mulus is very subjective, and the same stisti-mulus can have another meaning to a different person. The final outcome of the process is the perception that will be held about the ob-ject the person was exposed to in the first stage. This is also the stage of the process in which the consumer decides whether the outcome of the process is a positive or negative perception (Solomon et al., 2006). For example the consumer who is price sensitive might interpret the price of meat as too high based on previous beliefs, whereas a less price sensi-tive consumer might interpret the same price as fair.
The whole perceptual process indicates that the first impression of the retailer to its new customers is extremely important since a positive evaluation of the store image dimensions will increase the chances of repeat purchase.
2.3
Customer satisfaction
Customer satisfaction has long been one of the most focal points within marketing, con-cerning both managers as well as researchers. The managerial interest in the subject revol-ves around satisfying the needs of the customers in order to gain a competitive advantage, which has been proven to be a successful strategy to increase the firm value (Burns & Bow-ling, 2010; O’Sullivan & McCallig, 2012). Keith (1960) was among the earliest to recognize that the role of a retailer was to satisfy the needs of the consumers rather than simply offe-ring a wide variety of goods. Since then the subject has attracted a lot of attention in the academic world with more than 15,000 articles having been published on the matter (Peter-son & Wil(Peter-son, 1992 in Parker & Mathews, 2001). Even though the amount of research on customer satisfaction is so vast there seems to be a lack of a generally accepted definition of the concept. Instead the field of literature seems to be split into thinking of customer sa-tisfaction in two different ways. The first, and most widely used, view of the concept is that customer satisfaction is a process. The second is that it is an outcome of a shopping expe-rience (Parker & Mathews, 2001).
2.3.1 Satisfaction as a process
According to Solomon et al., (2006, p.328) customer satisfaction can be defined as “the overall feelings, or attitude, a person has about a product after it has been purchased” and that the state of satisfaction arises from a constant process of evaluating as products are in-teracted with in daily consumption activities. This evaluation is a cognitive process that re-volves around the expectation held by a consumer and the actual outcome. The main theo-ry regarding customer satisfaction as a process is the expectation-disconfirmation paradigm
developed by Oliver (1977,1981). The paradigm posits that consumers hold expectations about the performance of a product that will be compared to the perceived actual perfor-mance and that the experienced difference between these will lead to a disconfirmation. The disconfirmation can be either positive, when the perceived actual performance exceeds the expected, which will lead to a higher level of satisfaction. Or it can be negative, where the actual performance does not live up to the prior expectations, which will lead to a dis-satisfied customer. The process can be applied not only on a product level but also to a sto-re, if the actual shopping experience exceeds what the consumers have expected they will leave satisfied, and if it does not live up to expectations the consumer will be dissatisfied (Dunne & Lusch, 2008). Bloemer and de Ruyter (1998) propose that because it is difficult to create expectations and evaluate performance, customer satisfaction is a continuum with manifest satisfaction on one end and latent satisfaction on the other end. Manifest satisfac-tion is achieved through a well-elaborated evaluasatisfac-tion of the expectasatisfac-tion and the perfor-mance whereas latent satisfaction is when no explicit evaluation is made due to lack of mo-tivation and/or ability to make a comparison.
As an alternative to the expectation-disconfirmation paradigm Westbrook and Reilly (1983 in Yi, 1990) developed a model called the value-percept theory. This model focuses more on the emotional responses of the cognitive process, such as the wants, needs and desires of the consumer rather than the expectations. The consumers then derive their level of sa-tisfaction from the perceived difference between the desired performance of the object and the perceived actual performance. This model also makes it possible to account for satis-faction found in aspects of the object that could not be expected by the consumer. The authors suggest the use of both the expectations-disconfirmation paradigm as well as the value-percept theory in order to get a better measurement of customer satisfaction.
Another theory that has been included in the view of satisfaction process is the equity the-ory developed by Adams (1963, in Szymanski & Henard, 2001), which posits that individu-als will use reference groups as a comparison in order to determine whether or not their outcome is fair. The comparison is based on the input/output ratio, where consumers will be satisfied if they perceive that their equity ratio is greater than that of the person or group of whom they compare their outcomes to (Szymanski & Henard, 2001).
2.3.2 Satisfaction as an outcome
When customer satisfaction is viewed as an outcome rather than a process, the general idea is that satisfaction arises from emotional responses to the shopping experience instead of the cognitive responses. According to Yi (1990) it is likely that the consumer’s feelings, po-sitive or negative, have an influence on the process of evaluating a product, and the level of satisfaction that is perceived after a purchase. In the study by Westbrook and Oliver (1991) the authors found that the emotions of consumers in fact do have an impact on the con-sumer’s level of satisfaction. The emotion of surprise was found to substantially influence the level of satisfaction, whether the consumer was surprised negatively or positively by the shopping experience.
Customer satisfaction can also be viewed from a motivational perspective where consu-mers aim to reach a personal fulfillment through shopping. This perspective can be viewed from Maslow’s (1943) theory that people will aim to satisfy their needs in a hierarchical or-der. Thus satisfaction can be seen as the end goal, or outcome of fulfilling their shopping needs (Parker and Mathews, 2001).
2.3.3 Customer satisfaction in food retailing
The reason that customer satisfaction is of high importance for the food retailer is that it is closely linked to the profitability of the store. A customer that is satisfied with the shopping experience is much more likely to return than a dissatisfied one, meaning that the customer will eventually spend more of its income at the store that is found to be satisfying. With the fierce competition, low switching cost, and similarities between the stores in food retailing it is even more important to generate satisfied customers as they can easily switch to a another store once their expectations are not being met (Dunne & Lusch, 2008; Fornell, 1992). Much research on customer satisfaction has been carried out in food retail settings, such as supermarkets and hypermarkets. These store formats have been found to be a complicated subject to study as the amount of attributes within a store that has an influen-ce on the consumers’ evaluation of their satisfaction are enormous. Thus it is of great im-portance for managers within the industry to identify the attributes within the store that are most important to their customers. These attributes are both those that have the greatest impact on satisfaction as well as those that are connected to dissatisfaction. When these have been identified the managers can focus on making the attributes associated with grea-ter satisfaction betgrea-ter and to minimize or eliminate those that create dissatisfaction (Ting & Chen 2002).
2.4
Customer loyalty
To have a loyal customer base is regarded as one of the most important assets to a compa-ny. One of the main reasons is the cost associated with gaining new customers, as it has been estimated to cost as much as five times more to get one new customer than to retain an already existing one. Customer loyalty has therefore been a subject of interest to both managers as well as researchers for a long time (Kumar & Shah, 2004; Pan, Sheng & Xie, 2012). The food retail industry has lately seen an increase in competition and companies are operating on very low margins. The consumers in the industry is known to spend the bulk of their food budget in one primary store, and those customers that are loyal to the store often spend considerably more than non-loyal customers (Huddleston, Whipple & VanAu-ken, 2003). Thus it has become crucial to companies to find a competitive advantage that will retain their loyal customer base. Building and retaining store loyalty within the food re-tail industry is considered to be a difficult task since customers experience that the swit-ching costs of going to another store is very low (Kumar & Shah, 2004; Doherty & Nelson, 2008; Dunne & Lusch, 2008). Customer loyalty is a rather complex concept and therefore does not have a single definition that is agreed upon amongst researchers. However, many researchers agree that customer loyalty is a construct of both the customers’ attitudes to-wards the store and their purchasing behaviors such as repeat purchase (Dick & Basu, 1994; Kumar & Shah, 2004).
2.4.1 Behavioral loyalty
When customer loyalty first became a research subject the general consensus was that it was a behavioral phenomenon. The measuring of loyalty then revolved around the con-sumption behaviors that were observed among consumers. Some of the measures that have been given attention in the literature are proportion of purchase dedicated to a specific brand or store, the probability of repurchase and actual repeat purchase behavior (Cun-ningham, 1966; Lipstein 1959; Brown 1952, in Kumar & Shah, 2004). The main assump-tion of the view of loyalty as behavioral is that a consumer will become more and more lo-yal to a brand as the purchase of the product is repeated over time. According to Bei and Chiao (2006) the Proportion of Purchase Method is the most accurate way to measure the