Mohammed Ahmed
Service Quality in Accounting
Firms: its Effect on Client
Satisfaction and Loyalty
A quantitative study based on the Swedish
listed companies
Business Administration
Master’s Thesis
30 Credits
Term: Spring 2018
Acknowledgement
I would like to express my gratitude to:
- My family, friends, teachers, and colleagues who helped and encouraged me.
- My supervisor Bertrand Pauget for his patience, support and valuable guidance that helped me to accomplish the project.
- My examiner Markus Fellesson for his valuable feedback.
- The staff and library staff at Karlstad University for their support and assistance.
- The respondents who helped me by answering the survey and sending feedback.
- The opponent groups for their worthy comments, which played a pivotal role in improving the project.
Karlstad, June 2018
______________________ Mohammed Ahmed
Abstract
Background: The quality of service is considered as an essential component
in any service industry. It has been evolved in service marketing and has often been used in other research fields and sectors. Further, researchers have emphasized the importance of measuring the quality dimensions over years and in various industries in order to manage it. Also, they have proposed that enhancing the quality of services enhances customer satisfaction and loyalty, in turn that will enable the service provider to meet the changes and challenges in its business environment.
Purpose: Based on listed companies’ perception at Nasdaq Stockholm OMX,
the study seeks to evaluate the service quality provided by accounting firms in Sweden and determine the situation of its dimensions, as well as to explore their direct impact on the client satisfaction and client loyalty. In addition, the study utilizes the SERVPERF model to measure the service quality’s dimensions.
Approach/methodology: To achieve the purpose, the study conducts a
deductive and quantitative approach with explanatory purpose. Also, the data has been collected based an online questionnaire. It was sent to 450 listed companies at Nasdaq Stockholm OMX, resulting in a sample of 58 respondents. The analysis has been conducted based on regression analysis.
Result/discussion: the research presents and discusses the result based on
two hypotheses groups separately. The first hypotheses group regarding the impact of service quality and its dimensions on customer satisfaction. The second hypotheses group concerning the impact of service quality and its dimensions on customer loyalty.
Originality: To the researcher’s knowledge this study is considered as a first
attempt using a multi-dimension scale to assess the service quality of the accounting firms in Sweden based on the perception of Swedish listed companies.
Keywords: Quality of service, SERVQUAL, SERVPERF, customer loyalty,
customer satisfaction, Accounting firms, Nasdaq Stockholm OMX.
Contents
1. Introduction ... 1
1.1. Background ... 1
1.2. Problem discussion ... 2
1.3. Aim ... 4
1.4. Outline of the thesis ... 4
2. Theoretical framework ... 6
2.1. The importance of service quality ... 6
2.1.1. Financial scandals and collapses ... 6
2.1.2. Highly competitive market ... 7
2.1.3. Rapidly developing technologies... 8
2.2. Service quality concept ... 8
2.3. Service quality models... 9
2.3.1. SERVQUAL model ... 10
2.3.2. SERVPERF model ... 10
2.3.3. The dimensions of service quality ... 11
2.4. Customer loyalty ... 12
2.5. Customer satisfaction ... 13
2.6. Previous studies and hypotheses formulation ... 14
2.6.1 Previous studies ... 14 2.6.2. Formulation of hypotheses ... 15 3. Methodology ... 18 3.1. Research approach ... 18 3.2. Research Method ... 19 3.3. Data Source ... 20
3.4. Operationalization and measurement ... 20
3.5. Pretesting ... 21
3.6. Data collection methods ... 21
3.7. Population and Sampling ... 22
3.7.1. Identification the research’s population ... 22
3.7.2. Sampling ... 23
3.7.3. Selecting the sample size ... 24
3.7.4. The process of random selection ... 24
3.8. Data analysis ... 25
3.8.1 Descriptive statistics ... 25
3.8.3 Regression analysis ... 26
3.9. Research quality ... 26
3.9.1 Validity ... 27
3.9.2. Reliability ... 28
3.9.3. Ethical consideration ... 29
4. Empirical findings and results ... 31
4.1. The sample’s participants ... 31
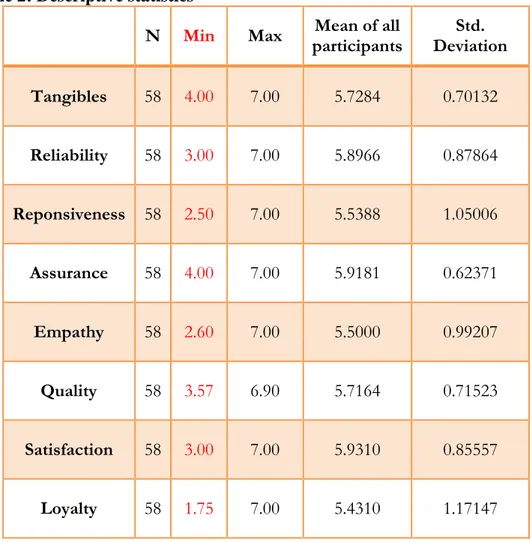
4.2. Descriptive statistics... 32
4.3. Frequency table ... 33
4.4. Reliability analysis ... 33
4.5. Construct validity: ... 34
4.6. Hypothesis testing: First group ... 35
4.6.1. The impact of service quality on customer satisfaction ... 35
4.6.2. The impact of service quality dimensions on customer satisfaction ... 36
4.6.3. Summary of hypotheses testing: First group ... 38
4.7. Hypothesis testing: Second group ... 39
4.7.1 The impact of service quality on customer loyalty ... 39
4.7.2. The impact of service quality dimensions on customer loyalty ... 40
4.7.3. Summary of hypotheses testing: Second group ... 41
5. Discussion ... 43
5.1. Descriptive statistic and frequency table ... 43
5.2. Discussion of results: First group ... 43
5.3. Discussion of results: Second group ... 44
6. Conclusion ... 46
6.1. Managerial implications ... 47
6.3. Limitations and further research recommendations ... 48
7. References ... 50
8. Appendix ... 56
List of figures Figure 1: Conceptual model of quality according to SEVQUAL & SERPERF ... 12
Figure 2: Conceptual model of service quality and customer satisfaction... 16
List of tables
Table 1: The sample’s participants ... 31
Table 2: Descriptive statistics ... 32
Table 3: Frequency table ... 33
Table 4: Cronbach’s alpha ... 34
Table 5: Constructive validity ... 35
Table 6: Model summary of service quality and satisfaction ... 36
Table 7: ANOVAa concerning service quality and customer satisfaction ... 36
Table 8: Model summary regarding quality dimensions and satisfaction ... 37
Table 9: ANOVAa regarding quality dimensions and satisfaction ... 37
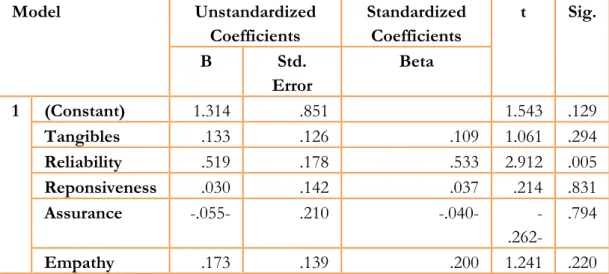
Table 10: Coefficients table regarding quality dimensions and satisfaction ... 37
Table 11:Summary of hypotheses outcomes: First group ... 39
Table 12: Model summary concerning service quality and customer loyalty ... 40
Table 13: ANOVAconcerning service quality and customer loyalty ... 40
Table 14: Model summary regarding quality dimensions and loyalty ... 41
Table 15: ANOVAregarding quality dimensions and loyalty ... 41
Table 16: Coefficientsregarding quality dimensions and loyalty ... 41
1
1. Introduction
In order to put the reader on the thesis track, this chapter will demonstrate the background and the importance of service quality, discuss the research problem, as well as demonstrate the aim and the research questions that have been raised based on the problem discussion. Finally, the outline of the thesis has been presented.
1.1. Background
Service quality is an essential element and strategic instrument for business sustainability in today’s changeful and competitive business environment. It has a crucial role in improving business performance, gaining competitive merit, and meeting clients demands. Therefore, it is considered as a key factor in enhancing customer relationships and achieving success (Chumpitaz Caceres & Paparoidamis 2007; Jain & Gupta 2004; Kranias & Bourlessa 2013; Reheul et al. 2013).
The service quality has become increasingly important and the requirement for enhancing it has become a top priority due to the rapid growth of the service sector and its growing contribution to the economy, as well as to meet the challenges arising from increased competition (Carrillat et al. 2009; Mariotti et al. 2013; Priporas et al. 2017b). As a result, the quality of service has gained considerable growing interest among researchers and practitioners (Lewis 1989; Reheul et al. 2013).
Originally, the service quality has been developed in the field of service marketing, and it has frequently been utilized in other research areas likewise (Caruana 2002; Dahlgaard-Park 2015). Due to the non-material nature of the services, great efforts have been made to understand, determine and measure its quality in order to manage it (Aga & Safakli 2007; Asher 1990; Jain & Gupta 2004).
Researchers have presented different views regarding service quality, which has led to various definitions and measurement models. However, these views are generally based on the subjective quality which relies on the perception of client and his/her judgment. Besides, some researchers focused on the client's expectations to assess the service quality. Others have depended on the client's real perception, while other studies have based on the gap between the client's expectations and the client's real perception to assess it (Cronin & Taylor 1992; Parasuraman & Zeithaml 2002; Smart 1995).
2
Currently, the multidimensional structure models SERVQUAL and SERVPERF are considered as the most common scales (Dahlgaard-Park 2015; Reheul et al. 2013). They have been established by expert researchers, and they have been refined through many stages, statistical examinations, and empirical studies. Particularly, SERVQUAL evaluates the quality based on the variance between client’s expectations and perceptions (Bearden & Netemeyer 2011; Parasuraman et al. 1988; Yildiz 2017).
Even though the SERVQUAL is still one of the most commonly used scales, it has been criticized by many researchers in term of the expectations part. Therefore, SERVPERF scale which bases on the perception section only of SERVQUAL has been created as an alternative for SERVQUAL. More precisely, a SERVPERF scale is the SERVQUAL scale without the expectation part. It explains the quality based on an overall assessment of perceived quality rather than relying on variation. Gradually, many researchers have used SERVPERF, and recommended it, especially in the accounting industry (Cronin & Taylor 1992; Dahlgaard-Park 2015; Jain & Gupta 2004; Reheul et al. 2013).
Specifically, due to the increasing competition and increasing number of accounting scandals, the accounting service providers have strived to offer superior quality of accounting services with the aim of retaining current clients and gaining new clients. In line with this, researchers have utilized accountancy and service marketing literature to understand and measure the intangible services quality of accounting firms to be able to manage it (Aga & Safakli 2007; Bean et al. 1996; Cory & Huttenhoff 2011).
1.2. Problem discussion
Changes in the business environment affect corporate sectors all over the world (Jankalová 2012; Manzella 2005). Globally, the accounting industry faces various changes and challenges (King & Fitzgerald 2016; Zainuddin & Sulaiman 2016). Consequently, the accounting firms in Sweden are no exception. Therefore, as any business sector, they have to respond to these changes in order to maintain their relevance and sustainability in this volatile and competitive environment (Jankalová 2012; King & Fitzgerald 2016; Manzella 2005).
Some of these changes and challenges that are affecting the accounting industry are: the increasing competition in today's markets coupled with the privacy of accounting as a highly competitive industry offering similar services
3
(Richard & Chang 2012; Saxby et al., 2004; Jasinskas et al. 2016), as well as the financial scandals and collapses that have affected confidence and the relationship between the accounting firms and their clients (Cheng et al., 2009; Cory & Huttenhoff 2011; Kalui & Mbakaya 2014). Last but not least, developments in technology have led to the automation of traditional accounting services and the creation of new service lines such as advisory services (Ackerman 2017a, 2017b; King & Fitzgerald 2016).
In such today’s changeful and competitive business environment, the researchers emphasize that enhancing customer satisfaction and loyalty plays a significant role in having long-term relationships with clients, keeping business surviving, and achieving success (Aga & Safakli 2007; Arokiasamy 2013; Ismail et al. 2006; Nuchsarapringviriya & Fadzil 2015). Because loyal and satisfied clients will have the willingness to deal with the firm over time, as well as they will have the willingness to buy other services from the same firm, and lastly they will attract new customers (General Accounting Officer [GAO] 2003; Gilmore 2003; Prus & Brandt 1995).
The quality of service has been examined as one of the factors that may have a direct and indirect impact on client satisfaction and loyalty by researchers in different industries. They have proposed that enhancing the quality of services will enhance customer satisfaction and loyalty, in turn, that enables the service provider to meet the changes and challenges (Aga & Safakli 2007; Carrillat et al. 2009; Dahlgaard-Park 2015; Kranias & Bourlessa 2013).
Researchers have based their studies on the subjective perception of the quality as key approach to gain a deep understanding of measuring and managing the quality of service (Parasuraman et al. 1988; Wetzels et al. 2000). According to Zeithaml & Bitner, the quality of service is” a focused evaluation that reflects the customer's perception of specific dimensions of service: reliability, responsiveness, assurance, empathy, tangibles” (2003, p. 85). This implies that the assessment of quality depends on the clients’ perceptions of service quality’s dimensions. Accordingly, the businesses have to listen to the customer’s voice and concentrate their efforts and resources to improve client-driven quality in order to satisfy clients’ demands for the quality. Hence, providing better service quality will increase the clients’ benefits, and enhance the success of the service provider (Arokiasamy 2013; Bean et al. 1996; Batagan et al. 2009; Parasuraman et al. 1988; Prus & Brandt 1995).
Considering that, providing high-quality services seems to be an essential and prerequisite element for success. Researchers emphasize the importance of
4
evaluating services quality and its relationship with customer satisfaction and customer loyalty in different industries and over time to determine their changes and trends, and to provide the service providers with indicators to determine the priority actions and decisions they should implement to enhance the quality and settle major service problems (Caruana 2002; Dahlgaard-Park 2015; Ismail et al. 2006; Parasuraman et al. 1988). In line with this, this study is considered as a first contribution and attempt to assess the services quality dimensions of the accounting firms in Sweden based on the perception of Swedish listed companies.
1.3. Aim
According to the above, the research aims to assess the quality of the accounting service and its dimensions based on the perceptions of Swedish listed companies as customers of accounting firms. Also, the study seeks to examine the influence of quality and its dimensions on customer satisfaction and customer loyalty.
In order to provide the management of accounting firms in Sweden with indicators that allow them to invest their efforts and resources to enhance the dimensions of quality and relationships with customers, and to meet changes and challenges.
Accordingly, the thesis raises the following research questions:
-What are the levels of service quality dimensions provided by accounting firms based on the perception of Swedish listed companies?
-What are the direct impacts of service quality provided by accounting firms and its dimensions on the customer satisfaction based on the perception of Swedish listed companies?
-What are the direct impacts of service quality provided by accounting firms and its dimensions on the customer loyalty based on the perception of Swedish listed companies?
1.4. Outline of the thesis
This research project consists of six chapters, as follows:
Chapter one presents the background, problem discussion, the aim and the
research questions have been raised.
Chapter two presents the relevant literature and theory that covers the subject
5
Chapter three presents the research method has been used, as well as
describes other elements of the research design in line with collected data and research goal.
Chapter four displays the findings of the empirical data that has been
collected from 58 respondents. Where the analysis has been conducted based on regression analysis, the construct validity based on correlation analysis, and the internal reliability based on Cronbach’s alpha test.
Chapter five discusses and explains the statistical findings that have been
presented in the result section and the outcome of hypotheses testing in the light of the theory that has been presented in theoretical framework chapter.
Chapter six displays the conclusion of the research project, in addition to the
expected managerial implications, and finally the limitations and suggested research for further reflection.
6
2. Theoretical framework
This chapter presents the relevant literature that covers the subject of research and the basic concepts in the thesis, in order to construct a relevant and solid foundation for the discussion in the following chapters.
2.1. The importance of service quality
Changes and challenges in the business world today such as financial scandals and collapses, increasing competition, and advanced technology, have emphasized the importance of service quality in accounting industry (Aga & Safakli 2007; GAO 2003; King & Fitzgerald 2016; Zaman Groff & Štumberger 2015). According to previous studies, high quality may lead to increase the customer satisfaction and loyalty. As a result, that leads to increase positive impacts such as getting the chance to supply the emerging needs of clients, and decrease the negative impacts of changes and challenges (Gilmore 2003; Parasuraman et al. 1988).
2.1.1. Financial scandals and collapses
Quality of service plays a critical role in establishing and supporting customer confidence (Wetzels et al. 2000). In recent decades, many financial collapse and scandals have occurred in the business world such as WorldCom, Enron, and Andersen LLP. The audit failure has been referred to as one of the main reasons (Cheng et al. 2009; Cory & Huttenhoff 2011; Kalui & Mbakaya 2014; Zaman Groff & Štumberger 2015). For instance, Andersen LLP was one of the big five accounting firms and had been blamed for corporate frauds and failures that caused the Enron’s collapse. Because of that, Andersen had gone out of the business world, and now there is only big 4 instead of big 5 (Cheng et al. 2009; Kalui & Mbakaya 2014). These collapses have emphasized the need for a high-quality accounting service, and a close attention has been paid to explore various factors that may have impacts on the audit quality (Kalui & Mbakaya 2014). The performance and competency of accounting firm’s staff are considered the most important factor in the service quality (Cheng et al. 2009; Morris & Empson 1998; Wetzels et al. 2000). Moreover, the clients’ perception of the service employees’ performance and competency is as an essential component of the service quality measurement models like SERVPERF (Wetzels et al. 2000). Therefore, accounting firms should be sure that their staff is qualified, have the requisite skills and professional characteristics to perform their job according to lawful requirements,
7
standards, and public's anticipation, hence ensure high-quality services (Cheng et al. 2009; Morris & Empson 1998). Furthermore, the clients’ perception of reliability and assurance form fundamental components of quality’s measurement models, where items like achievements on time, accurate records, the employees’ competence and knowledge, and enhancing trust plays a significant role in the quality evaluation process (Parasuraman et al. 1988, Cronin & Taylor 1992). According to previous studies, financial collapses have highlighted the necessary need to improve service quality of accounting firms, specifically, bridging the shortage of staff competencies and professional characteristics (Cheng et al. 2009; Kalui & Mbakaya 2014; Wetzels et al. 2000). 2.1.2. Highly competitive market
The competition has increased in today’s markets (Aga & Safakli 2007; Gilmore 2003). Increased competition has led many service companies to look for profitable ways to distinguish themselves. One of the strategies associated with the success of these companies is the provision of superior quality of service (Aga & Safakli 2007; Parasuraman et al. 1988). According to Dahlgaard-Park (2015) improving the quality of service assists organization to get a competitive advantage and meet the clients' demands. That means the positive assessment of service quality stimulates customers in preferring the service providers (Wetzels et al. 2000). Therefore, if the service provider wants to be distinctive and competes effectively he has to provide a distinctive quality of services (Dahlgaard-Park 2015). Additionally, when the service providers supply almost similar or identical services such as in the case in the accounting firms, where the firms follow the same accounting rules and standard, the quality of service will be a crucial factor to be distinctive from others, hence maintaining the current clients and attracting new customers (Parasuraman et al. 1988; Saxby et al., 2004; Jasinskas et al. 2016). Realizing the role of service quality in the competitive market has encouraged the researchers and practitioners to make repeated efforts in order to understand the quality of service and the requirements of clients in view to enhance the level of service quality. Consequently, a high quality of service increases the firm's possibility to win a higher market share, satisfy the clients' demands, enable the firm to get and retain competitive advantage, and increase the profitability (Cronin & Taylor 1992; Dahlgaard-Park 2015).
8 2.1.3. Rapidly developing technologies
The rapidly development of technology has affected the accounting industry. It has changed the type of provided services and the role of accounting (Ackerman 2017a, 2017b; King & Fitzgerald 2016). The traditional and routine accounting tasks as gathering and processing data have been automated. In contrast, other service lines are growing gradually, specifically advisory services like technology consulting and advanced financial planning (Ackerman 2017a, 2017b; King & Fitzgerald 2016).However, this change creates a challenge for the accounting firms to maintain the relationship with their clients and to be the chosen service provider for these other emerging services and needs by the client. As a reaction to this challenge, Prus and Brandt (1995) refer that, the satisfied and loyal clients usually have the willingness to increase and expand their business with the current service provider through purchasing other services. In addition, the U.S. Government Accountability Office mentions that there is a high opportunity that the satisfied clients will use other services and non-auditing services from the same accounting firm (GAO 2003). Further, according to previous studies, service quality has a positive impact on clients’ satisfaction and loyalty (Gilmore 2003; Ismail et al. 2006; Jasinskas et al. 2016). Therefore, the businesses need to implement strategies that improve the quality of services in order to enhance the clients’ satisfaction and loyalty to boost the likelihood of expanding businesses with current clients and provide them with new trends of accounting services (GAO 2003; Gilmore 2003; Prus & Brandt 1995; Wetzels et al. 2000).
2.2. Service quality concept
The service quality is one of the key components in any industry in today’s highly competitive markets (Chumpitaz Caceres & Paparoidamis 2007; Aga & Safakli 2007; Reheul et al. 2013). It is considered as a strategic instrument to improve the business performance and to achieve the operational efficiency (Jain & Gupta 2004; Kranias & Bourlessa 2013).
Primarily, quality of services has been evolved in the service marketing and has often been used in other research fields and in different business sectors (Caruana 2002; Dahlgaard-Park 2015). However, there is no consensus among researchers about the quality’s definition, whether the quality should be excellent or just should meet the specifications. That makes the task of defining, measuring and managing service quality complicated (Dahlgaard-Park 2015; Gilmore2003). Generally, there are two major aspects concerning
9
the definition of service quality. First, the objective or mechanistic quality aspect which is determined based on the characteristics of the product as an independent objective fact regardless the clients' perspective, and according to this aspect, the quality of the product should meet certain specifications (Holbrook & Corfman1985; Parasuraman et al. 1988; Smart 1995). Second, the subjective, humanistic or perceived quality aspect which is determined based on clients’ subjective judgment and their perception of the quality. Thus, it is a measurement to which extent the level of the provided service satisfies the client's requirement and expectation (Batagan et al. 2009; Cronin & Taylor 1992; Smart 1995; Parasuraman et al. 1988). This thesis is conducted based on the perceived quality perspective in line with this definition: “service quality is a focused evaluation that reflects the customer's perception of specific dimensions of service: reliability, responsiveness, assurance, empathy, tangibles” (Zeithaml & Bitner 2003, p. 85).
2.3. Service quality models
Researchers have suggested and used various models in order to measure the quality of service based on the client perspective (Bearden & Netemeyer 2011; Ismail 2006). Some researchers consider that the quality of service is a measurement based on the clients' perception of the actual service only, others believe it is a measurement based on the clients' expectations only, whereas others claim it is the gap or difference between clients' expectation and the perception they had from the actual service. In general, all the previous perspectives agree that the quality is measured and determined by the customers or the users of the services (Cronin & Taylor 1992; Parasuraman & Zeithaml 2002)
SERVQUAL by Parasuraman et al. (1988, 1991), and SERVPERF by Cronin and Taylor (1992) are the most common models for measuring quality and have been used by a lot of researchers (Dahlgaard-Park 2015; Parasuraman& Zeithaml 2002). Both are multi-dimension models and they assess service quality based on five dimensions or attributes: reliability, assurance, tangibility, empathy, and responsiveness (Cronin & Taylor 1992; Parasuraman et al. 1988, 1991; Reheul et al. 2013). However, according to the SERVQUAL paradigm, the service quality is the variance or the gap between the clients’ expectations and the actual perceived performance of the service. In contrast, SERVPERF model considers the perception of actual performance only to assess and measure the service quality (Cronin and Taylor 1992; Parasuraman et al. 1988, 1991).
10
In order to get a thorough understanding of the chosen model in this thesis SERVPERF model, the study will demonstrate both models because SERVPERF has been structured based on the SERVQUAL model.
2.3.1. SERVQUAL model
SERVQUAL is a common and a widely used model and has been refined through many stages, statistical examinations, and empirical studies. Particularly; SERVQUAL model is the result of comprehensive research conducted in various sectors and industries such as credit cards, retail banking, appliance maintenance, and securities brokerage (Bearden & Netemeyer 2011; Parasuraman & Zeithaml 2002)
It measures the expectation of the clients towards service quality and the clients’ perception of the actual or real performance of quality in order to evaluate the service quality by comparing between the clients’ expectations and perceptions (Gilmore 2003; Wetzels et al. 2000). Hence, according to this paradigm, the service quality is “the discrepancy between consumers’ perception of service offered by a particular firm and their expectations about firms offering such services” (Parasuraman et al. 1988, p. 14).
SERVQUAL is a multiple-item scale depends on two corresponding lists of 22 items which represent the different aspects of the five dimensions of the service quality (Bearden& Netemeyer 2011; Parasuraman et al. 1991). Each item or element was reformulated in two statements, one for measuring the expectations towards the companies within the service sector that are being examined, and the other statements for measuring perceptions about a selected company's service quality. Thus, SERVQUAL uses 44 statements, where a half of them examine the expectations part of the model, and the other half examines the perceived performance (Bearden & Netemeyer 2011; Parasuraman & Zeithaml 2002).
2.3.2. SERVPERF model
Researchers have criticized the expectations section of SERVQUAL model and argued that there is no need to use expectation and perception sections together because that makes the process complicated, and confusing (Cronin & Taylor 1992; Reheul et al. 2013). Where some researchers refer to the variance between the two sections as confirmation or satisfaction, and most of the clients usually use only one of them in the assessment process. Also, they have argued that some studies show that the clients’ expectations become less
11
over time, in turn, that will reflect as an increase in the quality, even though it is not an actual or real improvement in quality (Cronin & Taylor 1992; Dahlgaard-Park 2015). Furthermore, Parasuraman et al. (1991) have amended the items that measure expectations part, because they have noticed that the respondents’ expectations were unrealistic and normative.
Therefore, SERVPERF has been suggested as a model relies only on perceived service performance section to assess the quality (Dahlgaard-Park 2015; Jain & Gupta 2004). This implies that it takes into account the overall assessment of perceived quality rather than relying on variance (Cronin & Taylor 1992; Jain & Gupta 2004). In addition, it is a multi-sector scale and many researchers have recommended it (Reheul et al. 2013), and used it in different sectors such as Saxby et al. (2004) and Reheul et al. (2013) in the accounting industry and Jasinskas et al. (2016) in the hotels' sector. Hence, that enhances its capability as a common scale in different industries.
Additionally, it is worth to mention, that using a long questionnaire may affect negatively the response rate (Gray 2017). As a result, this study will utilize SERVPREF model, which is a performance-based measure consists of 22 statements rather than 44 spread into five dimensions to measure the perceived quality of services provided by accounting firms(see appendix) (Bearden & Netemeyer 2011; Jain & Gupta 2004).
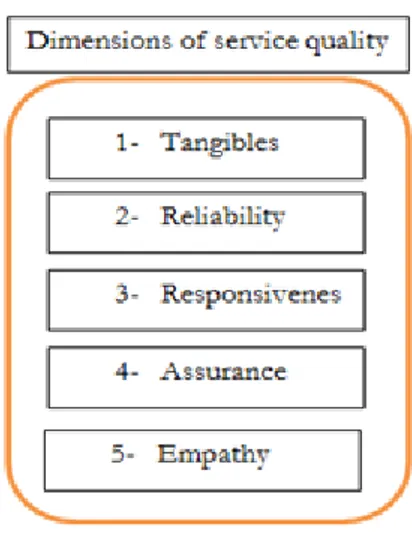
2.3.3. The dimensions of service quality
According to SERVQUAL and SERVPERF the dimensions of service quality shown in figure 1, are tangibles, reliability, responsiveness, assurance, empathy (Parasuraman et al. 1991). First, the tangible dimension includes four items for assessing and rating the tangible features such as updating equipment, attractiveness of physical facilities, and the appearance of personnel. The second dimension is reliability which includes five items for assessing the reliability features such as achievement the promised service on time, expressing sympathy, working according to the timetable, and having accurate records (Bearden & Netemeyer 2011; Jain & Gupta 2004; Parasuraman et al. 1991). The third one is responsiveness which comprises four items for measuring the response features and the willingness to assist clients and offer prompt service. The fourth dimension is assurance which includes four items to evaluate the knowledge, competence, and politeness of the staff and their ability to spread trust and confidence. The last one is empathy which comprises of five items which evaluate the individual attention and caring
12
towards clients and their needs (Bearden& Netemeyer 2011; Jain& Gupta 2004; Parasuraman et al. 1991).
Figure 1: Conceptual model of quality according to SEVQUAL & SERPERF The source: The model has been established based on (Parasuraman et al. 1991)
2.4. Customer loyalty
Customer loyalty is the core factor that helps to develop a sustainable competitive advantage in business service (Gremler & Brown 1996; Wetzels et al. 2000), and it has an increasingly important role in the highly competitive markets (Richard & Zhang 2012). Generally, researchers agree that loyalty is a complex construction (Ismail et al. 2006). Oliver defines loyalty as “a deeply held commitment to re-buy or re-patronize a preferred product or service consistently in the future, thereby causing repetitive same brand or same brand set purchasing, despite situational influences and marketing efforts having the potential to cause switching behavior” (Oliver 1999, p. 34). Further, loyalty has two aspects or components. First, the attitudinal loyalty expresses the emotional relationship between customers and company. Second, behavioral loyalty reflects the actual action of repurchasing frequently from the same company over time (Bandyopadhyay & Martel 2007; Richard & Zhang 2012; Oliver 1991; Prus & Brandt 1995). In addition, based on reasoned action theory, the attitudinal loyalty precedes and stimulates behavioral loyalty. Therefore, many researchers have focused on the attitudinal side of loyalty (Bandyopadhyay & Martel 2007; Davari & Strutton 2014; Richard & Zhang 2012; Oliver 1991).
13
Further, the loyal customers are very valuable. They commit to deal repeatedly and frequently with the company, they recommend the company and its products to others, they have the willingness to purchase other services from the same firm, and they have a strong and long relationship with the supplier over time (GAO 2003; Prus & Brandt 1995; Smith 2011; Speer 1996; Wetzels et al. 2000). Consequently, the loyalty leads to a sustainable and long-term relationship between the company and their clients and improves company's financial performance. Therefore, it is very important to enhance the factors that increase loyalty among customers (Mohd-Sanusi et al. 2012; Prus & Brandt 1995; Wetzels et al. 2000).
According to prior studies, service quality is considered one of the factors that have an impact on customer loyalty directly or indirectly (Bloemer et al. 1999; Carrillat et al. 2009; Dahlgaard-Park 2015; Jasinskas et al. 2016; Kranias & Bourlessa 2013; Mohd-Sanusi et al. 2012; Yildiz 2017). Consequently, enhancing service quality may lead to enhance customer loyalty. This thesis will test the positive direct impact of service quality on the customer loyalty. Further, in order to evaluate customer loyalty, the thesis uses an evaluated scale (see appendix). That has been applied in a prior study by Ismail et al. (2006). This scale based on four key elements: talking positively about the accounting firms, the willingness to deal with the company in the future, inducing others to buy the services provided by the accounting firm and the ability of the accounting firm to offer the best services (Ismail et al. 2006; Zeithaml et al. 1996).
2.5. Customer satisfaction
Customer satisfaction is a key factor in achieving corporate goals (Anderson & Fornell 2000; Gilmore 2003). It is an important indicator of the company's financial future. That customer satisfaction leads to constant and growing sales and profits, as well attract new customers. Therefore companies regard customer satisfaction as a paramount element of survival and continuity (Anderson & Fornell 2000; Ruth 2015).
Further, according to many researchers, quality of service is considered as a precedent factor for client satisfaction and may affect it positively. That implies the satisfaction of clients will increase by improving the quality of service (Dahlgaard-Park 2015; GAO 2003; Gilmore 2003). Also, the service quality and customer satisfaction are different and distinctive structures (Parasuraman et al. 1988; Cronin & Taylor 1992; Oliver 1980). According to
14
Zeithaml & Bitner service quality is “a focused evaluation that reflects the customer's perception of specific dimensions of service: reliability, responsiveness, assurance, empathy, tangibles.”, whereas, “satisfaction, on another hand, is more inclusive: it is influenced by perceptions of service quality, product quality, and price as well as situational factors and personal factors” (2003, p. 85). Likewise, Customer satisfaction and customer loyalty are considered distinctive concepts (Oliver 1999; Prus and Brandt 1995; Story & Hess 2006). It is not necessary that the satisfied customer will be a loyal customer (Oliver 1999; Prus and Brandt 1995; Story & Hess 2006). This means that the satisfied current customers may not deal with the company in the future, where some of them remain loyal while others do not (Oliver 1999; Prus and Brandt 1995; Story & Hess 2006). Accordingly, quality of service, client satisfaction, and client loyalty are distinctive concepts (Dahlgaard-Park 2015; Ismail 2006). Practically, the study utilizes an indicator that has been used in a prior study to assess the overall client satisfaction to accounting firms by Ismail et al. (2006).
2.6. Previous studies and hypotheses formulation
This section sheds light on previous studies. As well, the research displays two hypotheses groups. The first hypotheses group regarding the impact of service quality and its dimensions on customer satisfaction. The second hypotheses group concerning the impact of service quality and its dimensions on customer loyalty.
2.6.1 Previous studies
Generally, in order to detect the complex setup of service marketing, researchers have studied the various factors and their direct and indirect relationships such as service quality, confirmation, customer satisfaction, trust, commitment, purchase intention, word of mouth, customer loyalty, etc., with the purpose of enabling service managers to utilize control, and manage these variables and their relationships better (Chumpitaz Caceres & Paparoidamis 2007; Hidayat et al. 2015; Smith 2011; Wetzels et al. 2000; Yildiz 2017).
More specifically, the request for high-quality accounting services has constantly increased to meet changes and challenges and to achieve success in today’s business environment (Cory & Huttenhoff 2011; Kranias & Bourlessa 2013; Zaman Groff & Štumberger 2015). Along with this, the relationship between service quality and client loyalty and/or satisfaction has attracted the
15
attention of many researchers and practitioners (Lewis 1989; Reheul et al. 2013).
According to prior studies, improving service quality may have a direct or indirect influence on client satisfaction and client loyalty (Carrillat et al. 2009; Kranias & Bourlessa 2013; Wetzels et al. 2000). Concerning the indirect relationship, many researchers have studied the role of customer satisfaction as one of the mediators in the relationship between service quality and client loyalty such as Ismail et al. (2006) and Caruana (2002). In contrast, other researchers have studied the direct relationship between the concepts service quality- client loyalty such as Bloemer et al. (1999), Cronin & Taylor (1992) Jasinskas et al. (2016), and Kranias & Bourlessa (2013), as well as service quality- client satisfaction such as Saxby et al. (2004) and Aga & Safakli (2007). In addition, those studies have been conducted in various fields and industries (Gilmore 2003), for instance, in hotels sector Jasinskas et al. (2016), banking sector Arokiasamy (2013) and Caruana( 2002), cargo companies Yildiz (2017), sharing economy Priporas et al. (2017) and in accounting industry Ismail et al. (2006) and Reheul et al. (2013). Also, the studies have got different results regarding the significance of the relationship between service quality and other concepts in different research fields and countries. However, in general, the overall result is positive. Further, the researchers emphasize the need to examine the influence of quality on the client satisfaction and loyalty in various industries and over the years to identify changes and direction (Dahlgaard-Park 2015; Gilmore 2003; Parasuraman & Zeithaml 2002).
2.6.2. Formulation of hypotheses
In line with what has been mentioned above. This research depending on the accountancy and service marketing literature seeks to evaluate the perceived quality dimensions of all services provided by accounting firms based on their clients’ perceptions at Nasdaq Stockholm. Besides, it seeks to examine the direct impact of quality and its dimensions on the customer satisfaction and customer loyalty separately.
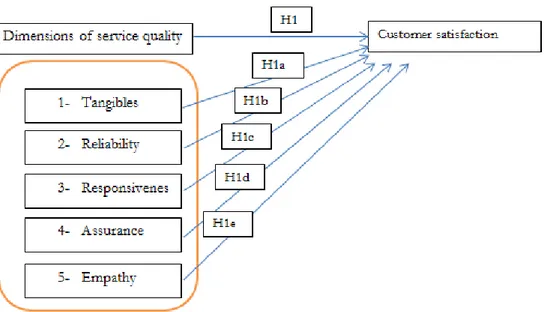
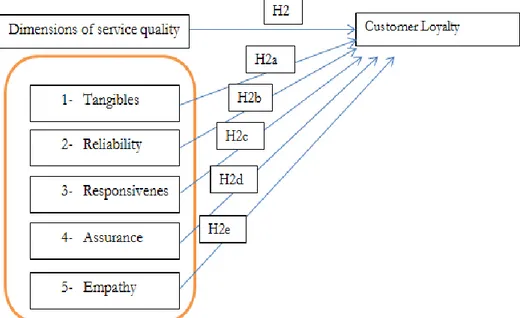
As stated by Gray (2017), it is essential to set hypotheses in quantitative studies to examine the relationship between variables. Therefore, this research tests two hypotheses groups. The first hypotheses group regarding the impact of service quality and its dimensions on customer satisfaction, figure2. The second hypotheses group concerning the impact of service quality and its dimensions on customer loyalty, figure 3.
16
First hypotheses group:
Service quality and customer satisfaction:
H1: The service quality of accounting firms positively affects the satisfaction of their clients at Nasdaq Stockholm OMX.
Also, in order to examine the direct relation between the quality’s dimensions and customer satisfaction these sub-hypotheses will be examined:
- H1a: The tangible dimension of accounting firms’ service quality positively affects the satisfaction of the clients.
- H1b: The reliability dimension of accounting firms’ service quality positively affects the satisfaction of the clients.
- H1c: The responsiveness dimension of accounting firms’ service quality positively affects the satisfaction of the clients.
- H1d: The assurance dimension of accounting firms’ service quality positively affects the satisfaction of the clients.
- H1e: The empathy dimension of accounting firms’ service quality positively affects the satisfaction of the clients.
Figure 2: Conceptual model of service quality and customer satisfaction The source: The model has been established based on (Aga & Safakli 2007) and (Dahlgaard-Park
17
Second hypotheses group:
Service quality and customer loyalty:
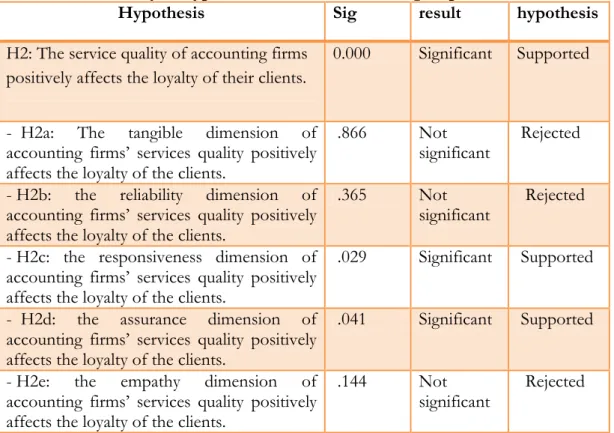
H2: the service quality of accounting firms positively affects the loyalty of their clients at Nasdaq Stockholm OMX.
Similarly, in order to examine the direct relation between the quality’s dimensions and customer loyalty these hypotheses will be examined:
- H2a: The tangible dimension of accounting firms’ services quality positively affects the loyalty of the clients.
- H2b: the reliability dimension of accounting firms’ services quality positively affects the loyalty of the clients.
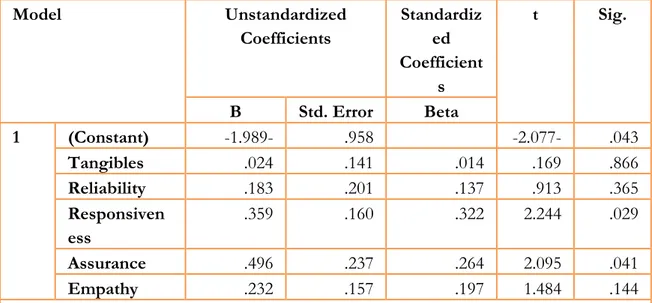
- H2c: the responsiveness dimension of accounting firms’ services quality positively affects the loyalty of the clients.
- H2d: the assurance dimension of accounting firms’ services quality positively affects the loyalty of the clients.
- H2e: the empathy dimension of accounting firms’ services quality positively affects the loyalty of the clients.
Figure 3: Conceptual model of service quality and customer loyalty The source: The model has been established based on (Bloemer et al. 1999) and (Dahlgaard-Park
18
3. Methodology
This chapter presents the research method and approach that have been used, as well as describes other elements of the research design as the operational definition, collection methods, population and sampling and lastly the research quality and ethical considerations. Further, the research will compute the results by using SPSS program.
3.1. Research approach
According to Gray (2017), the chosen research approach should be appropriate to attain the study’s aim. Thus, based on the aim of the study, the researcher can adopt a deductive or inductive approach. If the aim of the study is to examine and explain the relationship between concepts in order to test existent theories or hypotheses then the deductive approach will be appropriate. In contrast, if the aim of the research is to construct and generate a new theory, then inductive approach will be appropriate. Accordingly, in the deductive approach, the theoretical perspective will be determined before conducting the study. In contrast, in the inductive approach, the research may begin with gathering and analyze data, and then the theory will be created based on the data after undertaking the study (Bryman & Bell 2015; Gray 2017; Saunders et al. 2011).
This research seeks to test existent hypotheses or theories concerning the relationship between different concepts or variables. Therefore the deductive approach will be the most suitable approach. Generally, the process of deductive approach follows many steps. Firstly, the researcher has to determine the theories and underlying concepts that are most suitable to the aim of the study and the testing hypothesis. Then, in order to observe the underlying concepts and control them, the study has to operationalize them or make them measurable by creating the indicators or variables that measure them. Lastly, testing the hypothesis through comparing the empirical or collecting data with the theory in order to confirm or reject the hypothesis (Gray 2017; Saunders et al. 2011).
Furthermore, this study is classified as an explanatory study according to its purpose. That, it has been conducted in order to explain the relationship and its direction between variables (Collis & Hussey 2013; Gray 2017), quality of service as an independent variable in one hand, and customer satisfaction and loyalty as dependent variables on the other hand. Consequently, this research will adopt a deductive approach with explanatory purpose.
19
3.2. Research Method
One of the most important points in the business research design is selecting the method of the study, whether it will be a quantitative, qualitative or mixed study because that will affect the choice of data collecting and analysis methods (Bryman & Bell 2015; Gray 2017).
The quantitative and qualitative methods have many different aspects in approaching the research process. First, concerning the focus of the research, commonly the quantitative research seeks deductively to test and verify an existent theory, through exploring the relationship between the concepts that form the theory in order to support or reject it. In contrast, the qualitative research seeks inductively to construct a theory based on the collecting data of the study. Second, with regard to researcher engagement in the study, typically in the quantitative study, there is a space between the researcher and the researched subject settings, where the tools used to collect data does not require an intensive direct contact with the participants and the field under researching. While the qualitative research, generally, requires a deep direct involvement with the respondents and the studying field in order to gain a deep understanding of the subject. Third, with regard to the scope of findings and the nature of data, the quantitative study collects and analyzes numerical data that measures the concepts of the theory and seeks to generalize the findings. Whereas in the qualitative research the type of data is more various, however, it uses and handles generally textual data in view to get an in-depth insight of the researched subject (Bryman & Bell 2015; Gray 2017; Saunders et al. 2011).
In general, quantitative research aims to quantify the concepts that form the current theory and examine the relationship between them in order to confirm the suggested hypothesis or refuse it with the aim of generalizing the findings. In contrast, the qualitative research aims to gain an in-depth insight of specific case through collecting almost textual data to establish a theory based on the collecting data (Bryman & Bell 2015; Gray 2017). Consequently, this research aims to examine and explain the relationship between the services quality provided by accounting firms on one hand, and the clients’ satisfaction and loyalty on the other hand. In other words, the thesis examines the influence and the relationship between numeral variables. As a result, the study adopts a quantitative method to achieve that.
20
3.3. Data Source
There are two types of data according to their source, primary data, and secondary data. The classification of data depends on the relationship between the data and the researcher. If the data has been gathered specifically for attaining the purpose of the research project by the researchers who undertake the study then the data type will be considered primary. In contrast, if the data has been gathered by external or other researchers who do not share in the research then the data type is considered secondary. In other words, the secondary data is an existed and available data that has been produced by external researchers (Collis & Hussey 2013; Easterby-Smith et al. 2012; Gray 2017). With regard to the secondary data, the study has used peer-reviewed, scientific relevant literature, journals and articles to construct and support the theoretical framework of the research project. As well, to obtain primary data, the study has to adopt one or more of data gathering methods such as questionnaires, focus groups, or semi-structured interviews to gather the data related to the variables or concepts of the research project (Collis & Hussey 2013; Easterby-Smith et al. 2012; Gray 2017).
3.4. Operationalization and measurement
The researcher has to operationalize the hypothesis before choosing the research instrument (Bryman & Bell 2015; Gray 2017). According to Gray (2017, p. 144), the operationalization or the operational definition is “A concise statement that assigns meaning to a constructor variable by specifying the activities necessary to measure it”. Therefore, it is essential to determine the main variables that express the hypothesis in operational terms. The operational definition shows what should be measured. Simply put, determination the key variables that will be measured to examine the hypothesis (Atkinson 2012; Gray 2017; Saunders et al. 2011).
Accordingly, the study will make use of three key variables to test the hypotheses. These variables are quality of service as an independent variable in one hand, and customer satisfaction and loyalty as dependent variables on the other hand. As well the study will use five sub-variables to measure quality’s dimensions (see appendix). Besides, the researcher will utilize a seven-point Likert scale to measure these variables.
21
3.5. Pretesting
The researchers emphasize the importance of implementing a pre-test or a pilot test before conducting the actual survey to ensure that the items are understood and eliminate errors in order to enhance reliability and validity at this stage (Atkinson 2012; Lavrakas 2008). In addition, pre-testing provides the study with suggestions for improving the questionnaire, redrafting unclear questions, deleting similarly asked questions, and determining the actual response time of the survey (Atkinson 2012; Lavrakas 2008). Consequently, before administrating the actual survey, the survey has been revised and discussed with professor supervisor, other professors and colleagues. Finally, the survey has been pretested by sending the survey to a limited number of the respondents (15) in order to get any suggestions and improve it.
3.6. Data collection methods
Collecting data is the main stage of the research process. Nothing can be succeeded without using a reliable and valid data gathering tool. Generally, there are many techniques to collect data like questionnaire, observation, and interview. The chosen data collecting instrument has to fit for the aim of the study (Bryman & Bell 2015; Collis & Hussey 2013; Gray 2017).
For instance, if the research seeks to gain deep insight or the opinions of a limited group of participants, an interview schedule will be appropriate for this case. While, in the case of evaluating and measuring variables and exam the relationships between them, and using standardized questions with large number relatively of participants the survey questionnaire will be the most proper instrument to collect data (Gray 2017; Saunders et al. 2011).
Additionally, the adopted research methodology, whether quantitative or qualitative, plays a significant role in choosing the suitable tools for collecting data. Generally, a survey questionnaire is the most used and suitable tool for quantitative researchers. Also, the available time and budget should be taken into consideration (Bryman & Bell 2015; Gray 2017).
Based on the above, this study will utilize the survey questionnaire as a tool to collect data due to many reasons. First, this study has already adopted a quantitative approach with an explanatory purpose in order to verify the relationship between many variables. Second, the cost in the case of the questionnaire is less relatively comparing with other tools with respect to respondents’ number. Therefore, the survey questionnaire will be the best
22
instrument to gather the required data at reasonable cost and time (Brill 2008; Bryman & Bell 2015; Gray 2017).
Survey Questionnaire:
As mentioned previously, the study will use the questionnaire as a tool to collect the empirical data. The questionnaire is considered one of the most popular techniques to collect primary data in quantitative researchers, where the respondents are asked to answer a collection of the same predefined questions (Atkinson 2012; Bryman & Bell 2015; Lavrakas 2008).
Using a valid and reliable data gathering tool is substantial to achieve successful research. Consistent with this, the study makes use of existed validated constructed scales (Atkinson 2012; Gray 2017; Saunders et al. 2011), the SERVPERF model, which is a validated questionnaire to evaluate the perceived quality by clients. Besides, the study will use a validated model consists of indicators adapted from Ndubisi (2003) and Zeithaml et al.(1996) and have been used by Ismail et al. (2006) to assess customer satisfaction and customer loyalty in audit firms(Ismail et al. 2006).Essentially, it is better to utilize validated existing scales than developing own scales because these scales commonly have been used by many researchers, and have been evolved by expert and specialized researchers who have verified the validity and the reliability of them(Gray 2017; Saunders et al. 2011).
In addition, concerning the type of questionnaire, the questionnaires could be paper-based questionnaire sent by post, or online or web-based questionnaire which is considered an increasingly common method of undertaking surveys, and powerful instrument especially in the case of large number of participants (Gray 2017; Wolf 2008). Practically, the study will make use of Google form to design and distribute online questionnaire. Consequently, as a measurement instrument, the research will use an online questionnaire comprises of closed rating questions with an ordinal Likert scale of seven points.
3.7. Population and Sampling
The targeted population in this thesis is the 582 Swedish listed companies at Nasdaq Stockholm OMX, while the sample is 58 companies.
3.7.1. Identification the research’s population
The population is “a precisely defined body of people or objects under consideration for statistical purposes” (Collis & Hussey 2013, p 62). This study
23
seeks to evaluate the quality of services provided by accounting firms and its influence on the client’s satisfaction and loyalty. According to Gray (2017), the study has to target the right participants. In addition, the clients or the beneficiary are the best who can evaluate the quality of service (Batagan et al. 2009; Bean et al. 1996; Wetzels et al. 2000). Therefore, the 582 listed companies at Nasdaq Stockholm OMX , in their capacity as clients of accounting firms, have been chosen as the targeted population in order to test the existent theories with respect to these three elements: common location (Sweden), kind of service (all services provided by the accounting firms), and time of the study (2018).
Concerning the information of the listed companies at Stockholm Stock Exchange, the study has utilized Amadeus1 database as a secondary data
source, it provides overall information on the companies in Europe for academic and educational purposes. Consequently, according to Amadeus database, the population of this study is 582 companies. Furthermore, the respondents have to be knowledgeable and able to answer the questions (Bryman & Bill 2015; Lavrakas 2008). Therefore, the respondents will be the employees who are in charge of dealing and engaging with auditing firms such as the head or the employees in auditing and control, accounting, or finance department.
3.7.2. Sampling
The careful sampling process of participants is one of the essential components of any research project. It is the process of selecting a sample from a population, where the population is all potential elements that are included in the research, while the sample is the set of elements has been chosen from the population by the researcher for conducting the study (Easterby-Smith et al. 2012; Gray 2017; Guthrie 2010). The sampling process is conducted due to different reasons like the large size of the population, the limited resources available for undertaking the study with respect to the time and cost. In order to have a representative sample the sample size and the random selection play a key role. Firstly, the large size of the sample leads to increased quality and the representativeness of the sample (Easterby-Smith et al. 2012; Gray 2017; Guthrie 2010). Secondly, by applying the random probability sampling process each unit in the population takes the same opportunity to be in the chosen sample. Having representative sample is
24
crucial in generalizing the outcomes of the study to the parent population (Bryman & Bill 2015; Gray 2017).
3.7.3. Selecting the sample size
Many ways have been proposed to select the minimum size of the research sample (Green 1991; Gray 2017). First, in general, the sample size should be greater than 40 based on a statistical perspective (Byrne 2017). Further, according to Easterby-Smith et al. (2012), 10% of the population is acceptable, so the sample size in this study should range from 50 to 60. However, the researcher has decided first to send the survey to 150, but because the response rate was not enough the survey has been sent to 450 participants and reminders have been sent also, in order to increase response rate and ensure the statistical minimum of the answers which is 40, and reach to acceptable size 50-60 (Byrne 2017; Easterby-Smith et al. 2012).
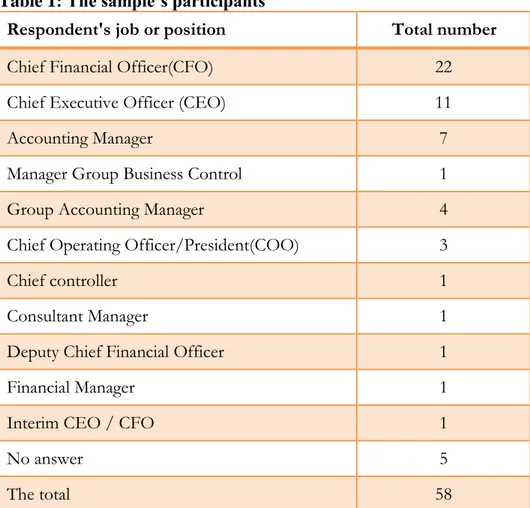
As a result, 58 companies have responded, and most of the respondents are managers in auditing and control, accounting, or finance department, which increase the quality of responses.
However, the response rate has been affected by various factors. Generally, there have been many holidays during this time of year. Some participants also sent e-mails apologizing for being unable to respond because they have many duties and little time currently, and some of them actually help other students in their theses. In addition, others do not want to share their own data.
3.7.4. The process of random selection
The random sample is a sample where its elements have been chosen randomly from the population, where each of them has the same probability to be in the selecting sample (Bryman & Bill 2015; Guthrie 2010). In order to get a random sample or to select the members of the sample randomly, the researcher can use statistical tables or a special program like Randomizer program2 which has been used by this study (Gray 2017). Where, the
Randomizer program provides a list of the members that will form and construct the random sample, after filling the setting of the population and sample (Gray 2017).
25
3.8. Data analysis
The analytical approach should be selected at the designing stage of the study, and it should be appropriate for the type of the collected data. Hence, the initial step is selecting the type of data whether nominal, ordinal, interval or ratio because it will affect the type of statistical tests and the analytical approach (Gray 2017; Guthrie 2010). Accordingly, based on the purpose of the scale, the study’s data type has been classified as an ordinal data, which is the most suitable for the questions that rate the degree of agreement, quality, or views, according to Gray (2017). Hence, it is compatible with the general logic of the research project and the research instrument (Gray 2017).
3.8.1 Descriptive statistics
Descriptive statistics are used to describe and analyze the data from a particular sample based on the frequency distribution method. The frequency distribution method measures and provides statistical information about the central tendency of the data and its dispersion such as the mean which measures the average of responses, and the standard deviation which measures the degree of responses’ spread around the average (Bryman & Bell 2015; Gray 2017; Guthrie 2010).
The study will calculate the mean and standard deviation in order to determine the situation of the five dimensions in the Swedish accounting firms according to the participants, as well the customer satisfaction and loyalty. Further, the study will use frequency table to calculate the cumulative percentage to the responses which have low evaluation or less than 5 points.
3.8.2. Correlation analysis
Correlation analysis is used to describe and examine the relations between variables. Generally, the strength of the association is determined according to the value of the correlation coefficient. Also, the direction of this relationship positive or negative is determined according to the sign of the correlation coefficient (Gray 2017; Saunders et al. 2011). The value of correlation coefficient (r) moves in the range between (+1, 0, -1) where +1 means there is a perfect positive relationship; zero means there is no relationship, lastly -1 means there is a strong negative relationship(Gray 2017; Saunders et al. 2011). Regardless the sign of the correlation coefficient, if its value is between (0.01 - 0, 29) the relation is small; if it is between (030- 0, 49) the relation is medium; if it is between (0, 50- 1.00) the relation is large (Gray 2017).
26
The study will calculate the Pearson Correlation which is “A statistical formula for calculating the correlation coefficient between two variables” (Gray 2017, p. 642), in order to assess the relationships between the independent variables or service quality dimensions with the aim of verifying the construct validity (Bryman & Bell 2015).
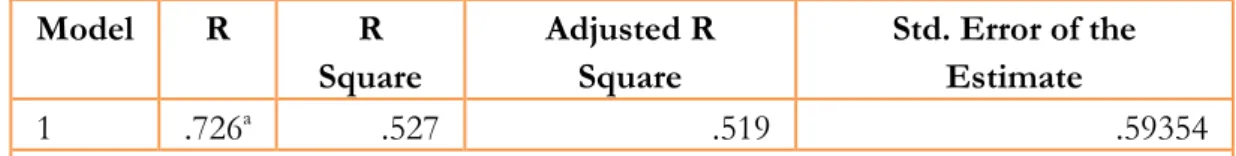
3.8.3 Regression analysis
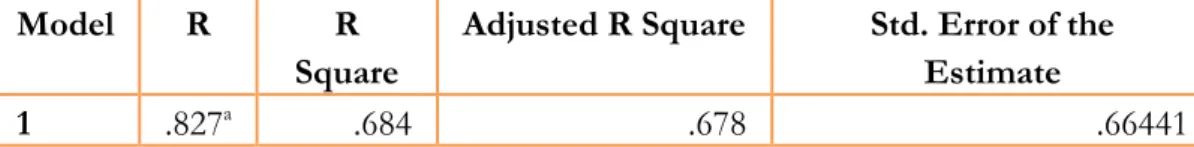
The essential objective of regression analysis is to examine and predict the influence of an independent variable on another dependent variable, as well as to select the trend of the relationship. In other words, it helps in assessing and measuring the statistical significance of the relationship between independent and dependent variables (Gray 2017; Saunders et al. 2011). There are many techniques related to regression analysis. For instance, simple linear regression when there is only one independent variable, whereas if there are many independent variables then the regression will be multiple regressions regardless the number of the dependent variables. The value of regression coefficient R2 takes a value between zero and one, when its value close to 0 that means the independent variable has not a statistical significance impact on the dependent variable, and when its value close to one the value of R Square shows how much of the variance in the dependent variables could be interpreted by the independent variable (Gray 2017; Saunders et al. 2011). The thesis will conduct regressions analysis to determine the impact of service quality and its dimensions as independent variables on the customer satisfaction and loyalty as dependent variables.
3.9. Research quality
Validity and reliability are key factors in determining the data quality of the research study (Bryman & Bell 2015; Saunders et al. 2011). Where the validity” is concerned with whether the findings are really about what they appear to be about.”(Saunders et al. 2011, p. 157), and reliability is “The degree to which an instrument will produce similar results at a different period” (Gray 2017, p. 780). Therefore in order to enhance the quality of the project the researcher has to verify and assure validity and reliability (Bryman & Bill 2015; Saunders et al. 2011).
27 3.9.1 Validity
Primarily, in order to assure the validity of the questionnaire as a research tool, the questions have to measure the entire content of the concepts that have been operationalized accurately, no more or less (Atkinson 2012). In other words, the researchers have to verify construct validity “refers to the extent to which your measurement questions actually measure the presence of those constructs you intended them to measure” (Saunders et al. 2011, p. 373). Consequently, the degree of the measurement instrument’s validity depends on the extent of matching between the research instrument and the specific operational areas of study (Atkinson 2012; Gray 2017; Saunders et al. 2011). According to Bryman & Bell (2015), the researchers can rely on examining the relationships between independent variables as an approach to assure the construct validity. Accordingly, the thesis will base on correlation analysis to verify construct validity.
Further, relating to the internal validity “The extent to which changes in the dependent variable can be attributed to the independent variable, rather than to an extraneous variable” (Gray 2017, p.147). Randomization or random sampling leads to assure internal validity where the random allocation prevents bias. For that reason, the study has used a special program so called Randomizer to ensure random sampling process (Bryman & Bill 2015; Gray 2017). In contrast, with regard to external validity, having irrelevant and spurious questions makes the questionnaire longer, and that leads to decrease the rate of responses, in turn, it may restrict the generalization of the outcomes and the external validity, where the external validity is “The extent to which research results can be generalized to the population as a whole” (Gray 2017, p. 775). Also, using common scales have been used by other researchers will support and demonstrate the feasibility of the outcomes, which assures the external validity (Gray 2017; Saunders et al. 2011).
In addition, issue related to the arrangement of the questionnaire, and forming of questions could affect validity. Therefore, in order to increase the validity, as well as to ensure that the structure of questionnaire is well-arranged, and the wording of questions is clear, the questionnaire has been discussed with the supervisor, and has been first sent to a limited number of participants with aim of getting notes to remove any ambiguity and help the participants to understand the questions and answer correctly (Easterby-Smith et al. 2012; Gray 2017; Trobia 2008).