DETECTION OF GLASS IN RDF USING
NIR SPECTROSCOPY
A step toward a more complete mapping of boiler operation and performance
in a CHP plant using refuse derived fuel.
PHILIP HEDLUND
ABSTRACT
Purpose of this study was to investigate the possibilities of using Near-infrared (NIR)
spectroscopy to detect glass in refuse derived fuel (RDF) as well as what on-line data of glass content could be used for in terms of boiler operation and performance determination. Sample configurations were done with dried RDF (to prevent mass loss due to moisture and spectroscopic disturbance) and increasing concentrations of colored soda-lime glass, total of 100 samples. Glass was randomly scattered among the RDF by shaking the added glass and RDF in a bucket to generate representative samples of real life conditions. NIR-spectra acquisition was done between 12000 and 4000 cm-1, at 8 cm-1 resolution and average of 32 scans. The determination of boiler performance was done in accordance to Swedish
standards for acceptance testing and heat loss due to glass was treated as slag. Resulting performance calculations showed boiler efficiency via indirect method matching efficiency calculated via direct method (deviating at maximum 2 %) which validates the summarized losses (including due to glass). The heat loss due to glass was calculated to 0,068 MW/%glass, which equated to average of 0,16 MW for 2,37 % glass. Total heat loss was amounted to an average of 11,53 MW. The developed models were not satisfactory in their quality of regression prediction. Although some had, through pre-processing, good development of explained variance at increasing factors, but still had a “Not Applicable” coefficient of
determination by regression prediction. The poor quality of models can be explained by poor glass detection (poor representation) of the spectroscopic instrument due to a combination of glass being randomly scattered in the background material and sometimes covered by RDF as well as that the NIR-spectroscopy light beam only hits a small area. By increasing the number of samples upwards 300 -500, the effect of random scatter of glass can be mitigated and acceptable models could be acquired.
PREFACE
This study was commissioned by Mälarenergi AB as a part of the ongoing FUDIPO project (FUture DIrections for Process industry Optimization) and as a joint venture between Mälarenergi AB and Mälardalen’s University (MDH). I would like to start by thanking both Mälarenergi and Mälardalen’s University for giving me this opportunity.
There are several people whom I would like to thank for making this degree project such a great experience.
First of all, I would like to thank my external supervisor at Mälarenergi AB, Elena Tomás-Aparicio, also for her continued support throughout the project with for example data acquisition and discussions.
I would also like to thank my supervisor at MDH, Dr. Jan Skvaril for his amazing support, knowledge and insightful discussions.
Furthermore, I would like to thank my examiner Dr. Ioanna Aslanidou, for her insight and support.
I also wish to thank Joakim Jansson for his technical support and help with supplying me with needed equipment.
Lastly, I would like to thank my family for their support during not only this degree project, but also throughout my whole academic life.
Västerås, June 2018 Philip Hedlund
SUMMARY
According to the fourth step of EU’s hierarchy of waste management, waste should be processed (refuse derived fuel – RDF) and incinerated for energy recycling. However, since waste fuel is composed disposed waste from households and industries, there is risk of smaller fractions of incombustibles such as glass remaining in the RDF when fed into the boiler for incineration. These unwanted particles can cause major issues for boiler operation such as slagging, agglomeration – which can lead to defluidization of the circulating bed, and in extreme cases, boiler shutdown. However, if knowledge of how much glass is being fed alongside the fuel, preventive measures can be taken during boiler operation.
This study regards the above-mentioned issue and aims to investigate the possibility of detecting glass content in RDF by using NIR-spectroscopy and what this theoretical
continuous glass content data would mean in terms of determining boiler performance and operation.
The employed method in this study includes NIR-spectroscopy for spectra acquisition between 12 000 and 4 000 cm-1 at 8 cm-1 resolution with an average of 32 scans. Several different pre-processing techniques combined with PLS-r is investigated. 100 samples with four replicates each were measured, and samples were prepared by shaking RDF and glass together in a bucket to ensure representative sample of real conditions. For determination of boiler performance, calculations according to Swedish standards are used and soda-lime glass melt is considered as slag. Hourly logged boiler operation data was acquired from Mälarenergi and is used as input for the calculations.
Resulting models developed showed very poor correlation, i.e. the resulting R2 were not applicable (NA). These poor resulting models can be summarized to the glass not being detectable by the instrument due to the glass traveling to the bottom and being covered by RDF. However, it is believed that increasing the sample number upwards 300 should mitigate the uncertainty brought on by the random scattering of glass.
The resulting calculated efficiencies by both direct and indirect method showed very good relation, deviating at maximum of 3 percent at few instances but otherwise averaging close to 1 percent. The efficiencies of the boiler ranges at maximum 0,93 and minimum 0,88
throughout the measurement period. The calculated total loss was 11,53 MW of which glass (2,4 % of RDF massflow) represented0,16 MW if the glass reaches same temperature as bed, and 0,11 MW if it only reaches 75 % of said temperature. The cost due to glass heat loss, calculated as lost revenue from sold generated electricity amounted to 1 400 SEK/day at set glass concentration. However, this value is not representative daily for the entire year since both electricity price and boiler load fluctuates throughout the year.
Beyond the fact that glass causes heat loss during operation which can be calculated continuously with on-line detection, further tasks can be achieved with this data. With knowledge of how much glass is fed into the boiler, appropriate boiler parameters can be set, such as fluidization velocity and/or temperature to prevent agglomeration and in turn boiler issues and shutdown. In so doing, potentially saving several millions of SEK in production costs dependent on season.
SAMMANFATTNING
Enligt det fjärde steget i EU:s avfallstrappa ska avfall beredas (refuse derived fuel – RDF) och förbrännas för energiåtervinning. På grund av avfallets härkomst (från hushåll eller industri) kan det förekomma halter av obrännbart material som, trots sortering, kan följa med bränslet in i pannan i mindre fraktioner. Dessa oönskade fraktioner kan skapa allvarliga problem för pannan under drift som slagg och agglomeration. Agglomeration kan leda till de-fluidisering av den cirkulerande pannbädden, och i extrema fall, tripp av panna. Ifall tillgänglig data kring hur mycket av dessa fraktioner (i denna studie behandlas glas) finns i bränslet som matas in i pannan kan förebyggande åtgärder utföras genom justering av driftparametrar. Denna studie innefattar att undersöka möjligheten att detektera glashalt i RDF via Nära infraröd (NIR)-spektroskopi samt teoretiskt hur data om glashalt kan användas gällandet pannprestanda och -drift.
Metoden i denna studie bestod utav NIR-spektroskopi för erhållande av spektra mellan vågtal 12 000 och 4 000 cm-1 vid 8 cm-1 upplösning och medelvärde av 32 scanningar. Erhållna spektra från totalt 100 unika sampels med olika glashalter som blivit preparerade via att skaka om RDF och glas tillsammans i en behållare för att efterlikna verkliga
förhållanden var sedan bearbetade med olika matematiska metoder som spektrala deriveringar eller spridningskorrigering. Dessa användes därefter för att utveckla
regressionsmodeller enligt PLS-r. Utvärderingen pannans prestanda har gjorts enligt svenska standarder och värmeförlusten på grund av glas hanteras som värmeförluster av slagg. Data för energiberäkningar har erhållits av Mälarenergis egna timvisa loggning driftparametrar. De resulterande modellerna var ej acceptabla. Vid validering via regression gav modellerna ett R2 värde ”Not Applicable (NA)”, ej applicerbart trots att vissa modeller visade någorlunda bra utveckling faktorförklarad varians. Detta dåliga resultat kan förklaras av att strålen från NIR-spektroskopiinstrumentet ej kan ”se” bitarna av glas då vissa av bitarna blir täckta av bakgrundsmaterialet. Men eftersom det är denna slumpmässiga spridning av glaset som ger upphov till det dåliga resultatet är det trott att ökad mängd sampels, uppåt 300–500 ska åtgärda osäkerheten hos modellerna.
De beräknade verkningsgraderna för pannprestanda via indirekta metoden samt direkta metoden visade stark relation med avvikelse på maximal 3 % vid få tillfällen men hade en skillnad närmre 1 % för större delen av de beräknade verkningsgraderna. Verkningsgraderna varierade mellan maximum av 0,93 och minimum 0,88 under den två veckor långa
mätperioden. De totala beräknade förlusterna uppgick till 11,53 MW vilket förlorad värme i glas stod för 0,16 MW med 2,37 % glas i bränslet antaget att glaset når bäddtemperaturen, 0,11 MW ifall det endast når 75% av bäddtemperaturen. Kostnaden relaterat till glasets värmeförlust uppgick till 1400 SEK/dag vid satt glashalt. Men denna kostnad är ej representativ för hela året då både elpriset samt pannlasten fluktuerar under årets gång.
CONTENT
1 INTRODUCTION ... 1 1.1 Background ... 1 1.2 Purpose/Aim ... 2 1.3 Research questions ... 2 1.4 Delimitation ... 3 2 THEORETICAL FRAMEWORK ... 42.1 Refuse Derived Fuel ... 4
2.1.1 Composition and properties ... 4
2.1.2 Waste processing – Creating RDF ... 6
2.2 Combustion technology and CHP ... 7
2.2.1 Circulating fluidized bed boiler ... 9
2.2.2 Heat transfer in CFB ... 11
2.2.3 Bubbling fluidized bed boilers ... 11
2.3 Performance of boiler ... 11
2.4 Challenges with RDF and biomass combustion ... 12
2.4.1 Fouling and slagging ... 12
2.4.2 Corrosion ... 13
2.4.3 Agglomeration ... 14
2.4.4 Countermeasures for potential problems ... 15
2.5 Near Infra-Red (NIR) spectroscopy ... 16
2.5.1 NIR pre-processing techniques - Chemometrics ... 17
2.5.2 Utilization of NIR-spectroscopy ... 18
2.6 Glass and its properties ... 18
2.6.1 Structure and absorption of glass... 19
2.6.2 Specific heat capacity of glass ... 19
3 METHOD ...20
3.1 Method: NIR – Spectra acquisition and model calibration/validation ... 20
3.1.1 Sample preparation and configuration ... 20
3.2.1 System description – Block 6 ... 22
3.2.2 Boiler energy balance and efficiency ... 22
3.2.3 Flue gas losses ... 24
3.2.4 Unburnt combustibles in flue gas ... 25
3.2.5 Unburnt combustibles in fly ash ... 25
3.2.6 Unburnt combustibles in bottom ash/bed ... 25
3.2.7 Radiation and convection losses ... 26
3.3 Data for boiler calculations ... 26
3.4 Method: Determination of losses due to soda-lime glass ... 26
3.4.1 Temperature of removed heated glass melt (slag) ... 27
3.5 Economic and environmental aspects ... 27
3.6 Boiler operation and combustion techniques ... 28
4 RESULTS ...29
4.1 Results - NIR spectroscopy ... 29
4.1.1 Acquired spectra ... 29 4.1.2 Developed models ... 30 PLS-R W. MSC ...30 PLS-R W. SNV...32 PLS-R W. S.G. 1ST DERIVATIVE ...34 PLS-R W. S.G. 2ND DERIVATIVE ...36
4.2 Results – Loss determination/Boiler performance ... 39
4.3 Economic impact of heat loss ... 43
5 DISCUSSION ...45 5.1 Result discussion ... 45 5.1.1 Calibration model ... 45 5.1.2 Energy calculations ... 46 5.1.3 Boiler operation ... 47 5.1.4 Economic impact ... 47 5.2 Method discussion ... 48
5.2.1 Evaluation of NIR-spectroscopy and sampling method ... 48
5.2.2 NIR measurements – complications and solutions... 48
6 CONCLUSIONS ...49
7 SUGGESTIONS FOR FURTHER WORK ...50
APPENDIX 1 SAMPLE CONFIGURATIONS
APPENDIX 2 IF-STATEMENTS MEAN SPECIFIC HEAT CAPACITY SODA-LIME GLASS
LIST OF FIGURES
Figure 1 Composition of MSW and RDF in wt% (Montejo et al., 2011) ... 5
Figure 2 Plastics in MSW and RDF in wt% (Montejo et al., 2011)... 5
Figure 3 MSW composition dependent on origin (Papagiannakis, 2003) ... 6
Figure 4 Higher heating value of fuels ... 6
Figure 5 Waste processing (Mälarenergi AB, 2017) ... 7
Figure 6 Simple steam cycle – 1) Boiler, 2) Turbine, 3) Generator, 4) Condenser, 5) District heating network, 6) Pump ... 8
Figure 7 Simple schematic of CFB boiler ... 8
Figure 8 CFB boiler (boiler 5) (Sandberg, Karlsson, & Fdhila, 2011) -edited by author ... 9
Figure 9 Ubeams (solid particle separator)- original acquired from (Skvaril, 2015) – edited by author ... 10
Figure 10 Cyclone separator (left) (Skvaril, 2015) and loop seal (right) (Wester, 2013a)– figure compiled and edited by author ... 10
Figure 11 Deposit formation on superheater (Sandberg et al., 2011)... 13
Figure 12 Corrosion damage pipe (Khan et al., 2009)- edited by author ...14
Figure 13 Agglomeration process example ... 15
Figure 14 Spectra of solid biomass and absorption bands (Skvaril et al., 2017) ...16
Figure 15 Soda-lime glass mean specific heat capacity (graphed by author using values from (Bansal & Doremus, 1986) ...19
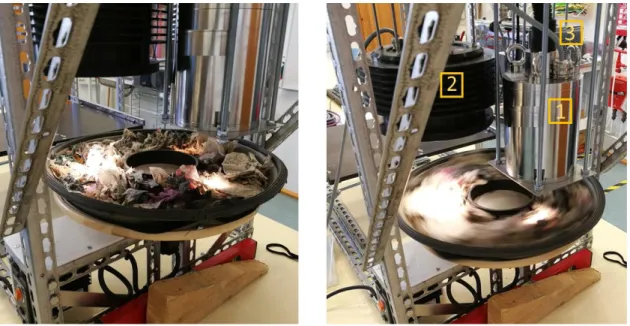
Figure 16 RDF and Instruments ...21
Figure 17 Nordpool electricity price (SEK/MWh) ... 28
Figure 18 Acquired spectra of glass in RDF (untreated 100 samples) ... 29
Figure 19 Treated spectra, 1) MSC, 2) SNV, 3) S.G 1st Der.21 smooth. 4) S.G 2nd Der. 33 smooth. ... 30
Figure 20 PLS-r (MSC) regression coefficients ... 31
Figure 21 PLS-r (MSC) explained variance ... 31
Figure 22 Validation PLS-r (MSC) predicted w. deviation ... 32
Figure 23 Validation PLS-r (MSC) predicted vs reference ... 32
Figure 30 Validation PLS-r (S.G. 1st derivation 21 smoothening points) - predicted w.
deviation ... 36
Figure 31 Validation PLS-r (S.G. 1st derivation 21 smoothening points) - predicted vs reference ... 36
Figure 32 PLS-r (2nd der. S.G - 33 smoothening points) regression coefficients ... 37
Figure 33 PLS-r (2nd der. S.G - 33 smoothening points) explained variance ... 37
Figure 34 Validation PLS-r (S.G. 2nd derivation 33 smoothening points) - predicted with deviation ... 38
Figure 35 Validation PLS-r (S.G. 2nd derivation 33 smoothening points) - predicted vs reference ... 38
Figure 36 Boiler efficiencies (direct vs indirect) ... 40
Figure 37 Boiler input/output, total losses (A) ... 40
Figure 38 Boiler losses, categorical (A) ...41
Figure 39 Boiler input, output, and losses (B) ... 42
Figure 40 Boiler losses categorical (B) ... 43
Figure 41 Result economic - cost due to glass heat loss ... 44
Figure 42 Result economic - cost due to total heat loss ... 44
LIST OF TABLES
Table 1 Constants for Cp calc, of flue gas (Wester, 2013b) ... 25Table 2 Boiler acceptance testing results ... 39
Table 3 Boiler losses (average) ... 39
NOMENCLATURE
Symbol Description Unit
Cp Specific heat capacity kJ/kg, K
P Power W
E Energy J (Wh)
Hi Heating Value (inferior) MJ/kg
𝑚̇ Massflow kg/s
Symbol Description Unit
T Temperature K
t Temperature oC
I Revenue SEK
C Electricity price SEK/MWh
ABBREVIATIONS
Abbreviation Description
RDF Refuse Derived Fuel – sorted and dried combustible waste.
PLS-r Statistical model to find relation between variables via linear regression.
CFB Circulating fluidized bed
BFB Bubbling fluidized bed
S.G. Savitzky-Golay spectral derivation
MSC Multiplicative scatter correction – pre-processing method
OSC Orthogonal scatter correction – pre-processing method
Wt% Percentage by weight
LDPE Low Density PolyEthylene
HDPE High Density PolyEthylene
PET PolyEthylene Terephthalate
SiO2 Silicon dioxide
CaO Calcium oxide
K2SO4 Potassium sulphate
K2O Potassium oxide
KCl Potassium chloride
NaCl Sodium chloride
DEFINITIONS
Definition Description
Flue gas Gaseous product from combustion of fuel
Boiler bed Material which is heated in and circulated in the boiler to ensure proper fuel combustion.
Superheater Heat transfer unit with working medium inside pipes which takes the heat from the hot flue gas.
Soda-lime
1
INTRODUCTION
This degree project regards the investigation of using near-infrared (NIR) spectroscopy to determine glass content in refuse derived fuel (RDF), municipal solid waste (MSW) after it has been processed. It also focuses on investigating the possible impacts on combustion techniques and boiler operation as well as the possibility of further determining boiler performance if continuous on-line data of glass content was available.
1.1 Background
According to the Swedish Energy Agency, Sweden used a total of 55,1 TWh of district heating during the year of 2014. This energy was mainly delivered via combustion of biofuels (36,1 TWh) in combined heat and power plants (CHP-plant). Biofuels are defined in the used statistical data as wood fuels, bioethanol, biodiesel, bio-oils, biogas, and household waste with biogenic origin (Swedish Energy Agency, 2011). Waste used for energy production is the fourth step of the waste management hierarchy issued by the EU, with steps being; reduce waste, reuse material, recycle material, energy recycling (incineration), and lastly landfill deposit (Waste and repealing certain Directives, 2008). This study regards said fourth step, energy recycling, e.g. incineration of waste.
During the year of 2014 in Västerås, Sweden, a CHP-plant which utilizes municipal solid waste/garbage/waste as fuel for combustion was commissioned. This boiler/plant is currently the main source of heat production for Västerås’s district heating network
(Mälarenergi AB, 2017). In order to utilize this waste, it needs to be processed by sorting out any unwanted non-combustible materials such as metals, ceramics, and glass. The processed waste, referred to as RDF, consists of various plastics, textiles, paper, wood, as well as other things found in household and industrial waste (Brás et al., 2017).
With heterogeneous fuel such as RDF (biomass, petroleum products, etc.) comes a wide range of fuel properties in regard to moisture and ash content, heating value, and elemental composition. Biomass based products can have, besides carbon, oxygen, and hydrogen, a higher concentration of silicon, chlorine, potassium, and calcium. The presence of these elements can, during combustion, cause damage to boiler equipment and disrupt boiler operation. Fouling, corrosion, and agglomeration of bed material are some of the typical issues with combustion in boilers. (Khan, de Jong, Jansens, & Spliethoff, 2009)
bed material in turn causes de-fluidization of the circulating fluidized boiler bed and can be detrimental to boiler operation. (Khan et al., 2009)
Besides the mentioned problematic elements in biomass fuel, RDF can also have small fractions of non-combustible materials such as glass (SiO2) present in the fuel, which are too fine to be properly separated. This added unknown variable of glass content along with the already heterogeneous RDF, pose a difficult problem in terms of boiler operation and control due to the increased presence of silicon which leads to higher risk of agglomeration,
defluidization, blockage at system chokepoints, and ultimately boiler shutdown. (Pettersson, Niklasson, & Moradian, 2013; Scala, 2018)
In order to have full control of a boiler in terms of operation, continuous knowledge of the fuel that is fed into the boiler is needed. Near-infrared spectroscopy has been proven to be a viable non-destructive method to determine properties such as heating value, ash and moisture content in biomass based fuels (Skvaril, Kyprianidis, & Dahlquist, 2017). Furthermore, it has also recently been proven to be able to determine glass content in biomass fuel (wood chips). Applying NIR-spectroscopy and principle component analysis (PCA) to describe relations between acquired data (spectra) and sample (glass content), prediction models could be created.The resulting prediction models showed strong correlation between the spectral data and amount of glass, with values for coefficient of determination (how well calculated value corresponds to measured value) ranging from 0,96 – 0,99. (Skvaril, Kyprianidis, Avelin, Odlare, & Dahlquist, 2015)
Building upon the discovered possibilities of determining glass content in wood chips, the purpose of this study is to investigate the possibility of determining glass content in a more heterogeneous fuel such as RDF and what is possible with continuous on-line glass content data.
1.2 Purpose/Aim
The purpose of this study is to evaluate method of determining glass content in RDF using near infra-red (NIR) spectroscopy and thus acquiring continuous glass content data of fuel fed into boiler.
Furthermore, the study also aims to investigate the possibilities and limitations with
continuous glass content data in respect to boiler operation (combustion) and determination of boiler performance (output and losses).
1.3 Research questions
1. What are the possibilities and limitations regarding using NIR-spectroscopy to determine glass content, and how accurate are the prediction models developed from acquired spectral data?
2. With available on-line glass content data (via NIR), what are the possibilities and limitations regarding implementation, boiler operation (combustion) and determination of boiler performance?
3. Building on the determined losses of boiler, what are the related economic impacts?
1.4 Delimitation
The study will only include NIR-spectroscopy measurement of refuse derived fuel with sodium lime glass. However, spectroscopic measurements using NIR on other fuels will be included as literature study for possibility of comparison of results.
Possible impacts on system (boiler of block 6 at Mälarenergi) due to implementation of on-line NIR measurement is limited to boiler operation (combustion, bed fluidity) and
determination of boiler performance. The focus regarding performance is on losses due to glass content, but other theoretical losses are covered (radiation, convection, and unburnt fuel in flue gas) using standardized method set by Swedish Standards Institute (Swedish Standards Institute, 2003). Losses due to unburned combustibles in slag and flue dust is not included.
Boiler type covered in this study is limited to fluidized bed boilers. Focus is on circulating fluidized bed boilers but bubbling bed boilers are also briefly covered by technical overview. Losses due to glass content is treated as the energy stored in the glass/agglomeration that leave the boiler during bed removal.
2
THEORETICAL FRAMEWORK
This part regards the theoretical framework of the study. Compilation of the necessary theoretical knowledge from different literature sources which are needed for the scientific work of this study.
2.1 Refuse Derived Fuel
Municipal solid waste is the waste generated by the municipality, originating from
households and industries. This waste, after undergoing different processes such crushing and sorting (see 2.1.2), becomes the intended fuel for combustion RDF.
2.1.1 Composition and properties
As described earlier in 1.1, RDF is waste used for incineration to generate heat and electricity. Depending on waste origin, the fuel composition and properties varies greatly. But the
majority of the composition is typically comprised of 60 % textile, 20 % plastics, and 20 % paper (Sever Akdağ, Atımtay, & Sanin, 2016). However, this is a very broad generalization of composition, since in reality, there are many types of other compounds present. Such as wood, ferrous and non-ferrous metals, rubber, as well as many different subsections of both paper and plastics. For example, high- and low-density polyethylene as well as PET and plastic piping has been recorded presence in RDF (Montejo, Costa, Ramos, & Márquez, 2011). As mentioned, there is also possibility of inorganic elemental compounds occurring in the RDF (determined by ash), with CaO, SiO2, and Al2O3 typically being the three with highest concentration by weight percent (Sever Akdağ et al., 2016). These components all share a common origin; soda-lime glass used for bottles and windows (Tong, 1994). According to data regarding municipal solid waste (MSW) composition from two different studies there is high percentages of paper and organic materials. Example of MSW and RDF composition expressed in percentage of weight (wt%) can be seen in Figure 1 below.(Montejo et al., 2011)
Figure 1 Composition of MSW and RDF in wt% (Montejo et al., 2011)
The category “plastics” was further divided into subsection of which LDPE (found in plastic bags) was dominant for both cases, see Figure 2 below (Montejo et al., 2011). “Mix” is collective term for other plastics found not represented by the former mentioned plastic types.
Figure 2 Plastics in MSW and RDF in wt% (Montejo et al., 2011) 0 5 10 15 20 25 30 35 40 45 50 55 60
Composition of MSW and RDF [wt%]
MSW composition [wt% average] RDF composition [wt% average]
Plastics in MSW [wt%
average]
HDPE PET LDPE Mix
Plastics in RDF [wt%
average]
Figure 3 MSW composition dependent on origin (Papagiannakis, 2003)
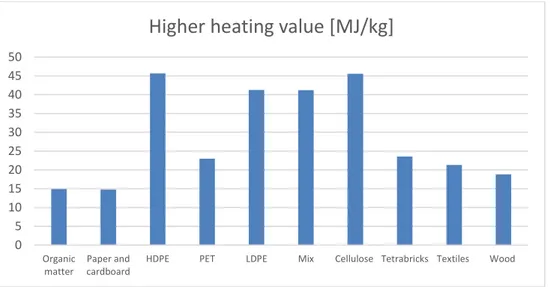
With the wide range of variety of RDF composition, its properties change as well, such as heating value, moisture and ash content. Corresponding heating values for materials
presented in the MSW and RDF composition in Figure 1 and Figure 2 are declared as average higher heating value (Hs – heat used for vaporization of water included) in Figure 4 below (Montejo et al., 2011).
Figure 4 Higher heating value of fuels
2.1.2 Waste processing – Creating RDF
The process of turning waste in to RDF ready for combustion can be, in broad generalization, described in two parts, crushing and sorting. The input waste is fed into a shredder and is grounded into smaller pieces. The crushed waste is then fed through a series of sections
0 10 20 30 40 50 60 70
Organic matter Paper and cardboard
Plastics Glass Metals Textiles, Wood, Leather, Elastics
Inert matter Miscellaneous
MSW composition dependent on origin [wt%]
Domestic [wt%] Commercial [wt%] Industrial [wt%]
0 5 10 15 20 25 30 35 40 45 50 Organic matter Paper and cardboard
HDPE PET LDPE Mix Cellulose Tetrabricks Textiles Wood
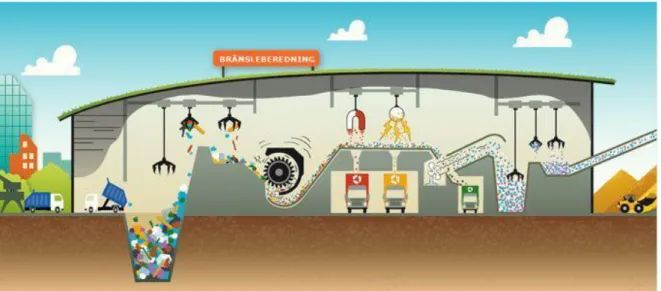
which separate different unwanted components via different methods. Due to no real standardized way of sorting waste, different methods are utilized dependent on site. For example, at Mälarenergi (seeFigure 5), crushed waste is sorted in mainly three steps; 1) magnet (for magnetic metals), 2) separating conductive and non-magnetic metals via generated magnetic flux (Gundupalli, Hait, & Thakur, 2017), and 3) upwards airstream to separate heavy fractions such as ceramics and glass (Mälarenergi AB, 2017).
Figure 5 Waste processing (Mälarenergi AB, 2017)
2.2 Combustion technology and CHP
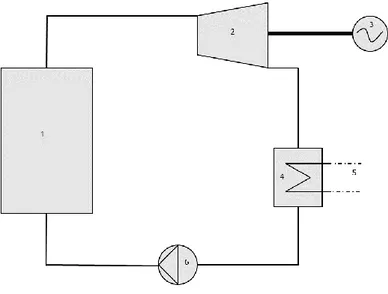
Combined heat and power production plants is the common term for plants utilizing some kind of fuel to generate both electricity and heat. Most common CHP-plants in Sweden are plants combusting fuels in a boiler to generate steam which is then led through turbines generating mechanical work and in turn, electricity. Remaining heat after steam expansion through the turbines is utilized in a condenser where the heat is transferred to the district heating network. A very simple schematic of a general steam cycle can be seen in Figure 6 below.
Figure 6 Simple steam cycle – 1) Boiler, 2) Turbine, 3) Generator, 4) Condenser, 5) District heating network, 6) Pump
The process of combusting the fuel to generate heat occurs in the boiler (#1 in Figure 6). There are three different kinds of boilers, in terms of method of combustion; 1) fixed bed, 2) pulverized bed, and 3) fluidized bed combustion. However, this study focuses on fluidized boilers, which in turn can be divided into further subcategories – bubbling or circulating (Figure 7).
2.2.1 Circulating fluidized bed boiler
Fluidization of boiler bed is done with the use of inert bed material (typically silica sand) and injection of high velocity air (5-10 m/s) from underneath causing the bed material to fly upwards, filling the entire chamber with particles (Wester, 2013a). An example of a CFB boiler can be seen in Figure 8 below, which is a boiler located at Mälarenergi in Västerås.
Figure 8 CFB boiler (boiler 5) (Sandberg, Karlsson, & Fdhila, 2011) -edited by author
Primary air injection (suspension of bed material) is done through nozzles set on the perforated floor of the boiler, which enables bed material and ash to be removed from the process (Scala, 2013). Particles then either fall back down toward the bed, causing
recirculation within the chamber, or have high enough velocity (or light enough) to follow the gas out from the furnace. Particle flow (~10 kg/m2,s) consisting of bed material, solid non-combustibles and unburned fuel present in the gases is then led through two different particle collection systems part of the mail boiler system, primary “U beams” and secondary, cyclone (Leckner, 1998). U beams are placed as gas is led from furnace and collect particles by principle shown in Figure 9.
Figure 9 Ubeams (solid particle separator)- original acquired from (Skvaril, 2015) – edited by author
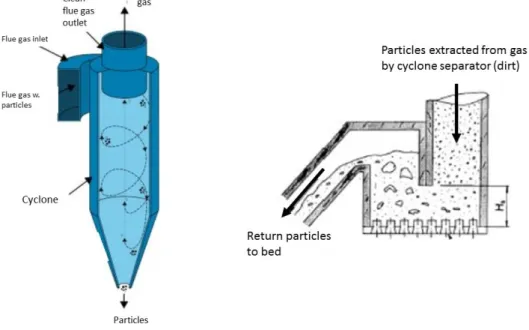
After the U-beams, the gas is led into the cyclone separator which uses rotational effects and gravity to separate the particles from the gas flow. The separated particles end up in a loop seal (see Figure 10 and Figure 7) where the particles eventually are returned to the furnace, completing the external recirculation. After immediate particle separation, the hot gas is led through a series of external super heaters and other gas cleaning systems before ultimately being exhausted. (Leckner, 1998)
Figure 10 Cyclone separator (left) (Skvaril, 2015) and loop seal (right) (Wester, 2013a)– figure compiled and edited by author
2.2.2 Heat transfer in CFB
Dependent on model and type of boiler, number and location of steam generating heat exchanger surfaces (convective and radiant superheaters) can vary. For example, heat exchangers may be located internally within the boiler furnace or external after particle separation from hot gas has occurred (see Figure 8). However, heat exchanger equipment located within the furnace are not favourable in CFB boilers due to high risk of damage from the continuous particle circulation (Brems, Cáceres, Dewil, Baeyens, & Pitié, 2013). Many different auxiliary heat exchangers are found in the system as well, e.g. fluid bed heat exchanger (Koornneef, Junginger, & Faaij, 2007).
2.2.3 Bubbling fluidized bed boilers
Bubbling fluidized bed boilers function in a similar fashion to the circulating kind with some exceptions. BFB has a lower air velocity (1-5 m/s) of the primary air causing the low
suspension of the bed (bubbling) (Skvaril, 2015). Since there is low to zero amount of bed particles in suspension high enough to be transported away via the gas (no circulation), there is no need for an external circulation via the cyclone. Instead, it can be used for removing unwanted particles from the gas as part of cleaning process beyond boiler.
2.3 Performance of boiler
The performance of boiler is either determined via direct method, or indirect. Direct method utilizes the heat absorbed by the working medium, water –steam and dividing it with the energy input from the fuel and flow. Indirect method however, is determined via calculation of all boiler losses, which for combustion of solid fuels includes; heat loss in flue gas, unburnt combustibles in flue gas and bed ash, as well as radiation and convection losses. (Swedish Standards Institute, 2003)
There are other losses present during boiler operation, such as due to remaining heat
removed slag. However, to determine such losses via calculation, data regarding temperature, massflow, and specific heat capacity of removed material is required. With such complicated heterogonous fuel such as RDF, ash and slag composition varies greatly, and in turn specific heat of slag as a whole. These losses are usually deemed not worth to determine due to the complications involved. (Wester, 2013a)
However, as mentioned earlier in 1.1 and 2.1.1, RDF can contain fractions of inert material such as glass from bottles or pieces of metal. These fractions will instead of being combusted, absorb heat and dependent on material melt and cause bed material to adhere to its surface, i.e. agglomeration. Therefore, if amount of inert materials (such as soda-lime glass regarded in this specific study) can be detected in the RDF before it is fed into the boiler, portion of
According to two separate studies regarding acceptance testing of steam generator, one regarding a grate fired boiler burning wood chips, and one BFB boiler combusting a mix of biofuels (such as wood chips and residues), boiler efficiencies are roughly 90 %, +/- 2 %. These efficiencies are calculated using lower heating value (Hi) and system limits are set to not include flue gas condensation. The losses included for these studies were limited to heat lost in flue gas, unburnt combustibles in flue gas, fly and bed ash, convection and radiation losses, where heat in flue gas being the largest loss (upwards 5-8 %). (Rönnberg, 2014; Wallin, 2017)
2.4 Challenges with RDF and biomass combustion
When regarding possible problems during combustion, there are certain elements that cause more issues than others. Elements such as potassium, calcium, silicon, sulphur, nitrogen, and chlorine are the sources of many issues occurring during combustion of biomass, of which RDF has high levels (see 1.1 and 2.1.1). The typical complications with combusting biomass are fouling and slagging, corrosion of equipment, and agglomeration of boiler bed.
2.4.1 Fouling and slagging
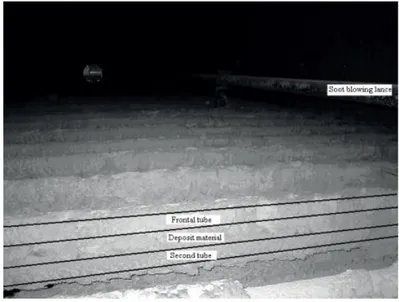
Fouling and slagging is when material is deposited on surfaces inside the boiler. Fouling refers to depositing on heat transfer equipment whereas slagging is depositing on the walls of the combustion chamber (Khan et al., 2009). Depositing is the accumulation of ash on surfaces, which biomass (and RDF in general) has of abundance due to high contents of non-combustibles. According to a proximate analysis from a study on fuel value and combustion characteristics of RDF, typical ash content of RDF is roughly 13-15 wt% (Sever Akdağ et al., 2016). In Figure 11 below, deposit formation can be seen on superheater tubes, photograph provided by (Sandberg et al., 2011).
When combusted, the alkali together with silicates form low melting point (550 oC) eutectics (SiO2 and K2O) as well as other alkali compounds (K2SO4 and KCl) which easily sticks and collects on the various surfaces of the furnace (Niu, Tan, & Hui, 2016). A study regarding deposit composition (burning wood fuel in a BFB) showed that agglomerate on furnace walls was dominated by SiO2 (62,76 %) while on, for example superheater tubes, deposit comprised mainly of CaO, K2O, and SO3 (Miles et al., 1996). Due to the layer of material on surfaces within boiler from depositing, heat transfer is heavily impacted. Albeit heat exchange capability is reduced, deposit in itself is not directly damaging to the equipment, but it can give cause to corrosion (Khan et al., 2009).
Figure 11 Deposit formation on superheater (Sandberg et al., 2011)
2.4.2 Corrosion
Corrosion of metal is an important issue in regard to boiler combustion, especially when combusting biomass and/or RDF. This is due to chlorine (prevalent in such fuels) having significant impact on mechanism of corrosion by speeding up said process (Khan et al., 2009). Corrosion by chlorine is caused, either by gaseous, solid, or molten phases of alkali chlorine compounds, as well as molten alkali sulphates and carbonates. Chlorine in gaseous form interacts with metal as shown by the equation below, where “M” indicates metal while “s” and “g” is state, either solid or gaseous. (Niu et al., 2016)
Equation 1 (Niu et al., 2016)
𝑀(𝑠) +1
2𝐶𝑙2(𝑔) = 𝑀𝐶𝑙(𝑠)
Besides the impact of gaseous chlorine compounds, there is also the effect caused by
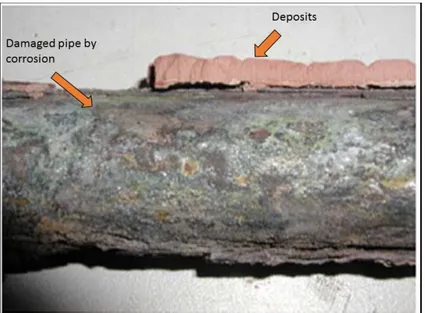
deposited and molten alkali chlorides and sulphates. Compounds such as KCl and K2SO4 are found in high concentration in the deposits and give cause to severe corrosions. Same compounds are also the cause (among others) for corrosion done by molten state alkali chlorides due to them, along with NaCl, forming composites with lower melting points (650 – 700 oC). When melted, compounds can cause even more corrosion due to, for example, higher reaction rate in molten state versus solid.(Niu et al., 2016)
Figure 12 Corrosion damage pipe (Khan et al., 2009)- edited by author
2.4.3 Agglomeration
Agglomeration, in respect to boiler combustion, is defined as clumping of bed material. In the case for fluidized bed boilers, agglomeration is a cause for major concern due to it being potentially damaging to boiler equipment as well as defluidization. Defluidization of bed material can, if severe, cause boiler shutdown and/or blockage at chokepoints (Khan et al., 2009). Temperature range of which agglomeration typically occur is quite broad dependent on fuel used. It has been reported that at 850 oC, ash from combusted straw formed melts together with the silica sand (Scala, 2018). In some cases, agglomeration and defluidization has been reported at temperatures low as 728 oC, due to presence of some specific substance (Anicic, Lin, Dam-Johansen, & Wu, 2018).
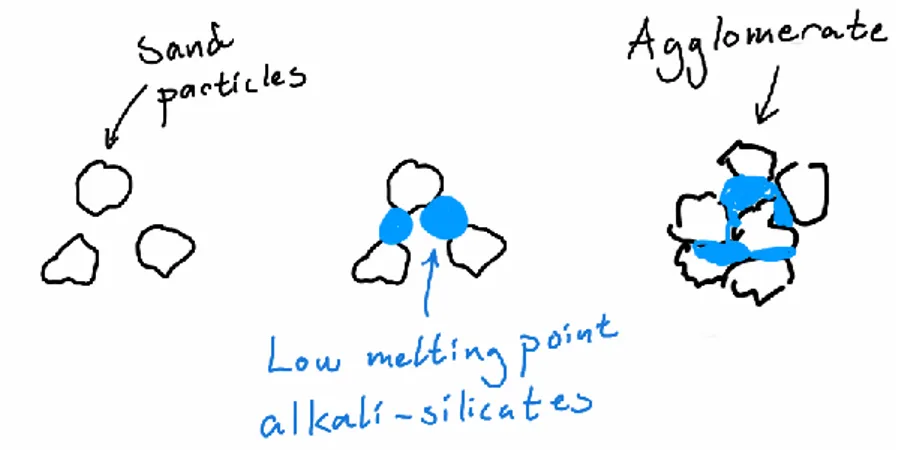
Similar to slagging and depositing, alkali-metals (in the ash) play an important role in
agglomeration of bed material, where they react with silicon (present in fuel and bed material – SiO2) to form sticky low melting-point alkali-silicates (Niu et al., 2016). Sand particles adhere to these sticky semi-molten compounds and form larger (see Figure 13), less prone to fluidization, masses i.e. agglomerates (Bartels, Lin, Nijenhuis, Kapteijn, & van Ommen, 2008). However, in the case of RDF combustion, such problematic elements are not just present as ash in the combustible fuel, but also as inert unwanted materials such as small fractions of glass and ceramics. The added amount of glass (typically soda-lime glass) will be heated to furnace temperature (780-900 oC), which is well above soda-lime glass’s transition temperature of roughly 572 oC. The glass will start to enter transition state and become rubbery and sticky such as the before mentioned alkali-silicates and cause serious
agglomeration problems and can get stuck in chokepoints of ash/bed deposit system. In a study regarding characterization of ash and deposits from a BFB using MSW as fuel, it was found that glass present in the fuel during combustion ended up as molten glass cores of the larger agglomerates (Pettersson et al., 2013).
Figure 13 Agglomeration process example
2.4.4 Countermeasures for potential problems
There are several different approaches to mitigating deposit formation and agglomeration with varying degrees of success and difficulties. The main cause of depositing and
agglomeration is, as mentioned earlier, the formation of low melting-point compounds such as SiO2-K2O eutectics and alkali-formations K2SO4, KCl and CaO (among others). Therefore, mitigation of formation of problematic compounds is of great importance. Dependent on fuel, solutions include but no limited to, utilization of additives and decrease of bed temperature.
In general, additives can help mitigate ash depositing by some mechanisms. Adding heat resistant elements to the ash in order to increase melting temperature (Niu et al., 2016). Furthermore, additives can also react with ash components (K2O, SiO2, etc.) and form compounds with high melting-point temperatures, which prevents both depositing and in turn deposit-induced corrosion (Khan et al., 2009). In a study regarding hindering of ash melts and sintering (formation of mass) during combustion of rye straw, showed that calcite and kaolin addition was very efficient. At combustion temperatures of 900 – 1000 oC, state of ash was only “slightly sintered” or “Loose ash” when using kaolin or calcite as additive
respectively, which can be compared to the ash melting when firing without additive. (Wang, Skreiberg, Becidan, & Li, 2014)
Another possible solution to prevent agglomeration of bed material is reducing operating bed temperature. An experiment was conducted by (Pettersson et al., 2013) using RDF
combusted in a BFB boiler at two different scenarios, 1) standard operating conditions of 850-900 oC and 2) lowered temperature of roughly 150 oC. Using different analytical
methods, such as scanning electron microscopy and X-ray diffraction, it was determined that reducing bed temperature was very effective in mitigating depositing, agglomeration and
showed a large increase in chlorine content captured by bed sand and thereby decreasing chlorine available to cause corrosion. (Pettersson et al., 2013)
Further setting of boiler operation to prevent agglomeration of the fluidized bed material is that of increasing the fluidization velocity. Doing this increases the rate of bed circulation and particle velocity, which results in less contact between particles and in turn less chance of them adhering to each other at high temperatures.(Scala, 2018)
2.5 Near Infra-Red (NIR) spectroscopy
The NIR-spectrum is defined as the range of wavenumbers 12000 – 4000 cm-1. The basic underlying principle of NIR spectroscopy is that of absorption and radiation due to electromagnetic waves. The molecules absorb some energy to enter an excited (higher
energy) state. During this transition, the molecule vibrate in correspondence to atomic bonds of the molecule and generate identifiable overtone bands (vibrational spectrum), e.g.
stretching of the atom and bonds within the molecule.(Osborne, Fearn, Hindle, & Osborne, 1993)
In the Figure 14 below a typical measurement within the NIR-spectrum is presented. The spectrum is from a measurement of solid biomass and above the different absorption bands are displayed.
The measurements of NIR-instruments are done in mode of diffusive reflectance, incoming ray is scattered when reflected by the uneven surface. Acquired spectra displayed is presented in the relative absorption dependent on wavenumber, as can be seen in Figure 14. However, the reality is that the instrument measures the intensity (diffuse reflectance mode) of sample as well as a reference (reflective) surface. Acquirement of absorption spectra is then done via relation shown in Equation 2 (Skvaril, 2017).
Equation 2
𝐴𝑟 = log10(
𝐼𝑟𝑒𝑓𝑒𝑟𝑒𝑛𝑐𝑒
𝐼𝑠𝑎𝑚𝑝𝑙𝑒
)
The above mentioned relation between spectra and absorption (A) is based on the Beer-Lambert law which states the absorption as a relation between optical path length (d) i.e. length of which light travels into the sample, molar concentration (c) and absorptivity (ε), see Equation 3 below. (Siesler, 2002)
Equation 3 (Siesler, 2002)
𝐴 = 𝑑 ∗ 𝑐 ∗ 𝜀
2.5.1 NIR pre-processing techniques - Chemometrics
When dealing with pre-processing techniques, scatter correction and spectral derivatives are the two usual techniques applied. Some popular pre-processing techniques, or more
commonly called “chemometrics” when including the model calibration, in these categories are multiplicative scatter correction (MSC) and standard normal variate (SNV) for scatter correction, and Savitzky-Golay derivatives for spectral derivatives. The general idea of scatter correction is to lower the impact of light scattering dependent on different sample physical properties (Rinnan, Berg, & Engelsen, 2009). Treated spectra with scatter correction look like a condensed version of the original samples (see 4.1.1). Whereas the scatter correction techniques reduce scattering, spectral derivatives diminish the multiplicative/additive effects as well as constant background noise in the spectra (Siesler, 2002).
Second part of chemometrics (after spectra pre-treatment) is developing of model using some regression analysis such as partial least square regression (PLS-r). PLS-r is a type of
modelling method which finds linear regression for two sets of data, responses and predictors. Typical important properties of a developed model include explained variance (explained variance of variables for each factor) for the calibration data set and regression
2.5.2 Utilization of NIR-spectroscopy
The fields of which NIR-spectroscopy is used in varies greatly, from medicine to agriculture. There have been many studies done regarding determination of properties of biomass-based fuels. Properties determined using NIR together with some regression technique (PLS, PCA, etc.) is mainly focused toward; heating value, moisture and ash content (Skvaril et al., 2017). A study regarding determination of before mentioned fuel properties as well as lignin content in biomass showed that NIR, combined with partial least square regression (PLS-r) was very accurate in that respect. Prediction models with R2 values of 0,92 (heating value), 0,90 (moisture), and 0,80 (ash) was acquired. Such high accuracy of models from NIR-spectra show that NIR is a viable tool for on-line determination of fuel properties since the
instrument always will “see” the sample material and can therefore determine its properties. (Skvaril, 2017)
However, using NIR-spectroscopy to determine glass content in different materials have, according to some studies, been shown to greatly differ in accuracy dependent on method and material. The first study, which is mentioned in 1.1, used one type of background material (wood chips) and transparent soda-lime glass for NIR-measurement and PCR for modelling on acquired spectra. Said study yielded high values for R2 (roughly 0,9) due to glass being placed upon the background material, given no chance for glass to be covered by material and prohibit detection by NIR (Skvaril et al., 2015). Another study of detecting glass using NIR only achieved R2 values for their models of 0,36, 0,63, and 0,83. The wide spread of values may be explained by total of three factors which are; 1) difference in model accuracy due to transparent or coloured glass, 2) using acquired spectra from different background materials for the models, and 3) using PLS-R to develop the models (Winn, Sivaram, Aslanidou, Skvaril, & Kyprianidis, 2017). Furthermore, another distinguishing difference between the two studies is that the latter mixed the glass with the background material, creating a more realistic representation of glass in waste fuels. The author hypothesises that the increased accuracy of models regarding to detection of coloured glass is due to absorption of colourants present in glass (Winn et al., 2017).
2.6 Glass and its properties
Majority of glass production and glass currently in circulation is that of soda-lime glass. Soda-lime glass is composed mainly, with varying concentrations, of SiO2 (71,9 %), Na2O (16,5 %), and CaO (4,8 %) (Tong, 1994). There are some other components present but at very low quantities. Composition can also vary dependent on colouring of the glass and manufacturer. Soda-lime glass is used for bottles and windows (flat glass) which make soda-lime glass so prevalent in society. Especially bottles due to it being used for beverages such as beer and soda.
2.6.1 Structure and absorption of glass
As stated in the above passage 2.6, soda-lime glass is mainly composed of SiO2 which in their naturally form structures as network of SiO4. However, during excitement, bonds such as Si-O-Si and Si-O-Si-O have some attributed overtone bands dependent on stretching and bending. These bands occur at 400-505, 600 and 770-820 cm-1 as well as 970-1095 cm-1. (Khalil et al., 2010)
2.6.2 Specific heat capacity of glass
When heated to certain temperature, glass enters a transition state (viscous and rubbery) before becoming melt. The specific heat capacity of glass varies between types of glass, but varies most due to temperature. At increase temperature, the heat capacity increases steadily until it reaches a certain temperature (transition temperature) and then increases drastically for some set amount. (Rao, 2002)
However, since this study considers soda-lime glass in relation to boiler combustion specific heat capacity change only needs to be regarded for temperatures towards 900 0C. As
mentioned, soda-lime glass composition can vary to some degree, but it does not affect the specific heat capacity in any major magnitude (Cárdenas, León, Pye, & García, 2016).
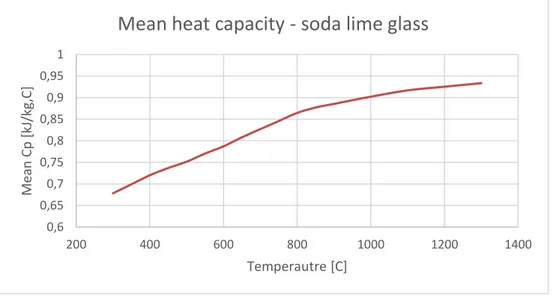
However, the specific heat capacity of soda-lime glass does vary with temperature. The mean specific heat capacity between reference temperature 25 oC and some temperature T is presented in Figure 15, with values varying from roughly 0,65 to 0,95 J/g,C. The values used for the graph has been acquired from table 7.24 in “Handbook of Glass Properties” (Bansal & Doremus, 1986).
Figure 15 Soda-lime glass mean specific heat capacity (graphed by author using values from (Bansal & Doremus, 1986) 0,6 0,65 0,7 0,75 0,8 0,85 0,9 0,95 1 200 400 600 800 1000 1200 1400 Me an Cp [kJ /kg, C] Temperautre [C]
3
METHOD
The following presented method for this study is divided into different parts in respect to each section of the study; NIR-measurements, boiler losses (determination and validation), boiler operation and combustion techniques.
3.1 Method: NIR – Spectra acquisition and model calibration/validation
Methods for performing the study regarding application of NIR-spectroscopy to determine glass content is described in three separate parts; test sample preparation, NIR-spectroscopy measurement, data analysis and modelling. Sample preparation and measurements are done in a laboratory using NIR-spectroscopy instrument. Data analysis and modelling is done using the software “Unscrambler” (Unscrambler, 2018).3.1.1 Sample preparation and configuration
In order to create a robust and reliable prediction model for determination of glass content in RDF, realistic sample configurations have to be created. Each sample measured on using NIR included background material (see RDF 3.1.1.1) and increasing amount of glass for each sample (see glass type 3.1.1.2). Every new sample (each instance of added glass) was prepared by putting sample contents (RDF and added glass) in a bucket and shaking it. Content was then poured back in the deep dish used during measurements. This was done to simulate realistic scenarios, i.e. how the fuel and glass would be distributed on the conveyor belt. In total, 100 samples were prepared with different concentrations of glass, measured in weight percent. The studied concentrations of glass ranged from 0 to 20 wt%. Complete description of sample configurations throughout the days of measurement can be seen in appendix 2.
Background material – Processed RDF
“Processed RDF” is processed waste (ready for combustion) which has already been sorted of unwanted non-combustibles and shredded into smaller pieces. Pre-treatment of RDF
includes picking out any visible glass particles already in the material as well as creating stable moisture condition by letting the RDF dry in room temperature under a fume hood for a long period of time.
Glass type
The glass type utilized for this study was coloured bottle glass (green and brown), i.e. soda-lime glass. Several different bottles have been crushed into random pieces of different shapes and sizes.
3.1.2 NIR-spectra acquisition
The spectra acquisition is done using diffuse reflectance between wavenumbers 12000-4000 cm-1. The FT-NIR spectroscopy instruments are set to acquire spectra at resolution of 8 cm-1 (wavenumbers) and averages 32 scans. During spectra acquisition, the studied sample rotates on a disk at 60 RPM to simulate a conveyor belt as well as to get more representative spectral data.
Figure 16 RDF and Instruments
3.1.3 Data analysis, modelling, and validation
The 100 acquired NIR-spectra of samples are divided up 70 – 30 (+/- 10), 70 for calibration and 30 for validation of developed model. The following different chemometrics (based on common techniques according to 2.5) are done on the acquired spectral data prior to developing PLS-r models using Unscrambler:
Multiplicative scatter correction (MSC) Savitzky-Golay algorithm (smoothening)
o 1st derivative o 2nd derivative
Standard normal variate (SNV)
The developed models with the different chemometric methods are validated via regression prediction using another set of data not used in the calibration of the model. The validation results are evaluated using coefficient of determination (R2) for the predicted values versus reference (predicted vs reference). The coefficient of determination (R2) shows how well the
Equation 4 𝑅2= 1 − ∑ (𝑦𝑖− 𝑦̂𝑖) 2 𝑛 𝑖=1 ∑𝑛𝑖=1(𝑦𝑖− 𝑦̅𝑖)2
Further evaluation of developed models includes development of the explained variance at increased factors as well as studying the resulting model’s regression coefficients (see 2.5.1).
3.2 Method: Boiler energy balance (losses)
The determination of boiler performance is done using the standard praxis as presented by SIS, Swedish Standards Institute – water tube boilers and auxiliary installations, acceptance tests, as a guideline for equations. (Swedish Standards Institute, 2003)
Relevant data needed, such as flue gas composition, flows, and temperatures etc. of the boiler system is acquired by logged data and different analysis are provided by Mälarenergi.
3.2.1 System description – Block 6
The boiler of “block 6” is a circulating fluidized bed boiler using RDF as fuel and silica sand as bed material. The maximum power of the boiler is 220 MW and documented efficiency of approximately 90%. Immediate separation process of bed material from the flue gases is done only via cyclone, with separated particles leading back to the boiler via particle loop seal as described in 2.2.1. After particle separation the flue gases are led through superheaters, reheaters, economizers, and air preheater. Cleaning process of flue gas is (excluding cyclone) comprised of NID-reactor (“Novel Integrated Desulfurization”) and scrubber. When needed, the bed and ash is removed from the boiler through the bottom which then lead to a separate system and ultimately disposal. Some of the bed and ash is sent away for analysis.
Due to the complex fuel of RDF, a myriad of complications occurs similar to combustion of biomass, e.g. agglomeration and corrosion. But consistent with any type of CHP, losses are prevalent during operation and should be determined.
3.2.2 Boiler energy balance and efficiency
The energy balance over the boiler is determined by the following equations which represent input, useful output, and various losses.
Equation 5
The mentioned factors in Equation 5 are used when determining the boiler efficiency, either directly (Equation 6) or indirectly (Equation 7).
Equation 6 𝜂𝑑𝑖𝑟𝑒𝑐𝑡 = 𝑃𝑜𝑢𝑡𝑝𝑢𝑡,𝑢𝑠𝑒𝑓𝑢𝑙 𝑃𝑖𝑛𝑝𝑢𝑡 Equation 7 𝜂𝑖𝑛𝑑𝑖𝑟𝑒𝑐𝑡 = 1 − ( ∑ 𝑃𝑙𝑜𝑠𝑠𝑒𝑠 𝑃𝑖𝑛𝑝𝑢𝑡 )
The energy input to the boiler is determined by the inferior heating value of the fuel and flow of fuel fed into the boiler. Since RDF is very heterogeneous in composition and properties, heating value is taken as an average of previously determined (using bomb calorimeter) heating values of the RDF.
Equation 8
𝑃𝑖𝑛𝑝𝑢𝑡 = 𝐻𝑖,𝑓𝑢𝑒𝑙∗ 𝑚̇𝑓𝑢𝑒𝑙
Useful power output from the boiler (Equation 9) is set as the heat absorbed by the water in the system when it goes through the boiler (Equation 10) as well as heat absorbed from the remaining heat in the exiting flue gases (i.e. flue gas condensation, Equation 11). These are both calculated using the massflow of water in the system and its change in enthalpy for the points in the system.
Equation 9 𝑃𝑜𝑢𝑡𝑝𝑢𝑡,𝑢𝑠𝑒𝑓𝑢𝑙= 𝑃𝑠𝑡𝑒𝑎𝑚 𝑏𝑜𝑖𝑙𝑒𝑟 Equation 10 𝑃𝑠𝑡𝑒𝑎𝑚 𝑏𝑜𝑖𝑙𝑒𝑟= 𝑚̇𝑠𝑡𝑒𝑎𝑚∗ (ℎ𝑜𝑢𝑡 𝑏𝑜𝑖𝑙𝑒𝑟− ℎ𝑖𝑛 𝑏𝑜𝑖𝑙𝑒𝑟) Equation 11 𝑃𝑓𝑙𝑢𝑒𝑔𝑎𝑠 𝑐𝑜𝑛𝑑𝑒𝑛𝑠𝑎𝑡𝑖𝑜𝑛= 𝑚̇𝑠𝑡𝑒𝑎𝑚∗ (ℎ2− ℎ1)
combustibles in the flue gas, radiation and convection losses, and heat stored in the removed glass which is fed into the boiler via the fuel. Methods of determining the different heat losses are described in the upcoming sections; 3.2.3, 3.2.4, 3.2.7, and 3.4.
Equation 12
𝑃𝑙𝑜𝑠𝑠𝑒𝑠 = 𝑃𝑓𝑔−𝑙𝑜𝑠𝑠+ 𝑃𝐶𝑂−𝑙𝑜𝑠𝑠+ 𝑃𝑟𝑎𝑑.𝑐𝑜𝑛𝑣−𝑙𝑜𝑠𝑠+ 𝑃𝑠𝑡𝑜𝑟𝑒𝑑 ℎ𝑒𝑎𝑡 𝑔𝑙𝑎𝑠𝑠
3.2.3 Flue gas losses
The losses due to flue gas is the remaining heat present in the flue gas flow as it leaves the stack.
Equation 13
𝑃𝑓𝑔−𝑙𝑜𝑠𝑠= 𝑉̇𝑓𝑔∗ 𝑐𝑝̅̅̅𝑓𝑔,𝑚𝑖𝑥∗ (𝑡𝑠𝑡𝑎𝑐𝑘− 𝑡𝑟𝑒𝑓𝑒𝑟𝑒𝑛𝑐𝑒)
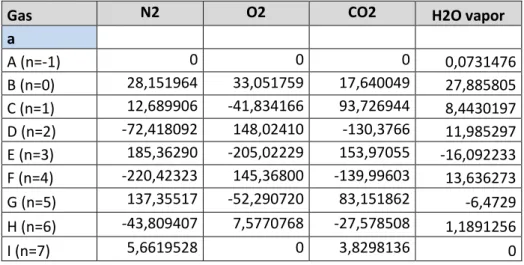
Specific heat capacity, cp, (expressed in kJ/kg,K by Equation 15) of the flue gas mix is calculated as the proportional sum of the specific heat capacities (see Equation 14) for the different gases present in the flue gas composition. Equation 15 integrated between two temperatures (Equation 16) is used for calculating mean specific heat capacity for the
different gas components. Data regarding flue gas composition is acquired from Mälarenergi. Data for constants used when calculating specific heat capacity for the different gases in the flue gas is presented in Table 1.
Equation 14 𝑐𝑝
̅̅̅𝑓𝑔,𝑚𝑖𝑥 = [𝑁2] ∗ 𝑐𝑝̅̅̅𝑁2+ [𝑂2] ∗ 𝑐𝑝̅̅̅𝑂2+ [𝐶𝑂2] ∗ 𝑐𝑝̅̅̅𝐶𝑂2+ [𝐻2𝑂] ∗ 𝑐𝑝̅̅̅𝐻2𝑂
The a, n, and T in Equation 15 (Wester, 2013b) are the polynomial constants, exponent, and temperature respectively. The M is the notation for the molar mass for respective gas x. The constants and exponents are declared in Table 1. With the mean specific heat capacity of a gas between two temperatures is calculated using Equation 16.
Equation 15 (Wester, 2013b) 𝑐𝑝𝑔𝑎𝑠,𝑥= ∑ 𝑎𝑥∗ (1000)𝑇 𝑛 𝑀𝑥 Equation 16 𝑐𝑝 ̅̅̅𝑔𝑎𝑠.𝑥 = 1 (𝑇 − 𝑇𝑟𝑒𝑓) ∫ 𝑐𝑝𝑔𝑎𝑠,𝑥 𝑇 𝑇𝑟𝑒𝑓 𝑑𝑇
Table 1 Constants for Cp calc, of flue gas (Wester, 2013b)
Gas N2 O2 CO2 H2O vapor
a A (n=-1) 0 0 0 0,0731476 B (n=0) 28,151964 33,051759 17,640049 27,885805 C (n=1) 12,689906 -41,834166 93,726944 8,4430197 D (n=2) -72,418092 148,02410 -130,3766 11,985297 E (n=3) 185,36290 -205,02229 153,97055 -16,092233 F (n=4) -220,42323 145,36800 -139,99603 13,636273 G (n=5) 137,35517 -52,290720 83,151862 -6,4729 H (n=6) -43,809407 7,5770768 -27,578508 1,1891256 I (n=7) 5,6619528 0 3,8298136 0
3.2.4 Unburnt combustibles in flue gas
The losses due to unburnt combustibles in the flue gas is determined via the fuel massflow, volume of dry flue gas (Vfg dry), carbon monoxide content by volume of dry flue gas ([CO]dry), and the net calorific value (Hi CO ) per volume of carbon monoxide (standard conditions). Equation 17
𝑃𝐶𝑂−𝑙𝑜𝑠𝑠= 𝑉̇𝑓𝑔 ∗ [𝐶𝑂] ∗ 𝐻𝑖 𝐶𝑂
3.2.5 Unburnt combustibles in fly ash
Data used for calculation of the loss due to unburnt combustibles in the fly ash is acquired from an outsourced ash analysis as well as logged data by Mälarenergi. Total organic content (TOC) is assumed to have a heating value related to standard value unburned organic carbon. Equation 18
Mälarenergi. Total organic content (TOC) is assumed to have a heating value related to standard value for unburned organic carbon.
Equation 19
𝑃𝑢𝑛𝑏𝑢𝑟𝑛𝑡,𝑏𝑜𝑡𝑡𝑜𝑚𝑎𝑠ℎ= 𝑚̇𝑟𝑒𝑚𝑜𝑣𝑒𝑑 𝑏𝑒𝑑𝑚𝑎𝑡𝑒𝑟𝑖𝑎𝑙∗ [𝑇𝑂𝐶] ∗ 𝐻𝑖,𝑇𝑂𝐶
3.2.7 Radiation and convection losses
The losses due to radiation and convection in the boiler is calculated by using the empirical equation presented below (Equation 20), which is based on fuel type (c-value) and the maximum power of the boiler, 220 MW. Value for c is taken from (Swedish Standards Institute, 2003) which in this case corresponds to constant value used for fluidized bed boilers.
Equation 20
𝑃𝑟𝑎𝑑.𝑐𝑜𝑛𝑣−𝑙𝑜𝑠𝑠 = 𝑐 ∗ 𝑃𝑛𝑜𝑚𝑖𝑛𝑎𝑙,𝑓𝑢𝑟𝑛𝑎𝑐𝑒
0,7
𝑐 = 0,0315
3.3 Data for boiler calculations
The data relevant to the calculations of boiler energy balance is acquired from Mälarenergi and regards the period 2017-08-14 to 2017-08-26. Due to sensitive data, the logged data will not be presented, only the results from the calculations.
Flue gas composition after cleaning before exhaust and flue gas condensation has been used for the calculations. There are other gases present than N2, O2, CO2, and H2O, but these only represent a miniscule portion and are therefore not included when calculating heat loss in the flue gas.
3.4 Method: Determination of losses due to soda-lime glass
The method for determining the heat stored in glass as it leaves the boiler (loss) will be done via calculation. The calculation of specific heat capacity is done using expression and data acquired from literary sources for soda-lime glass. The loss due to heat stored in glass leaving the boiler is calculated using Equation 21. The massflow of glass is determined from
percentage of glass found in RDF reported outsourced fuel analysis, which was 2,37 % in average for the two weeks.
Equation 21
𝑃𝑠𝑡𝑜𝑟𝑒𝑑 ℎ𝑒𝑎𝑡 𝑔𝑙𝑎𝑠𝑠= 𝐶𝑝̅̅̅̅𝑠𝑜𝑑𝑎−𝑙𝑖𝑚𝑒 𝑔𝑙𝑎𝑠𝑠∗ 𝑚̇𝑓𝑢𝑒𝑙∗ [𝐺𝑙𝑎𝑠𝑠] ∗ Δ𝑇𝑔𝑙𝑎𝑠𝑠
The specific heat capacity of the glass is calculated via interpolation between values by using IF-statements. Data for mean heat capacity used is shown in Figure 15 showing glass heat capacity change with temperature increase, of which data is originally from (Bansal & Doremus, 1986).
3.4.1 Temperature of removed heated glass melt (slag)
The temperature of the removed material from the boiler bed (agglomerated clumps of SiO2 and other compounds) is used as basis for how much energy is lost due to glass content. The temperature of the glass as it leaves the boiler, is assumed to be the same as the bed
temperature. The bed temperature is logged continuously for different parts of the boiler bed during operation and the mean of said temperatures is utilized for loss calculation. Since this is an educated assumption (by author) regarding glass temperature, a sensitivity analysis for glass temperature is done with limit of glass reaching 75% of bed temperature for good measure. The actual system includes a heat exchanger for utilization of the heat from the removed bed material to the fresh material. However, for the sake of calculations, the envelope has been set before any kind of these waste heat exchanging.
3.5 Economic and environmental aspects
Economic aspect is tied to general boiler losses and inert material (glass) in fuel is investigated by quantifying costs as lost revenue due to lost heat as well as compiling appraisals for cause and effect during boiler complications (stoppage).
Lost revenue due to total energy loss over the two-week period as well as for only loss due to glass is calculated using Equation 22 below where Irevenue is the lost revenue (SEK), Eloss the lost energy, and Cenergy the revenue from sold unit of energy of heat/electricity (SEK/MWh). The revenue from sold unit energy is based on an estimation from the view of a customer. This is no way a representative economic calculation of the exact lost revenue of Mälarenergi, only a general estimation of losses economic worth.
Equation 22
Figure 17 Nordpool electricity price (SEK/MWh)
Beyond the standard lost revenue due to energy loss, there is also the issue of cost of
production related to operational disturbances. These operational disturbances stem mostly from low quality of fuel, which when combusted leads to increased bed replacement and ash extraction etc.
3.6 Boiler operation and combustion techniques
Analysis regarding possibilities and limitations of boiler operation and combustion
techniques with continuous on-line data of glass content in fuel is done via literature study and compilation and study of operational data from the plant regarded in this study.
0,00 200,00 400,00 600,00 800,00 1000,00 1200,00 1400,00 0 50 100 150 200 250 300 350 SE K/MWh hours
4
RESULTS
The following sections presents and describes shortly the different results of the study. Beginning with the results from the NIR-measurements and acquired regression models. The results regarding NIR are followed by results from the calculations of acceptance testing of the CFB boiler and accompanying environmental and economic impacts.
4.1 Results - NIR spectroscopy
The results from the study regarding NIR is presented in the order of acquired spectra from the measurements, before and after pre-processing methods, followed by the various developed regression models and the resulting validation values.
4.1.1 Acquired spectra
In Figure 18 below, the spectra of 10o samples of RDF and glass at varying concentrations is presented. The full measured spectra (12000 – 4000 cm-1) in Figure 18 is before any
pretreatment method has been applied.
used on the untreated spectra (Figure 18). Spectra treated with SNV, MSC, and S.G. 1st and 2nd derivative are presented below, see Figure 19.
Figure 19 Treated spectra, 1) MSC, 2) SNV, 3) S.G 1st Der.21 smooth. 4) S.G 2nd Der. 33 smooth.
4.1.2 Developed models
The developed models with corresponding validation through regression prediction are presented in same succession as spectra is presented in Figure 19, starting with the PLS-r model using MSC.
PLS-r w. MSC
The parts of the model presented are the regression coefficients corresponding to
wavenumbers 12 000-4 000 cm-1 (Figure 20) which the software believes to be important (high values) followed by the explained variance (2.5.1) which shows how much variation of data the model accounts for at each factor in comparison between reference (blue) and
predicted (red) using the calibration data set (Figure 21). The prediction using validation data set can be seen in Figure 22 and Figure 23.
Figure 20 PLS-r (MSC) regression coefficients
The explained variance is shown below for increased projected factors. At 3 factors, 33 % of the variance of y is explained.