J
Ö N K Ö P I N GI
N T E R N A T I O N A LB
U S I N E S SS
C H O O L JÖNKÖPING UNIVERSITYCorporate Spinoffs
A R i s k a n d R e t u r n P e r s p e c t i v e
Assignment: Bachelor Thesis in Finance
Author: Hampus Lundh
Tutor: Per-Olof Bjuggren & Johan Eklund Place: Jonkoping, 2007-01-30
Bachelor Thesis in Finance
Title: Corporate Spinoffs- A Risk and Return Perspective Author: Hampus Lundh
Tutor: Per-Olof Bjuggren & Johan Eklund Date: 2007-01-30
Subject terms: Corporate Spinoffs, Spinouts, Deconsolidation, Corporate-reconstructing, Corporate-specialization, Systematic risk, Return
Abstract
Spinoffs are an increasing phenomenon on the Swedish stock market. In this report one can read about factors that trigger spinoffs as well as about the short and medium term risk and return that spinoffs yield. I have observed 17 pre-spinoff companies that become 34 post-spinoff companies which continued to be traded on the stock market.
For the purpose of the investigation I use time-series regression, and my model is the sin-gle-factor market model. I use this model to estimate the beta and the firm specific factor. Supporting theories are: efficiency, portfolio theory, valuation method and asymmetry all those topics are central parts in a spinoff.
From my research I can not prove that spinoffs increase shareholders wealth. That means that the new units created through a spinoff are not more worth than the old corporation as such the new units do not outperform the old conglomerate structures expected return. However, the new units beta is not equal the old conglomerate structures beta, and this may due to change in capital structure. The weighted beta increase in half of the times, as such, it suggests a higher level of debt financing.
By comparing the spinoff company and the parent company in the post-spinoff scenario it can be concluded that the company who is performing the best is also the riskier alternative and the spinoff performs better than the parent company in eleven out of seventeen times. There is also a correlation between risk and return - when higher return is observed it also brings higher risk, and it holds true in all samples except one.
Further, at group level the spinoff group performs better than the market return and the spinoff group performs on average better than the parent group. Thus, if an outside inves-tor is to invest in either a spinoff company or a parent company one should buy the spinoff company at preferred weight according to the investors risk preferences.
Table of Contents
1 INTRODUCTION... 2
1.1 BACKGROUND... 3
1.1.1 Historical background ... 3
1.2 THE SITUATION DURING THE STUDY... 4
1.3 PROBLEM AND PURPOSE... 5
1.4 PREVIOUS RESEARCH... 6
1.5 OUTLINE OF THE STUDY... 6
1.6 LIMITATIONS... 6
2 THEORETICAL FRAMEWORK... 7
2.1 COST AND EFFICIENCY... 7
2.2 PORTFOLIO THEORY... 9
2.3 CAPITAL ASSET PRICING MODEL (CAPM)... 10
2.3.1 Assumptions ... 10
2.3.2 The process ... 11
2.3.3 CAPM and the single-factor market model... 11
2.3.4 Beta implication ... 12
2.4 ASYMMETRIC INFORMATION... 12
3 METHODOLOGY... 14
3.1 THE REGRESSION MODEL... 14
3.1.1 Forecasting with the single-factor market model ... 15
3.2 DATA COLLECTION... 16
3.2.1 Risk free rate presentation ... 16
3.2.2 Market rate of return ... 17
3.3 VALIDITY... 17
4 EMPIRICAL RESULTS ... 18
4.1 PRE-SPINOFF... 18
4.2 POST-SPINOFF... 19
4.3 RELATIVE RETURN COMPARISON, POST-SPINOFF... 20
4.4 UNCOVER THE RISK AND RETURN RELATION, POST-SPINOFF... 21
4.5 CONGLOMERATE VS. SEPARATE UNITS... 22
4.6 GROUP COMPARISON... 24
5 ANALYSES OF CORPORATE SPINOFFS ... 25
5.1 TRIGGERS... 25
5.2 EACH SPINOFF CASE’S RISK AND RETURN... 26
5.3 AVERAGE GROUP’S RISK AND RETURN... 27
5.4 POSSIBLE GAINS... 28
5.5 CONFLICTS... 28
6 CONCLUSION... 29
7 FURTHER TOPICS FOR RESEARCH ... 30
8 REFERENCES ... 31
Figures
FIGURE 1-1SPINOFF ILLUSTRATION... 5
FIGURE 2-1CAPITAL MARKET LINE COMBINED WITH MARKOVITZ EFFICIENCY FRONTIER... 9
FIGURE 4-1VISUALIZATION OF POST-SPINOFF BETA... 20
Tables
TABLE 3-1SWEDISH GOVERNMENT BOND, ANNUAL RISK-FREE RATE... 17TABLE 4-1PRE-SPINOFF BETA PRESENTATION... 18
TABLE 4-2POST-SPINOFF BETA PRESENTATION... 19
TABLE 4-3POST-SPINOFF RETURN COMPARISON... 20
TABLE 4-4POST-SPINOFF, UNCOVERING RISK AND RETURN... 21
TABLE 4-5POST-SPINOFF, A WHAT IF SCENARIO OF RETURN... 23
TABLE 4-6CROSS-TIME BETA COMPARISON... 23
TABLE 4-7AVERAGE GROUP MEASURES... 24
Formulas
FORMULA 2-1SECURITY MARKET LINE... 11FORMULA 2-2RETURN FORMULA... 11
FORMULA 2-3SINGLE-FACTOR MARKET MODEL... 12
FORMULA 2-4SINGLE-FACTOR CAPM... 12
FORMULA 3-1RANDOM WALK WITH DRIFT... 15
FORMULA 3-2PURE RANDOM WALK... 15
FORMULA 3-3COVARIANCE... 15
FORMULA 3-4VARIANCE... 15
1 Introduction
Below one can find an introduction of spinoffs as well as a presentation of the problems which I believe are connected to spinoffs. Further on I will discuss appropriate method to solve the problems and how previous research has approached the area.
Corporate success in shareholder perspective lies in the increase in return of the investment and such they like high expected return. Managers and investors have in many years tried different strategies for maximizing the value of the company as well as meeting the share-holders demand to maximize the value of their holdings.
In this paper I will be specific on a popular trend coming up, namely the case of spinoffs, it is also to be called fissions and, or, deconsolidation. A spinoff happens when a company determines to make one business unit of the company independent. Usually this deconsoli-dation is done by shifting the spinoff company to the existing shareholders, for simplicity one can think of it as a kind of dividend to the existing shareholders (Wang, 2005). The question arising in a spinoff scenario is if it really adds any wealth to the shareholders and to what extent it does so or not. This makes me start examining how an increase in specialization affects shareholders. I examine the spinoff from the risk-and-return point of view both in pre- and post-spinoff scenario. I further carry out a cross section comparison in time to compare the corporations and the risk the corporations are facing. Since a spinoff creates more focused business units I discuss efficiency in corporations and to see if there might be any linkage between specialization in an organisation with the risk and re-turn in an organisation.
The samples consist of companies that are engaged in a spinoff in Sweden. The companies that get spunoff are mature units, enjoying separate listing on the stock exchange. The share price collection takes place in two different time periods, namely, before spinoff and after spinoff. The pre-spinoff group is compared with the spinoff group and the post-spinoff group has two sample groups since they have been deconsolidated into two or more separate business units. The focus is on the post spinoff event since the paper should give the reader a hint of the possible actions to take after getting exposed to a spinoff. However, to determine if shareholder wealth increase I examine each individual spinoff case and compare the expected from the old conglomerate structure with the weighted av-erage return on the post-spinoff companies. I also use the latter method to uncover the change in risk the shareholder is facing through out the process.
I start the analysis by observing the time-series and to determine their behaviour. I con-tinue with my regression model which is the single-factor market model to find the beta value and the firm specific factor. I also use the market model to determine the expected return. I compare the expected return with the actual return. Thus, I can from the model determine if the real return is above expected return, and determine if a spinoff is beneficial for the shareholders. I use one year periods since I want the expectations on spinoff to have large weight in the risk measurement.
The core of the thesis is to link the effect of specialization which happens in a spinoff with the risk and return. Previous spinoff research by Cusatis, Miles & Woolridge (1994) has ap-proached spinoffs at an operational perspective. Thus, they examine how strategic misfit and non existing synergies in larger operations may be solved through specialization of the business units. They evaluate performance as treating spinoffs and parents as groups, and compare average performance between the groups. One part in my research also makes the
group comparison but differs since I focus on the Swedish market. A further difference is my approach to see if a spinoff process generates shareholders wealth and how such a shareholder is exposed to changes in the risk and return through out the process. Thus, specialization is to be tested to see if it is successful and to see if it might add a higher value than the expected return the old corporate structure have. Thus, my research differs from Cusatis, et al, (1994) research and their paper is the closest related paper that I have found.
1.1
Background
There have always been trends in creating a better performing company. Through out the years managers have used actions such as: Mergers, Acquisitions and Leverage-buyouts. Now it is the investors that push for spinoffs in non-focused organisations. Leveraged-buyouts and spinoff are of interest since those actions suggest that the existing corporation is being non-wealth maximizing and therefore the companies are believed to be mis- priced. Thus, those businesses that are engaged in a spinoff are believed to be undervalued (Kimberly & Harden, 2001).
The first group that took advantage of this was the managers in the organizations. The re-sult became leveraged buyouts. They financed the buyout by putting the company in heavy debt. The leverage buyout took place just because managers thought the business was un-dervalued and would benefit from being reconstructed (Kay, 1995).
However, now it is not leverage buyouts that is the mean for reconstructions, instead, the units are continued to be traded on the stock market, as can be seen in figure 1-1. The rea-son for this is the believe that the total values of the firms would be higher by deconsoli-date the business, and some reason is that the financial values becomes visible (Glassman, 1988).
In most spinoff-companies managers have payrolls largely based on the performance of the company, and these incentives are directly related to the increase of the value in the corpo-ration. These incentives narrow the gap between the managers and the investors in the sense of how to conduct business and generate growth (Wang, 2005).
Nevertheless Mueller (2003) describes the complexity between the different types of own-ers and managown-ers. Example is the principal-agent problem and to what level managown-ers should get incentives to carry out the best for the shareholders and the firm.
With good planning a spinoff can create a better- and more focused- unit. Concentrate re-courses and also increase employees’ commitment to the company. The difficult part is to convince the management to choose a riskier career that might be in a spinoff. In general this is handled with generous salaries and other strong incentives. The risk is general related in finding the business identity for the spinoff. That can be one reason that spinoffs are mostly driven by the shareholders and not by the managers (Bowne review, 1999).
1.1.1
Historical backgroundDifferent methods have been used for creating successful companies and to create returns to their shareholders. The incentives have in most cases been the same, namely to add value to the company.
In the 20s – 70s, a wave of mergers and acquisitions started. The idea was to go for diversi-fication, reducing the risk, and to find financial synergies in the business (Kay, 1995). A
merger were successful in those cases when the merger were complementary, namely, a horizontal merger. The result was increased market power. But sadly the M&A could often be related to managers that wanted to satisfy their own thrill. It was harder to motivate managers to scale down a business rather than deconsolidate the business (Kay, 1995). In the 80s, buyouts became popular. It was often the managers who bought the company. They financed the buyout with heavy borrowing, this is also known as a leverage buyout. In this era, business men started to talk about the “core business” and “sticking to the knit-ting” which refers to specialization. The leverage buyouts led to extensive monitoring and more advance accounting methods. It was due to the banks requirement of a broader over-view of the businesses (Kay, 1995).
In the 90s to the present, diversification within the corporation is not longer trendy. It is the competitive advantage the investors seek for in their investment relative to other in-vestments. The competitive advantage can also be the item a corporation might have that adds value, creates cash flow and increase the return to the shareholders. Depending on the circumstances the competitive advantage does not yields a sure return. The competitive ad-vantage is always relative and it can for example be in: profit, dividends or cash flow (Kay, 1995). “Competitive advantage is a description of today and tomorrow, not of yesterday” (Kay, 1995, page 202). Since the level of diversification can be chosen by the investors he or she can diversify by holding different assets rather than seeking for diversification in the single company, also known as portfolio diversification.
Since there have been trends in corporate actions one can start question if those actions are really adding value to the shareholders or if those actions just are carried out for individual or specific reasons. If a certain method would be the best method then it would make no sense of continuing making different reconstructions. Therefore one can assume that as long as it comes up new ways of reconstructing organisations the past methods have not been ultimate methods. For that reason I want to se if this latest trend can be here to stay, namely, how profitable is it really for the shareholders and can the spinoff-method be a healthy way of reconstruct the company.
This latest trend; spinoffs, may be a fusion of creating a more efficient organisation and thus may be profitable for the shareholders and be a method which is here to stay. Maybe this makes a trend to become a rule and this is why I am curious to examine this latest re-constructing trend.
1.2
The situation during the study
Specialization has been the theme in recent years among private equity firms and hedge funds. They tend to target inefficient companies which are believed to be mispriced with the aim to turn them into efficient ones, and sometimes they are using spinoffs as a mean for achieving their goals. Bureaucracy is not favoured and therefore investors seek slow moving corporations which are believed to have divisions suffering being a part of a big corporation (Glassman, 1988).
The aim with a spinoff is to show the so called hidden values. The change is aimed to bring the corporate structure and its financial values visible for possible investors. Enable the in-vestors to easily calculate the value on the business divisions, and therefore counting on an appreciation in the share price when these values are becoming visible (Blecher, 2006).
The latest solution in showing hidden values is to make a spinoff of that business division which is believed to be a better performer by being of its own rather than if staying in a large corporation. A spinoff results in a new company, such as Huskvarna, which can be seen in figure 1-1, that is traded on the secondary market along with the parent company (Amcoff, 2005).
Electrolux Electrolux
Huskvarna
Figure 1-1 Spinoff illustration
The spinoff change the structure as can be seen in figure 1-1 and the strategically operation. The intention and the motive can be found in the belief that the new structure of the two companies are better performers than the old combined structure, and thus generate share-holders wealth.
1.3
Problem and Purpose
Articles in Affarsvarlden (Blecher, 2006) and Dagens Industri (Öhrn, 2006) have discussed spinoffs. These articles have made me interested in the subject as well as laid the early foundations of the paper. However, the drawback in these articles is that they discuss the returns but not the risk the shareholders are facing. Thus, biased measures can be assumed to be present in terms of relative return.
An other Dagens Industri article (Lans, 2006) has pointed out the number of shareholders it affects. In the case when Electrolux did a spinoff of Huskvarna it affected approximately 65 000 shareholders. Thus, a spinoff is very interesting in a shareholder perspective.
A spinoff scenario can be evaluated from different perspectives but I want to stress the possible advantage of deconsolidate a corporation, and the affect it has on the stock market and its shareholders in terms of risk and return. Thus, the problem is if it really adds any value to the shareholders or not.
My comparison takes time in pre- and spinoff scenario but is focused on the post-spinoff period. The horizon is the short and medium term (< 1year), and the comparison will also in some cases refer to the OMX SPI index which is used as a benchmark.
My intention is to find answers to the following: • What triggers a spinoff?
• Who is the best performer after a deconsolidation, the spinoff or the parent? • Does specialization yield a higher risk after spinoffs?
• Does a deconsolidation yield a higher return after spinoffs?
Data is collected from 17 pre-spinoff companies and after the spinoff a total of 34 compa-nies are present. Share price data and the modelling of the share price data is the essential part of this paper.
1.4
Previous research
There are some articles discussing the concepts of deconsolidation but there are few theo-ries discussing the topic of spinoffs. I have found papers discussing spinoff which are the papers by Glassman (1988), Kimberly & Harden (2001) and Cusatis, Miles & Woolridge (1994). They discuss spinoffs but they differ from this paper. Hence, I have not found any papers written regarding the risk and returns of spinoffs in the short and medium term and if it increase shareholder wealth. My paper approaches the case spinoffs from a different perspective as such it can be considered to contribute to existing literature.
Cusatis, et al, (1994) discuss, as mentioned, the operative performance in spinoffs. They also make average performance comparisons, and they concluded that both the spinoff and the parent group outperform the market. Thus, I want to test if this is also the case on the Swedish market.
Kimberly & Harden (2001) discuss spinoffs against carve-outs and to what level ownership shifts. Thus, their paper is not direct related to my research rather I suggest it as further reading.
Glassman (1988) discuss level of bureaucracy in larger corporations and how it can be re-duced through spinoffs. He also discusses management incentives and initiative. Hence, I also suggest this paper as a further reading.
The above mentioned papers are not direct related to my paper but they provide a back-ground of spinoffs. However, I got inspiration from them in organizational issues such as management incentives and bureaucrats surrounding larger organizations.
1.5
Outline of the study
In chapter two I present the theoretical framework which includes cost and efficiency, portfolio theory, the capital asset pricing model and asymmetric information. In chapter three one can find the methodology were I present my regression model and consequently chapter four is the empirical results. Chapter five presents the analyses of the spinoffs and in chapter six one can find the conclusion. In chapter seven one will find suggestions to further studies.
1.6
Limitations
When choosing companies no consideration has been taken to sectors or industries, there-fore some sectors and industries may be over represented, and thus the results may be bi-ased and skewed. The size of the sample, 17 pre-spinoff companies becomes 34 post-spinoff companies can reduce the power since it is a small sample group. In some shares, on certain days, no trading has taken place, and in those cases the series has been adjusted to previous closing price. Further, four companies are having a smaller time-span (< 1 year) in post-spinoff, and hence reduce the power of the test since the beta has to be calculated over fewer trading days. The risk-free rate may cause some misspecification I use the mean rate between 1998 to 2005 and is due to the wide time-range of spinoffs.
2 Theoretical
Framework
This chapter presents the theory regarding efficiency, well known valuation methods, ideas behind corporate success, and perspective on diversification. The theory’s will be analysed along with the empirical findings and presented the analysis chapter.
2.1
Cost and Efficiency
To know the dynamics behind growth and to grasp the valuation methods of corporations, one needs to understand the basics of corporate success. Such basics come from competi-tive corporate advantage. In a free market it is suggested that competition in the long run forces the price to the same level as of the costs to produce it, namely price should equals marginal cost. Thus, profits are driven to zero.
However, if a company has a competitive corporate advantage in relative terms the firm can charge a price which is higher than the cost for production, and thus make a profit. Competitive corporate advantage is a relative measure and can for example be: low produc-tion cost, good customer service, good quality products etc. The basic dynamics comes from the ability to deal with costs and continuously improving the efficiency in the corpo-ration, this improvement is good for most stakeholders. The owners’ interest concerns to what level the competitive advantage adds value to the business and how it can be main-tained and increased.
Efficiency can be divided into two different forms, namely allocate and informational effi-ciency. Allocate efficiency is concerned with the distribution of the firms’ resources. When a company enjoys maximum allocate efficiency they use the resources in the most efficient way. Thus, the aim for the firm should be to strive for maximum usage of resources, at such stage owners can be confident that the firms’ resources are used in an optimal way (Connolly & Munro, 1999).
Informational efficiency in the market is regarding the information available at a certain price level. Information efficiency is the pace and the accuracy that the information is re-flected in the stock prices on the market. This type of efficiency is discussed by Fama (1965) in the Efficient Market Hypothesis (EMH). EMH deals with the level of efficiency that exists on the stock market, and how stock prices are adjusted to new information. The three forms discussed are: strong-, semi- strong and weak forms of informational efficiency (Shleifer, 2000).
However, no new information is presented in a spinoff regarding the assets other than the cash flow will be distributed different. The company presents information that they will do a structural change, and deconsolidated their business in two or possible more companies. Therefore the EMH will not be discussed any further in this paper and the focus will rather be on allocate efficiency (Brunnermeier, 2001).
A spinoff can be seen as a confess that previous company structure were not allocate effi-cient, and therefore the company can gain from spinoff their non core business, and hence make every effort for allocate improvement (Brunnermeier, 2001).
Reconstructing an organization and downsizing it through a spinoff has becomes a power-ful tool of fighting bureaucracy. It can be rewarding for the stockholders since size tends to raise inefficiency. Bureaucracy makes poor decisions because of the centralization in deci-sion making. Difficulties can be to focus the business units, and it can increase the time for
making a decision. By reducing the bureaucracy in the company the management focus im-proves, the time for decision making shortens, and this increase the incentives for initia-tive, innovation and the entrepreneurial spirit in the company (Glassman, 1998).
The redistribution of capital and resources can increase moral and the incentives for man-agers. Further incentives come from moving them away from bureaucracy as they becom-ing a part of a smaller independent public listed company. Value creatbecom-ing program can be launched for securing hard work and the management can be directly compensated by price appreciation for the value they are able to create. This can sharpen management focus as well as create faster decision making (Glassman, 1998).
A smaller corporation makes the financial structure and the financial performance easier to grasp for investors. Analysts often have problem to understand were capital is located in large diversified corporations (Glassman, 1998).
Efficiency requires management of the firm to deal effectively and quickly with activities in the firm. In a spinoff the organization gets smaller, this can lead to a faster information flow within the firm, and with a faster flow comes possibilities for faster decision making. As long as the management have good incentives to carry out the firms and the sharehold-ers best interest the new firm structure can yield higher returns. With this change the firm may ad a competitive advantage namely managerial-efficiency and an increase in their total efficiency (Casson, 2001).
Porter (1980) discussed five competitive forces, and named them as threat of entry, threat of substitution, bargaining power of suppliers and buyers, and rivalry among competitors. These forces he said determine the long term profitability of the firm and determine the value of the firm. It is costly and time consuming to determine these factors, and they must be searched by using an efficient procedure. It is on the information obtained that manag-ers base their decision, and from these decisions the investments should create growth in the company and increase shareholders wealth (Casson, 2001).
A firm’s core strategy has many complex factors and it is individual for each firm. For cre-ating higher profits the firm can go for lower costs, charge higher prices or increase the to-tal sales volume. These adjustments can be obtained from; focus, differentiation, and cost advantage (Casson, 2001).
• Focus, a firm can gain advantage by concentrating on a particular group or cus-tomer. This can lead to a cost leadership with more special knowledge given to the customer (Casson, 2001).
• Differentiation, by innovating and maintain differentiation the firms products can lead to stay a step ahead of their competitors. A buyer is most likely to stick to a product if it is differentiated and hence there are long run profits to be made (Cas-son, 2001).
• Cost advantage, achieve lower cost on their final products, possible to achieve when cutting production and decision leads, and thus increase the efficiency. The payoff of increase in allocate efficiency can cut the overall costs (Casson, 2001). One can read in chapter 1.1 that spinoffs are often driven by shareholders who have identi-fied a potential gain to deconsolidate. The initial monitoring cost is then carried by the in-vestors and not directly carried out by the company (Casson, 2001).
If a spinoff increases the competitive advantage in the firms’ strategy, the spinoff can and should be made since an allocate improvement is an opportunity (Houthakker & William-son, 1996).
2.2
Portfolio theory
Markovitz (1952) is the founder of the mean and variance analysis. He explains how an in-vestor should chose assets if the inin-vestor is concerned about the mean and variance. The relation between the mean and variance is now widely applied in modern financial theory.
Return
Figure 2-1 Capital Market Line combined with Markovitz efficiency frontier
In simple portfolio theory there are three financial assets: cash, bonds, and shares. Depend-ing on the mix of these three one can move along the Capital Market Line, and thus choose the preferred risk in the portfolio. An investor which is only concerned about the system-atic risk and return will choose a portfolio mix which is tangent to the curved line as can be seen in figure 2-1. This curved line can be seen as the efficiency frontier (also to be called The Markovitz Efficiency Frontier), and offers the highest possible return for a given level of risk. This point is also called the tangency portfolio i.e. it says having the best mix of stocks, bonds, and cash. Depending on the willingness to be exposure for risk the investor moves along the Capital Market Line. (Campbell & Viceira, 2002).
According to the mean and variance analysis the investor can only beat the market if he or she bear more systematic risk than the market. In the case of a spinoff the investor receive a new listed share which has no past data that can be used to predict the expected return and the level of systematic risk. This place the portfolio in uncertainty in terms of expected returns and risk. But by observing other companies that have been in the same situation data can be collected from those and be used as an approximation (Luenberger, 1998). If the investor invests at the optimal bundle of securities the investor will hold the efficient portfolio, namely, the portfolio which is tangent to the efficiency frontier. This will maxi-mise the return at a given level of risk. Depending on preferences the investor holds differ-ent amount of securities, and thus can be either above or below the optimal point (Luen-berger, 1998).
Because different attributes of different investors, there is seldom just one security which deliver the exact expectations and fulfils the exact criteria’s for each investor. Since the in-vestor seeks the optimal bundle it is likely that he or she will mix different securities, and so it matches the preferences. This becomes his or her portfolio (Houthakker & Williamson, 1996).
Total risk Capital Market Line
Markovitz efficiency fron-tier happens where the Capital Market line touch the efficiency frontier. It is the optimal bundle of in-vestment for a given level of risk (Houthakker & Williamson, 1996, page 152).
If an investor has a bundle of securities that moves exactly as the business cycle, an oppor-tunity might arise to add another security to the portfolio, making the portfolio more sta-bile, and hence yield a more stabile return. The risk averse investors are likely to buy such less correlated security to stabilize the return. The risk averse investor will never take a risk without being rewarded for obtaining that risk. The investor should not only focus on the single volatility of one security, rather the focus should be on the risk in the portfolio (Houthakker & Williamson, 1996).
If a share adds volatility to the portfolio it is systematic risk and then the security is corre-lated in the same direction as the market risk. The systematic risk stands for approximately one quarter of the risk whilst non market risk stands for the rest1. By calculating the beta
one can determine the level on systematic risk to be added to the portfolio (Mandell & O’brien, 1990).
One can argue that the informed investor is aware of the risk in the portfolio so the choice stands between the parent company and the spinoff company, if not holding both. Thus, it can become a trade-off in which to keep. The systematic risk is important in this case be-cause it is the risk which will be added to the portfolio and it will affect the return. The in-vestor should focus on what kind of risk he is willing to accept. The spinoff case will lead to expectations regarding volatility and returns. Going for active stock picking one can move away from the passive market portfolio, and increase the volatility as well as the re-turn in the portfolio (Houthakker & Williamson, 1996).
2.3
Capital Asset Pricing Model (CAPM)
There are numerous valuation models aiming at predicting possible future returns. One of the most popular valuation models is CAPM. The CAPM was first constructed by Sharpe, Lintner and Mossin in the 60th, and the model consider the relation between risk and
re-turn. Markovitz mean and variance theorem from 1952 now gets a widely applicable for-mula. The core principle of the model is the benefit from diversification and the distinction between unsystematic and systematic risk. By combining different assets which have differ-ent risks, one can achieve higher respective lower returns. The model helps the investor to calculate the expected return through applying the CAPM formula (Houthakker & William-son, 1996).
Depending on the risk free rate, the beta, and the market return one can find the expected return for a specific share. One can combine the different expected returns from cash, bonds, and stocks and get a portfolio which has the same pattern as the security market line, and thus reach optimal portfolio and approach the efficiency frontier. Still the idea from portfolio theory is considered in terms of diversification and efficiency for reaching high returns. The idea to combine several stocks i.e. to diversify is to minimize the volatility of the portfolio and get a return pattern which mimics the security market line (Houthakker & Williamson, 1996).
2.3.1
AssumptionsThe Capital Asset Pricing Model has quite a few assumptions that need to be fulfilled for being applicable on a stock. The CAPM is preferably used on stocks whilst arbitrage
ods are used for calculating pricing on other securities. The CAPMs’ central assumptions are:
• The market is dominated by risk averse investors who seek to stabilize their returns. • Investors have same expectations regarding the return in each individual stock. • Investors have same expectations about risk (beta) in individual stocks.
• Investors assume that the market processes the information efficient. • The real interest rate is fixed over the specific investment horizon.
• Lending and borrowing can be carried out at no risk, namely a risk-free rate is pre-sent.
(Houthakker & Williamson, 1996).
2.3.2
The processIf calculating the return of a specific stock one needs to use the equation provided by the Security Market Line, SML. Given the risk-free interest rate (Rf), expected return on market
portfolio (Rm) and the beta (β) one can calculate the expected return (Ei) on the individual stock. By knowing the expected rate of return one can apply it on historical share price data and test the accuracy in the model (Houthakker & Williamson, 1996).
• Ei = Rf + βi ( Rm – Rf )
Formula 2-1 Security Market Line
• Ei = ( P1 – P0 )/ P0
Formula 2-2 Return formula
The stage of using the Capital Asset Pricing Model is to know the required rate of return on a security and to calculate the price at which the share should be traded. When using CAPM one needs to obtain the beta which can be calculated using various econometric programs or a spreadsheet. Further, to determine the risk free rate one can use the gov-ernment bond or treasury security (Houthakker & Williamson, 1996).
One can notice that the most vital part in the model is the beta which measures systematic risk and strongly affect the outcome of the model. The total risk however can be defined as the sum of the systematic risk plus the sum of the unsystematic risk. Unsystematic risk can only be reduced through diversification. The beta measures how the stock is correlated with the market (Houthakker & Williamson, 1996).
2.3.3
CAPM and the single-factor market modelA variant of CAPM is the single-factor CAPM model which in turn is a special case of the single-factor market model. Their slopes (betas) are the same but the market model takes into account a firm specific factor whilst the normal CAPM simply assumes the firm-specific factor is zero. CAPM assumes the firm firm-specific factor is zero because of the as-sumptions that the market is efficient whilst market model makes no such statement. With
the efficiency statement the single-factor CAPM model becomes the normal CAPM for-mula which can be seen in forfor-mula 2-1 (Luenberger, 1998).
The relations between the single-factor market model and CAPM’s single-factor model are: • Ei = α i + βi ( Rm ) + εt
Formula 2-3 Single-factor market model
• Ei - Rf = α i + βi ( Rm – Rf ) + εt
Formula 2-4 Single-factor CAPM
The firm specific factor can be said to take into account the mispricing in the models. However, when making estimations such as when estimating the return of the old con-glomerate structure and when comparing this return with the nominal return the new cor-porate structures have, one should rather use the single-factor market model. Thus, the market model and CAPM’s single-factor model are closely related. However, since the CAPM makes assumption that the market is efficient and the market model does not, the market model becomes more inline with the assumption that the market is inefficient which is suggested when a series moves as random walk with drift. Thus, the forecasting method to be used in this paper is the single-factor market model which is also a better model to use when highlighting the risk and return, and comparing expected return with nominal return (Luenberger, 1998).
2.3.4
Beta implicationThe beta is the same in the CAPM as in the single-factor market model. A beta can change when a firm changes it financial leverage and its capital structure. However, such shift should not affect the firm value and thus it should not be possible to affect the value of the firm by change the capital structure. This holds true in a world without taxes. However, since that is not the case one can assume that firms are adopting appropriate tax strategies within their organisation and thus a tax strategy change should not be the driving force for a spinoff. However, if there is no change in tax strategy the value of the spinoff company and the parent company should not exceed the value of the old conglomerate structure. Al-though the beta have changed it should not lead to the new structure outperform the old one. If the aggregate beta a rise this suggest that the firm have increased its debt since the shareholders require higher return on levered equity (Brealey & Myers, 1991).
Although the beta can take various values and the market risk has the value of 1 it is not common to observe betas over the long time that are very close to zero or even below. If negative betas are observed it is suggested by CAPM that the return should not exceed the risk-free rate. A further disadvantage with the beta is it does not incorporate new informa-tion (Luenberger, 1998).
2.4
Asymmetric Information
It exists an advantage for the investor to obtain information before others. This informa-tion is valuable and costly for investors to obtain, and since there is good value in provid-ing information it is also likely that the costs of doprovid-ing so decreases. Thus, the market
ap-proaches information efficiency. This suggests that in a highly information-efficient market it is also very difficult outperforming it (Houthakker & Williamson, 1996).
When the market is highly informational efficient new information will affect the share price rapidly. As the case of a spinoff, when the market gets the new information that a company is going to make a spinoff the share price has often reacted positively. The Swed-ish security company Securitas announced a spinoff in Feb 2006, and on the day of the an-nouncement the share price rose by 13%. This may imply that there is a case of asymmetric information between the market and the spinning companies. As driven by shareholders, the very idea of spinoff suggests that there is no asymmetric information between share-holders and managers as they agree about the structural change. Rather, asymmetry seems to exist in the market and thus the sharp reaction as the Securitas case above. The interest-ing thinterest-ing is if this structural change will lead to constant higher return for either the parent company or the spinoff company. If there is evidence of anything in either direction, then the reaction of a spinoff could even be sharper (Houthakker & Williamson, 1996).
By spinning off the units that is not a part of the core business it takes into account the analysts inability of evaluating conglomerate structures. With a spinoff the units become separately traded shares and the asymmetry or inefficiency in evaluating them fade away. Conglomerate structures are often complex, and the resources can be misallocated and this can cause disagreement among operating managers as well as misjudgement among inves-tors. In this case the share can be seen as a conveyor of information and the valuation of that information is reflected in the share price. Thus, positive information can be predicted to result in future relatively higher returns (Zhang, 2006).
3 Methodology
Below one can find a detailed description of the method which is used in this paper as well as a presentation of the standardized figures which are used.
In order to determine beta I have monitored the time-series of the stocks. Through E-views I have found out that the series contains unit-root, at 5% level of significance. A treat of such a series that contain a unit root is to take the first difference of the series and only focus on the day-to-day return, meaning the percentage changes. I continue with the re-gression model, and my model is the single-factor market model which focuses on risk and return. Thus, in my market model the expected return depends on the market return, the beta and a firm-specific factor. I run the regression model on each single firm.
This firm-specific factor is a measure to what extent the security is mispriced. If the firm specific factor is positive then the stock is performing better than it should and if it is nega-tive it performs worse than it should. Thus, if the firm specific factor is zero the stock per-forms as it should, and this is the assumption in CAPM. CAPM assumes the firm specific factor is zero because the model assumes that the market is efficient and such assumption put pressure on the CAPM model. However, when using the single-factor market model no statement on market efficiency is drawn (Luenberger, 1998).
CAPM’s single-factor model is closely related to the single-factor market model as can be seen in previous chapter. The single-factor market model is suitable when making risk and return analysis and when comparing expected return with nominal return. As such the model is suitable for this paper (Luenberger, 1998).
From my regression model I obtain the beta, the firm specific factor and I also use the model for calculating the expected return of the old conglomerate structure. Thus, the aim is to uncover the expected return the old conglomerate structure have according to its beta, and to compare the expected return with the nominal return from the new corporate struc-tures. Thus, to see if the aggregate weighted nominal return the separate units have is better than the expected return of the old conglomerate structure. As such, determine if share-holders wealth increase in a spinoff.
3.1
The regression model
The key element of the single-factor market model is the β (beta) measuring the systematic risk of the individual stock. The beta is obtained from past data since it is told that the best measurement of the beta is its past value since high volatility is followed by high volatility and low followed by low volatility (Houthakker & Williamson, 1996).
When calculating the beta one usually deals with non-stationary time-series data which can appear to be either deterministic or stochastic. Depending if the series is deterministic or stochastic the series needs different treating for making it stationary, and able to get the beta value (Enders, 2004).
In statistics, a stock shows evidence of moving as a random walk with drift. The forecast-ing of such a series is impossible. However, a random walk with drift appears as; the future value is a function of intercept plus the past value with a shock (Enders, 2004).
Formula 3-1 Random walk with drift
• Yt = Yt-1 + εt
Formula 3-2 Pure random walk
In this paper I have eliminated the presents of a time value in the series since I have only cared about the returns, namely, I have used the percentage change from day-to-day. This has made the series stationary and I have excluded the possibility of a unit root which oth-erwise might cause biased results and spurious regression. The random walk model be-comes linear with some random fluctuations around its own mean value. So the dependent variable is the share price which is the sum of its value of yesterday plus a random noise. From such series I obtain the beta. This is the same as if I obtain the returns from day-to-day basis and simply use the return formula 2-2. Such transformation is made on all avail-able data. As a notice, the Random Walk model suggest a weak form of EMH (Houthakker & Williamson, 1996).
The specific beta calculation is made from the formulas below, and this method has been used in few cases, namely in those cases where there have been to few observations to run a regression on. There essential now is to get the Covariance and Variance since these are the values needed for calculating the beta in the spreadsheet. This is to be used for compa-nies for which values are missing.
• cov = (X,Y) = E((X – µ)(Y – ν))
Formula 3-3 Covariance
• var(X) = E((X – µ) 2)
Formula 3-4 Variance
• Betai = Cov ( rm – rs ) / Var ( rm )
Formula 3-5 Beta
I continue to run the single-factor market model on every firm separately, that is time series regression to obtain the firm specific factor (α firm) and beta (β firm). My regression model is
the following, and based on the formula 2-3: • Efirm at t = α firm + βfirm ( Rmt ) + εt
As such, the dependent variable depends on the firm specific factor, its correlation with the market return (Rmt) and an error term (εt).
3.1.1
Forecasting with the single-factor market modelAfter processing the data, I have used the single-factor market model as a model for sug-gestions on future prices to the pre-parent companies to determine what the returns would be if a spinoff would not have been carried out. The model becomes:
As such, if the old conglomerate structure would not be deconsolidated its return would depend on its beta, the market return after the spinoff takes place and its firm specific fac-tor. Thus, the assumption is that its beta and firm specific factor does not change between the periods. Due to the assumption that nothing have happened to the company as the spinoff has not taken place. Hence, I estimate the return of the old conglomerate structure and I compare this expected return with the nominal return the parent companies and spinoff companies actually yields. Thus, I determine if the spinoff increase shareholders wealth.
3.2
Data collection
To conduct my research I have collected secondary data. The samples are collected from the Swedish Stock Exchange All Share Index. The groups are formed to be homogenous, and for fitting in a group the observations need to fulfil a certain criteria, namely if a corpo-ration is either a spinoff or a parent.
In the cases were there have been both A-shares and B-shares I have collected the data from the B-share, and choose the data adjusted to dividends and splits. The purpose of the data processing is to confirm or disconfirm if there is some group that outperforms the other group.
First, I have collected the share price data one year before the spinoff to be able to com-pare how the risk has been changing before the spinoff with after the spinoff. The period of one year has been best to use since it does take the expectations into account about the spinoff. Thus, if one assume that a spinoff is going to happen it is most likely that the stock market has positive reactions and the beta value may be high according to those expecta-tions, and the other way if the spinoff is assumed to fail.
Secondly, I have collected share price data after the spinoff in both the parent company and the spinoff company. Limitation in time is till one year after the spinoff, and it is due to the same reason as explained above, namely, expectations of the spinoff has a greater af-fection of the risk and return. However, there are four exceptions which have shorter time periods in the post-spinoff scenario.
3.2.1
Risk free rate presentationThe risk free rate can be obtained from the Swedish government bond, and in this paper the average value between 1998 to 2005 is used. I have used the 2 year government bond as a benchmark for the risk free interest rate. The Swedish bond has been chosen since the companies in the sample are traded on the Swedish stock exchange, and thus fit geography. The two year maturity has been selected from the view of an alternative short and medium term investment. Start year has been 1998, and then annually collected at the end of each year till 2005 (Riksbanken).
Period Average annual risk-free rate
1998 4,4522 1999 3,9504 2000 4,9047 2001 4,2724 2002 4,6295 2003 3,4987 2004 2,8037
2005 2,3311
Table 3-1 Swedish government bond, annual risk-free rate
• Rf = (Σ 8 annually choosen 2 year maturity bonds) / 8
The above formula gives the average interest rate on a 2 year Swedish government bond, and gives the result of 3.86% which is the risk-free rate to be used in this paper.
3.2.2
Market rate of returnI relax the return on the market in that sense that I collect the start date of index as Jan 1, 1998, end date is taken as of Dec 31, 2005. Calculation has been done in the following way (OMX group).
OMX SPI 1998-01-02: 177.71 OMX SPI 2005-12-30: 302.91 • Rm = (P1 – P0) / P0 = ( 302.91 – 177.71 ) / 177.71 = 0.70452
• 1+0.70452 ^ (1/8) = 1.06893
The market rate of return is 6.893%. Such market return is indeed low and over a longer time horizon one can expect a higher market return. To get the risk premium one take the market return minus the risk-free rate which gives a risk premium of 3,03% for accepting the market risk.
3.3
Validity
The validity of this research is much depending on the power of the test. In this paper the limitations is first and foremost due to the sample collection which is narrow in the sense of geography and maybe biased towards a certain sector. It would be better to have a larger sample group. The number of observations in the samples put further constraint when cal-culating betas. Thus, betas observed in this paper should not be assumed to be the same in the long run.
A unit root test has not been applicable in E-views on those stocks that have many days which no trade takes place, in total there are 4 such cases, and those series have also been to short to run in E-views, as such, the beta calculation are carried out in Excel. However, this is only in the post-spinoff scenario, as such, it does not affect any forecasting model since the forecasting is only made on the pre-spinoff scenario.
4 Empirical
results
In this section one can find the empirical presentation of risk and return in both the pre- and post-spinoff scenario. Further on it is a complete comparison between the sample groups. The empirical data has been processed both in E-views and further calculated in Excel.
I focus on the risk and return between the spinoff- and the parent-company and how it has changed from the old conglomerate structure and if it does add shareholders wealth. As a start point I have collected real time data, and then modeling it for the purpose of this pa-per, namely to get the beta values. In this section one can read about the findings and be-low one can find a section-wise presentation of the numbers and figures.
The series have appeared to be random walks with drift, and further found out that unit roots are present, my opinion about focusing on returns has been a correct. From my re-gression model it can be determined that the firm-specific factor is very small and the high-est firm specific factor I have found is 0,2%, as such, one can se why CAPM exclude such factor. However, the regression has been run on each company except for 4 companies which have to few observations. These ones are in the post-spinoff scenario and the beta has been calculated from an Excel spread sheet.
4.1
Pre-Spinoff
To compare pre-spinoff with the achievement after spinoff, a beta collection has been car-ried out before the spinoff scenario. The beta collection start 1 year before the spinoff date and is obtained using the single-factor market model which is my regression model. The short time period is because the expectations encounters for a greater weight in the calcula-tion of the betas. Thus determine how the beliefs are on the spinoff.
Start date End date Parent company Parent Beta Parent ret. % Omx SPI Beta
2000-05-14 2001-05-14 Hagströmer & Qviberg 0,2917 -53,36% 1
2000-09-06 2001-09-06 Kinnevik 0,6478 -41,22% 1
2001-11-05 2002-11-05 Wihl.Sonesson 0,5519 7,31% 1
2000-09-03 2001-09-03 Bergman & Beving 0,2096 14,19% 1
2002-11-20 2003-11-20 PEAB 0,2316 -11,25% 1 2003-05-28 2004-05-28 Xano Industier 0,0188 32,55% 1 1999-06-08 2000-06-08 GL Beijer 0,0713 29,15% 1 2003-11-19 2004-11-19 Poolia 0,5705 23,31% 1 2004-09-01 2005-09-01 Kinnevik 1,1944 8,13% 1 2004-06-14 2005-06-14 Gunnebo 0,7982 -8,66% 1 2004-05-23 2005-05-23 Fabege 0,2655 44,16% 1 2000-06-19 2001-06-19 Perstorp 0,0601 -17,90% 1
2000-09-03 2001-09-03 Bergman & Beving 0,2096 14,19% 1
1997-05-18 1998-05-18 Getinge 0,8372 22,39% 1
1998-10-18 1999-10-18 Perstorp 0,3920 -26,91% 1
2002-12-16 2003-12-16 Ncc 0,4602 9,36% 1
1997-09-24 1998-09-24 Skanska 0,6571 7,93% 1
Table 4-1Pre-spinoff beta presentation
The sum of the betas is 7,4675 and the average beta is 0,4393. As can be observe, the par-ent companies seems to have little correlation to the index and hence the low beta values. This low indicator is indicating on low risk among the sample selection, and can be called to be defensive stocks, and such stocks reduce the systematic risk in the portfolio (Mandell
& O’brien, 1992). The low correlation may also be a sign of a high focus on the spinoff event and thus the companies are less affected by market movements. Such low beta values as the parent companies yield are not very usual, explanations for this can be the low num-ber of observations, approximately 250 under one year period.
4.2
Post-Spinoff
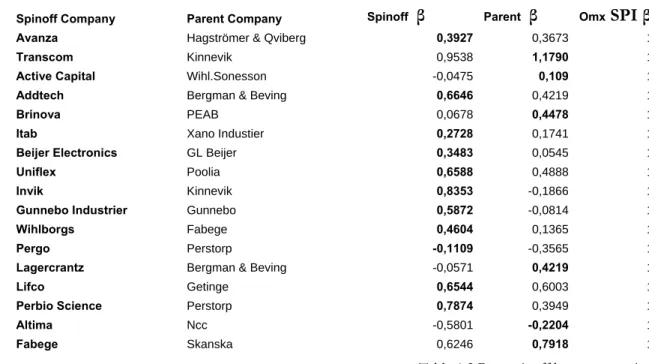
In the post-spinoff scenario when the parent company has deconsolidated the non-core business units the measurement of the two company’s betas has been obtained. The betas have been calculated from share price movements from spinoff date till one year after, and it is due to the same reason as in the pre-spinoff case, namely I want to consider the expec-tations among the shareholders.
Spinoff Company Parent Company Spinoff β Parent β Omx SPI β
Avanza Hagströmer & Qviberg 0,3927 0,3673 1
Transcom Kinnevik 0,9538 1,1790 1
Active Capital Wihl.Sonesson -0,0475 0,109 1
Addtech Bergman & Beving 0,6646 0,4219 1
Brinova PEAB 0,0678 0,4478 1
Itab Xano Industier 0,2728 0,1741 1
Beijer Electronics GL Beijer 0,3483 0,0545 1
Uniflex Poolia 0,6588 0,4888 1
Invik Kinnevik 0,8353 -0,1866 1
Gunnebo Industrier Gunnebo 0,5872 -0,0814 1
Wihlborgs Fabege 0,4604 0,1365 1
Pergo Perstorp -0,1109 -0,3565 1
Lagercrantz Bergman & Beving -0,0571 0,4219 1
Lifco Getinge 0,6544 0,6003 1
Perbio Science Perstorp 0,7874 0,3949 1
Altima Ncc -0,5801 -0,2204 1
Fabege Skanska 0,6246 0,7918 1
Table 4-2 Post-spinoff beta presentation
By observing the beta values in the table one can see that the spinoff has a larger beta value in 11 of the times comparing against the parent. If continue to sum up the betas, the spinoff column gets a higher value than the parent column. The spinoffs gets an average beta of 0,3831 whilst the parent group gets an average beta of 0,2790.
Beta diagram -0.8 -0.6 -0.4 -0.2 0 0.2 0.4 0.6 0.8 1 1.2 1.4 Hagströmer & Qviberg***
Kinnevik***Wihl.SonessonBergman & Beving
PEABXano IndustierGL Beijer Poolia KinnevikGunneboFabegePerstorp*Bergman & Beving
GetingePerstorp Ncc Skanska AvanzaTranscomActive
Capital
AddtechBrinova Itab Beijer Electronics
Unif lex Invik Gunnebo Industrier
Wihlborgs PergoLagercrantzLif co Perbio Science Altima** Fabege Companies B et a v alu e Spinoff Parent
Figure 4-1 Visualization of post-spinoff beta
By eyeballing the beta-data one can see that the spinoff and parent company seems to be closely related, which is not very strange since they were one and the same corporation be-fore spinoff took place. If focusing on the parent group one can see that even though the corporation has become smaller after they make the spinoff the beta does not necessarily becomes higher. In twelve of seventeen times the parent’s beta becomes higher. However, due to the small samples I can not say that the smaller post-parent have a larger beta than the larger pre-parent. Thus, I can not state that betas are higher in smaller corporations. The beta continues to show evidence of low correlation to the market and hence one can assume that focus is still on the effect the deconsolidation yields. Further, focus can be laid on those observations that have negative betas. Although it is rare, traditional CAPM the-ory suggests that as long as the return does not exceed the risk-free rate a negative beta can be present, although it is rare to observe (Luenberger, 1998). On the other hand does the analyse by Cloninger, Waller, Bender & Revere (2004) suggest that it is not a necessity that a security with negative beta has to perform less than the risk-free rate. Although one should be aware of the rareness of the beta values but which may be explained by the low sample selection. Although the low and negative beta values are present in these observa-tions it does not suggest that these observed stocks have constant low or negative betas, and one should not assume that the negatives betas persist over a longer time horizon since negative betas are rare and in the long run a positive market correlation is expected.
4.3
Relative return comparison, post-spinoff
In the table below one can observe the comparison between the spinoff company, parent company and the market. The returns which are market in bold are the ones that have formed the best between the three categories. The spinoff company has made the best per-formance 8 times, the market has performed the best 5 times and the parent company has performed the best 4 times in them between.
Spinoff Company Parent Company Start date End date Spinoff ret.% Parent ret.% OMX SPI ret.% Avanza H & Q 2001-05-14 2002-05-14 -18.60% -28.10% -16.84%
Transcom Kinnevik 2001-09-06 2002-09-06 -20.00% -62.91% -27.38%
Active Capital Wihl.Sonesson 2002-11-05 2003-11-05 -23.81% 3.82% 28.77% Addtech Bergman & Bev 2001-09-03 2002-09-03 -19.50% 16.25% -31.12%
Brinova PEAB 2003-11-20 2004-11-19 18.76% 44.61% 21.90%
Itab Xano Industier 2004-05-28 2005-05-27 91.67% 37.33% 18.81%
Beijer El. GL Beijer 2000-06-08 2001-06-08 -6.67% 16.36% -31.36%
Uniflex Poolia 2004-11-19 2005-11-19 39.10% 21.94% 27.05%
Invik Kinnevik 2005-09-01 2006-09-01 87.79% 32.28% 20.67%
Gunnebo Indu. Gunnebo 2005-06-14 2006-06-14 45.70% 4.76% 15.05%
Wihlborgs Fabege 2005-05-23 2006-05-23 34.50% -10.27% 26.52%
Pergo Perstorp 2001-06-19 2001-07-19 0.00% -11.76% -2.84%
Lagercrantz Bergman & Bev 2001-09-03 2002-09-03 -33.87% 16.25% -31.12%
Lifco Getinge 1998-05-18 1999-05-18 0.00% -17.90% 0.89%
Perbio Science Perstorp 1999-10-18 2000-10-18 133.33% 22.72% 32.62%
Altima Ncc 2003-12-16 2004-02-12 2.92% -4.51% 11.80%
Fabege Skanska 1998-09-24 1999-09-24 -4.10% 14.71% 35.66%
Table 4-3 Post-spinoff return comparison
If assuming to hold an equal amount invested in each category the average sum of the re-turns would be 19,25% in the spinoff category, 5,62% in the parent category and 5,83% in
the market. Notice the difference of market return used in this case, in all other compari-sons the market return is 6,89%. These group measures might be of value for an outside investor who is supposed to assign a weight on the companies if acquiring a newly spunoff corporation. Thus, the investors can by past observation assign its own weight values and incorporate the stocks in the portfolio. By keeping in mind that the average group spinoff beta was higher compared to the parent it is inline with Markowitz risk and return theorem. Namely, by getting a higher return the investor is likely to face a higher systematic risk.
4.4
Uncover the Risk and Return relation, post-spinoff
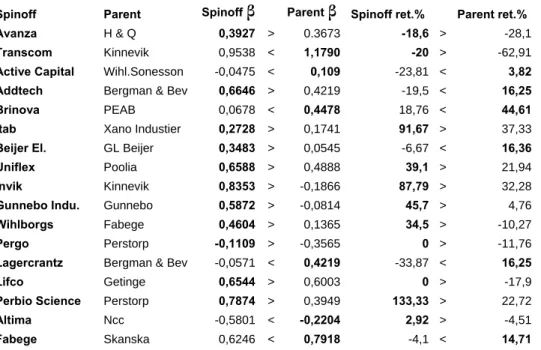
In the table below one can observe the relation between the spinoff beta and parent beta and at the same time observe the return during that time period for the index. The beta value marked in bold are the highest in each row. In this case the focus falls on the risk be-tween the spinoff and the parent, and excluding market in the comparison.
Spinoff Parent Spinoff β Parent β Spinoff ret.% Parent ret.% OMX SPI Ret. % Avanza H & Q 0,3927 > 0.3673 -18,6 > -28,1 -16.84
Transcom Kinnevik 0,9538 < 1,1790 -20 > -62,91 -27.38
Active Capital Wihl.Sonesson -0,0475 < 0,109 -23,81 < 3,82 28.77
Addtech Bergman & Bev 0,6646 > 0,4219 -19,5 < 16,25 -31.12
Brinova PEAB 0,0678 < 0,4478 18,76 < 44,61 21.90
Itab Xano Industier 0,2728 > 0,1741 91,67 > 37,33 18.81
Beijer El. GL Beijer 0,3483 > 0,0545 -6,67 < 16,36 -31.36
Uniflex Poolia 0,6588 > 0,4888 39,1 > 21,94 27.05
Invik Kinnevik 0,8353 > -0,1866 87,79 > 32,28 20.67
Gunnebo Indu. Gunnebo 0,5872 > -0,0814 45,7 > 4,76 15.05
Wihlborgs Fabege 0,4604 > 0,1365 34,5 > -10,27 26.52
Pergo Perstorp -0,1109 > -0,3565 0 > -11,76 -2.84
Lagercrantz Bergman & Bev -0,0571 < 0,4219 -33,87 < 16,25 -31.12
Lifco Getinge 0,6544 > 0,6003 0 > -17,9 0.89
Perbio Science Perstorp 0,7874 > 0,3949 133,33 > 22,72 32.62
Altima Ncc -0,5801 < -0,2204 2,92 > -4,51 11.80
Fabege Skanska 0,6246 < 0,7918 -4,1 < 14,71 35.66
Table 4-4 Post-spinoff, uncovering risk and return
In 13 of the 17 cases, namely in 76,5% of the cases the return can be said to correlate to a higher beta value, note that these measures does not assign any weight to the parent and the spinoff since this post-spinoff comparison does not take into account the old conglom-erate structure. Hence, the values are absolute values and may be of use for an investor who is about to enter a company in post-spinoff scenario. The investor has to bear a higher systematic risk for obtaining higher return, although in his or her portfolio he or she can determine which to add and how much weight it should have in the portfolio and thus af-fected the total risk in the portfolio. However, since the betas are widely distributed an in-vestor which follow past performance in corporations which have been in the same situa-tion the investor incurs great uncertainty in the portfolio. Thus, the betas are firm specific. In the cases were higher return is not explained with a higher beta some of the explanations can be found by looking at the OMX SPI return. Transcom had a better return since they were less correlated with index compared with Kinnevik. Bergman & Beving had a better return compared to Addtech since they were less correlated with OMX SPI. GL Beijer had better return since they were less correlated to OMX SPI than was Beijer EL. Altima com-pared to Ncc had no such explanation. These findings strengthen Markowitz mean and
variance theorem (1952) regarding risk and return correlation. Now 16 out of 17 are ex-plained by comparing risk and return between spinoff and parent. 94% of the observations which have higher return can now be explained with the risk and return observations. Al-tough there are few samples it is a good explanation rate.
As mentioned in chapter 4.2 negative betas are observed in the post-spinoff scenario, which are rare. However, two observations supports Cloninger, et al, (2004) analysis, namely, it is possible for a stock to perform better than the risk-free rate (3,85% in this pa-per) even though a stock has a negative beta. On the other hand six observations are in line with the CAPM theory that stocks with a negative beta should perform less than the risk free rate. The conclusion becomes that due to the small sample group it is not possible to support either theories. The observations of low and negative betas are not common and it is not very likely that it persist over longer time periods. The betas observed in the cases Pergo and Perstorp, and in Altima and Ncc are even less likely to be persistent over time since those observations are even less than a year. It is also those four companies which have not been applicable to run in E-views and instead Excel has been used.
4.5
Conglomerate vs. separate units
Since past chapters are focused on the pre- and post-spinoff scenario the previous chapters may be more interesting for an outside investor which may categorize the scenarios. How-ever, this chapter is more focused on the whole process in a spinoff which may be faced by the passive shareholder .By the latter is meant one who is a shareholder in the pre-spinoff company and eventually becomes such in the spunoff one, and without buying shares but rather being entitled to and given shares in the spunoff structure. Thus, comparison is to be made according to how risk and return have changed when a spinoff is made. This means that the comparison is made in each spinoff case between related old corporate structure against the new spinoff and parent.
If turning to relative comparison and taking the company weights which are obtained from their market capitalization one can calculate the sum (Σ) of the spinoff company and the parent company and to compare this weighted return with the expected return the old con-glomerate structure would have (which is obtained by single-factor market model), thus, one can individually check if the shareholders would gain from making a spinoff. Hence, to see if shareholder wealth increase.
Spinoff comp. Parent comp. Spin ret.% -weight Par ret.% -weight Σ post return What if return%
Avanza H&Q -18,6 0,45 -28,1 0,55 -23,83 < -5,12
Transcom Kinnevik -20 0,2 -62,91 0,8 -54,33 < -17,77 Active Capital Wihl.Sonesson -23,81 0,25 3,82 0,75 -3,09 < 15,88 Addtech Bergman & Bev -19,5 0,4 16,25 0,6 1,95 > -6,43
Brinova PEAB 18,76 0,25 44,61 0,75 38,15 > 5,01
Itab Xano Industier 91,67 0,38 37,33 0,62 57,98 > 0,49 Beijer El GL Beijer -6,67 0,5 16,36 0,5 4,84 > -2,13
Uniflex Poolia 39,1 0,2 21,94 0,8 25,37 > 15,47
Invik Kinnevik 87,79 0,08 32,28 0,92 36,72 > 24,60
Gunnebo Indu Gunnebo 45,7 0,15 4,76 0,85 10,9 < 11,92
Wihlborgs Fabege 34,5 0,2 -10,27 0,8 -1,31 < 7,20
Pergo Perstorp 0 0,3 -11,76 0,7 -8,23 < -0,23
Lagercrantz Bergman & Bev -33,87 0,4 16,25 0,6 -3,8 > -6,43
Lifco Getinge 0 0,05 -17,9 0,95 -17 < 0,75