Refining the Deep Brain Stimulation Target
within the Limbic Globus Pallidus Internus for
Tourette Syndrome
Ladan Akbarian-Tefaghi, Harith Akram, Johannes Johansson, Ludvic Zrinzo, Zinovia
Kefalopoulou, Patricia Limousin, Eileen Joyce, Marwan Hariz, Karin Wårdell and
Tom Foltynie
The self-archived version of this journal article is available at Linköping University
Institutional Repository (DiVA):
http://urn.kb.se/resolve?urn=urn:nbn:se:liu:diva-139857
N.B.: When citing this work, cite the original publication.
Akbarian-Tefaghi, L., Akram, H., Johansson, J., Zrinzo, L., Kefalopoulou, Z., Limousin, P., Joyce, E., Hariz, M., Wårdell, K., Foltynie, T., (2017), Refining the Deep Brain Stimulation Target within the Limbic Globus Pallidus Internus for Tourette Syndrome, Stereotactic and Functional Neurosurgery, 95(4), 251-258. https://doi.org/10.1159/000478273
Original publication available at:
https://doi.org/10.1159/000478273
Copyright: Karger Publishers
Title: Refining the Deep Brain Stimulation target within the Limbic
Globus Pallidus internus for Tourette syndrome
Ladan Akbarian-Tefaghi1, Harith Akram1, Johannes Johansson2, Ludvic Zrinzo1, Zinovia
Kefalopoulou1 Patricia Limousin1, Eileen Joyce1, Marwan Hariz1, Karin Wårdell2, Tom Foltynie1
1Unit of Functional Neurosurgery, Sobell Department of Motor Neuroscience, UCL Institute of
Neurology, London, UK
2Department of Biomedical Engineering, Linköping University, Sweden
Short title: Refining a Deep Brain Stimulation target in Tourette Syndrome
Keywords: Deep Brain Stimulation, Tourette Syndrome, Globus Pallidus Internus, Simulation, Modelling
Corresponding Author Professor Tom Foltynie Box 146
National Hospital for Neurology & Neurosurgery Queen Square
London UK
Abstract
Background: Deep brain stimulation (DBS) in patients with severe, refractory Tourette Syndrome (TS) has demonstrated promising but variable results thus far. The thalamus and anteromedial Globus Pallidus Internus (amGPi) have been the most commonly stimulated sites within the cortico-striato thalamic circuit, but an optimal target is yet to be elucidated.
Objectives: This study of 15 patients with long-term amGPi DBS for severe TS investigated if a specific anatomical site within the amGPi correlated with optimal clinical outcome for the measures of tics, obsessive compulsive behaviour (OCB) and mood.
Methods: Validated clinical assessments were used to measure tics, OCB, quality of life, anxiety and depression pre-DBS and at latest follow up (17-82 months). Electric field simulations were created for each patient using information on electrode location and individual stimulation parameters. A subsequent regression analysis correlated these patient-specific simulations to percentage changes in outcome measures in order to identify any significant voxels related to clinical improvement.
Results: A region within the ventral limbic GPi, specifically on the medial medullary lamina in the pallidum at the level of the AC-PC was significantly associated with improved tics but not mood or OCB outcome.
Conclusions: This study adds further support to the application of DBS in a tic-related network, though factors such as patient sample size and clinical heterogeneity remain as limitations and replication is required.
Introduction
Deep brain stimulation (DBS) for Tourette Syndrome (TS) is emerging as a safe and efficacious treatment option for patients with severe treatment refractory tics. Out of nine targets within the brain hitherto chosen for DBS, the medial thalamus and Globus Pallidus Internus (GPi) regions have been the sites most consistently reported to lead to long term beneficial effects.
Nonetheless, identification of the optimal target for chronic stimulation within a tic related cortical-subcortical basal ganglia-thalamic network is yet to be elucidated.
The anteromedial or limbic GPi (amGPi) has yielded promising results as a DBS target for TS patients not only in a number of open label case series (1)(2)(3)(4)(5) but also in a recent randomised controlled trial (6). However, even among patients receiving bilateral amGPi DBS, there is considerable variability in response raising uncertainty regarding the optimal site for electrode placement even within this region.
A potential approach to aid the identification of the optimal target within the limbic GPi in TS patients, is by comparison of the variation in clinical outcomes to patient-specific electric field (EF) simulations. The latter involves outlining the extent of current spread around the exact imaged location of DBS electrodes, taking into account stimulation parameters and individual anatomical variation, thus enabling mapping of the anatomical brain regions stimulated by DBS (7). Proof of concept of this approach has been previously demonstrated in a study that used the finite-element method to map current distribution in 5 TS patients targeted at the GPi (8).The comparison of this type of EF simulation to the long-term tic and co-morbidity improvement in larger numbers of patients should help elucidate the optimal anatomical target for electrode placement and a similar approach has been taken in patients with Parkinson’s disease (9). Our study therefore attempts to further address the feasibility of this approach by applying it in 15 patients with severe, refractory TS who have had long term follow up after bilateral amGPi DBS.
Methods
Clinical data
The patients recruited to this study remain under follow up at the National Hospital of Neurology and Neurosurgery, Queen Square, London, UK and had all received bilateral DBS to the amGPi region for severe treatment refractory TS. Only patients with both pre and post-operative MR images and long term follow up (>12 months) clinical data were included.
All patients were resistant to at least 3 different types of pharmacological therapies including dopamine blocking agents. Specific inclusion criteria included a diagnosis of stable severe refractory TS, a YGTSS score of greater than 35/55 for at least 12 months, lack of response to 3 different classes of conventional medical treatment at therapeutic doses, unsuccessful or unstable behavioural therapy outcome, co-morbid symptoms optimally treated for at least 6 months as well as compliance with surgical treatment plans or psychosocial interventions. Exclusion criteria comprised tic disorder attributed to another cause, presence of medical or psychiatric disorders that may increase the risk of procedure, or psychosocial factors impacting on postoperative care and research participation.
Our surgical procedure has been previously described (11). The process for selecting the target within the amGPi was consistent across the course of the study. The target within the amGPi was determined by direct visual inspection using a stereotactic thin slice, proton density MRI
sequence to directly visualize the pallidal anatomy (12). For the targeting we use commercially available planning software (Framelink, Medtronic, Minneapolis). On an axial slice at the level of the AC-PC line, the GPi can be divided into an anterior, middle and posterior third. The electrode was targeted to the centre of the anterior third of the GPi.
The entry point was defined at or behind the coronal suture and at a laterality such as to ensure a trajectory that would avoid sulci and the ventricular system, while maintaining an orthogonal approach towards the GPi. The exact entry and target point were subsequently modified to maintain a parenchymal trajectory whilst maximising the length of the trajectory within the
visible amGPi. An immediate postoperative stereotactic MRI with the frame still on the head verified the DBS electrode location in the anteromedial GPi. All patients received Activa PC implantable pulse generators (Medtronic, Minneapolis, MN, USA).
Clinical assessments were performed pre and post operatively with validated scoring systems consisting of the Yale Global Tic Severity scale (YGTSS) (13) and the Modified Rush Video Rating Scale (MRVRS) (14) to measure tic frequency and severity, the Gilles de la Tourette Quality of life scale (GTS-QOL) (15), the Yale Brown Obsessive Compulsive scale (Y-BOCS) for OCB outcome (16), the Beck Depression Inventory (BDI), and the State Trait Anxiety Inventory (STAI). A two-tailed t test was used to compare baseline and latest follow up (LFU) scores using SPSS version 22. The percentage difference between baseline and LFU scores were calculated (Baseline-LFU/Baseline) for each parameter. These percentage changes were then used in the subsequently described linear modelling analysis.
Creation of electric fields for patient-specific modelling
The optimal DBS parameters including frequency, voltage, pulse width and the number of active contacts were recorded for each patient.
Brain model
Pre-implantation axial MR images were co-registered with immediate post-implantation axial MR images using an open source software (3DSlicer, www.slicer.org) and the x,y and z coordinates for contacts were obtained for each patient. The coordinates for the active stimulation contacts were subsequently used in the brain and electrode model to outline the fields of stimulation.
A software tool developed in Matlab 2015a (MathWorks, USA) named ELMA (17)(8) was used to assign the electric conductivities, σ (S/m), in the models based on the voxel intensities in the T1 pre-implantation MR image sets. Images were exported as .nrrd files for reading into Matlab. Average intensities for grey matter, white matter and cerebrospinal fluid were calculated in regions of interest around the DBS target and were used to classify the voxels into these tissue types. For voxels with intensities within the middle third of the averages for two tissue types, the
conductivity values were linearly interpolated with intensity between the conductivity values for the two tissue types. The (mainly pulse width-dependent) electric conductivities of the tissue types were calculated by the weighted average between 10 and 106 Hz of the Fourier transform
of the DBS pulse shape (18) with conductivity spectra taken from a compilation by Gabriel et al (19) (20). The conductivity matrix was saved for a cuboid corresponding to the dimensions of each brain.
Electrode model
The DBS electrodes (DBS lead model 3389, Medtronic Inc., USA) with a radius of 0.635 mm, a contact length of 1.5 mm and a contact separation of 0.5 mm were modelled in Comsol
Multiphysics 5.2 (Comsol AB, Sweden) and placed in the positions indicated by the postoperative MRI relative to the above described conductivity matrix of the brain tissue.
Boundary conditions
For each patient, the active contacts were set to the corresponding electric potential, V (V) while the surrounding of the brain model was set to ground (V = 0 V). The plastic parts of the lead were set to electric insulation
(V/m) (1)
where n is the normal vector of the electrode contact surface S.The inactive contacts were set to floating potential
(2)
In case of interleaved stimulation, two separate simulations were made for the two contact sets.
Governing equation and simulations
The equation for steady currents was solved for the brain domain around the electrodes
(A/m3) (3)
using a mesh of approximately 500 000 elements and the Conjugate Gradient solver in the Cuthill McKee algorithm (CM). From the solution, the EF isolevels estimated to trigger axons with a diameter of 2 and 5 µm respectively were calculated and exported as a logic matrix with the same coordinates as the preoperative MRI set. The required isolevels were estimated based on
0 = ∇ ⋅ V n = ∇ ⋅ = ∇ ×
∫
0(A). (V/m) VdS Vσ
n 0 n(
∇)
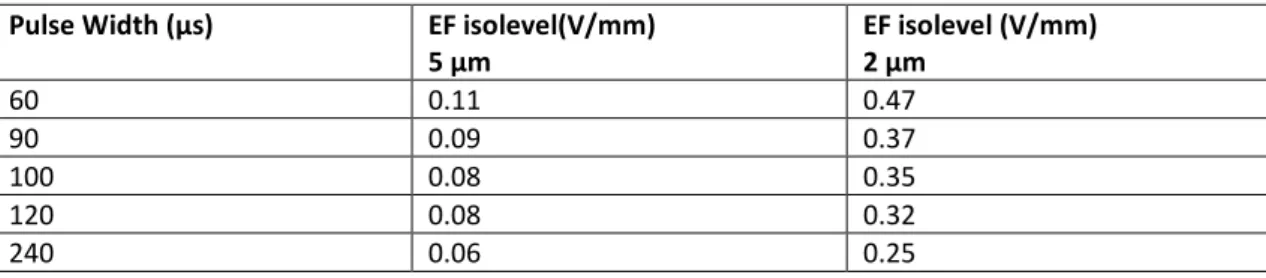
=0 ⋅ ∇ σ Vthe pulse width used for the stimulation. Based on neuron model simulations by Åström et al (21), rheobase and chronaxie were calculated to be 0.041 V/mm and 99.8 µs for 5 µm axons and 0.174 V/mm and 101.4 µs for 2 µm axons. Corresponding activation levels are given in table 1. For interleaved stimulation, the activated volume was assumed to be the union of the activated voxels in the two simulations.
(Table 1)
Each patient’s specific simulated EF or volume of tissue activated (VTA) within the whole brain T1 image was exported in Neuroimaging Informatics Technology Initiative (nifti) format.
Co-registration of nifti files to MNI space
In order to carry out the voxel based analysis, all patients’ scans were co-registered to a standard space. Pre-implantation T1 (MPRAGE) MR scans were brain extracted using BET (Brain
Extraction Tool, FSL v5.0) which deletes non-brain tissue from a whole head MRI (22). Native scans were co-registered to the MNI 152 standard-space T1-weighted average structural template image (1mm resolution) (23). This was achieved by employing linear (affine) transformation first using FLIRT (FMRIB's Linear Image Registration Tool) with 12 degrees of freedom, correlation ratio cost function and normal search (24)(25). The output from this step was then used to execute non-linear registration using FNIRT (FMRIB's Non-Linear Image Registration Tool) (26). This process produced individual native to standard (MNI space) non-linear warp fields which were then applied to the DBS tissue activation volumetric meshes acquired in order to transform all volumes to standard space. Group averages were then generated using Fslmaths.
Linear regression of voxels versus clinical outcomes
Left and right sided VTAs (in MNI space) corresponding to the 2 micrometer axon stimulation fields were combined using Fslmerge (FSL v5.0) into two 4D data files (one for each hemisphere). In each voxel, each of the VTAs was modelled as a linear combination of outcome scores within the group. A simple design contrast file was used to test the significant voxels predictive of improvement in each clinical outcome variable individually.
Nonparametric permutation inference was then carried out on each voxel using Randomise (FSL v5.0) with 5000 permutations to build up the null distribution to test against. General linear model (GLM) variables were demeaned and single group t-test with threshold-free cluster enhancement (TFCE) was used as the test statistic (27). Raw t-stat images were thresholded at α=0.05.
Results
Clinical outcomes
Fifteen patients were included in this study. All patients had undergone bilateral DBS surgery between 2009-2014. The follow up period ranged from 17-82 months. There were 12 males and 3 females who had a mean age of TS onset of 7 years (range 2-12) with the average age at surgery being 32 (range 18-49). The mean YGTSS score at baseline was 88 (range 71-98) which
improved to a mean value of 54 (range 15-97) at latest follow up. The mean reduction in YGTSS was 38.2% (95% CI 23.6-52.8) with the percentage reduction in vocal tics being 38.2% (95%CI 23.7-52.7) and motor tics was 33.2% (95%CI 20.3-46.0). The mean change in MRVRS observed was 40.5% (95% CI 22-59) and unobserved was 34.1% (95% CI 19.8-48.3) which correlated well with the changes in YGTSS. There was a statistically significant difference in YGTSS including both vocal and motor tic outcome, MRVRS, quality of life outcome as well as the co-morbidities of anxiety and depression. However, despite an overall improvement in OCB outcome, statistical significance was not reached. Further sub-group analysis, revealed that 4 patients with the most severe baseline OCB (score 24-31) showed a 38.7% (7.4-60) improvement in Y-BOCS, 5 with a moderate score (16-23) 12.3% (-20-50), whilst 6 patients with mild or subclinical OCB showed little or no improvement suggesting that the impact of DBS may be seen most in those with severe baseline OCB associated with TS. Inspection of individual patient data also revealed variability in tic outcome with 4 patients showing less than 20% YGTSS improvement, 6 experiencing 20-50% improvement and 5 over 50% improvement.
(Table 2)
Stimulation related non-serious adverse effects at last follow up reported by individual patients included weight gain, dizziness and feelings of nausea. Other effects included freezing of gait episodes with prolonged stimulation of more ventral pallidal contacts, difficulties with speech articulation and akathisia. In the majority of patients, adverse effects could be controlled by altering stimulation parameters. Most patients remained on pre-surgery medications which mostly served to address co-morbid symptoms such as depression, anxiety and OCB.
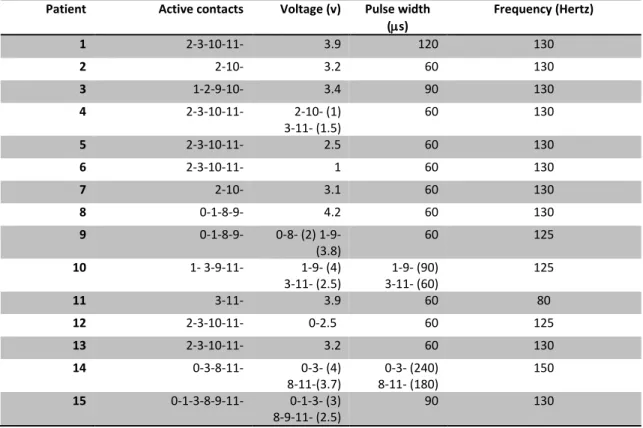
In several patients, tolerance to the DBS developed over time, necessitating progressive increases in stimulation parameters to maintain symptom control. Table 3 confirms that 12 of our patients have progressed to need double monopolar (or in one case even triple monopolar) stimulation over long-term follow up. In 7 of these patients increases in stimulation over time were required because of a relapse in tic control which led to restoration, whereas in 5 patients, progressive increases have been pursued to try and make additional improvements upon suboptimal tic control. Owing to low tolerance of increased parameter settings, 2 patients have not derived maximum benefit resulting in poorer tic control and 1 patient has switched off their DBS owing to little improvement. The evolution towards such high parameters has led to the need for repeated battery replacements and the switch to using rechargeable devices in increasing numbers of patients.
Table 3: Active contacts and parameters (voltage, pulse width and frequency) for 15 patients at time of optimal tic control.
2.Modeling of stimulation fields in patients
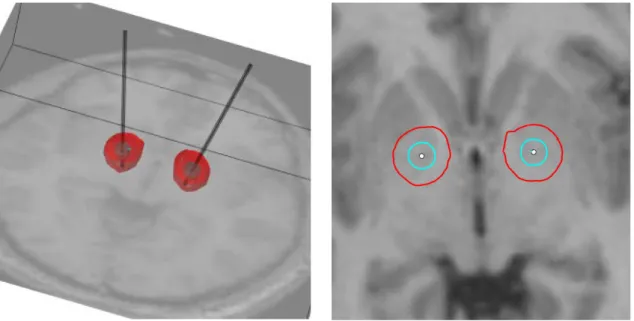
An example of the simulated stimulation fields for 1 of the 15 patients is illustrated in Figure 1. In every patient the active contact(s) lay within the amGPi or on the lamina between amGPi and am GPe. The simulations indicate that 2 µm axons exposed to stimulation lie predominantly in the GPi/GPe, whereas 5 µm axons lying medially in the internal capsule, and laterally as far as the putamen are also exposed to the effects of chronic stimulation.
(Figure 1)
3.Linear regression comparing voxels activated v clinical outcome
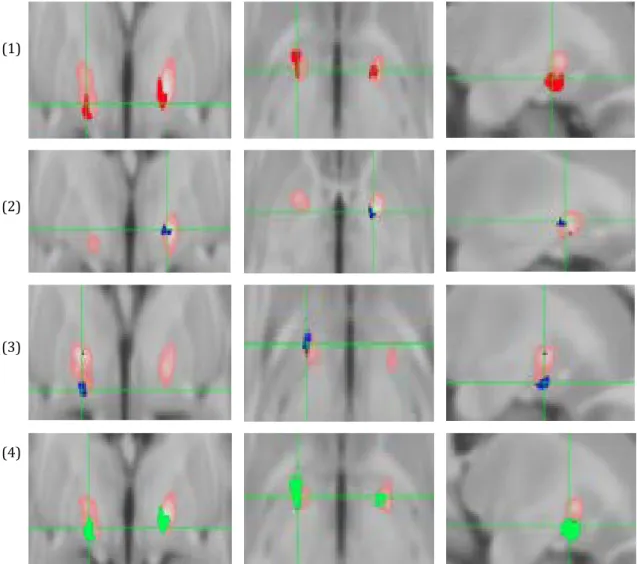
General linear modeling revealed that the voxels activated by DBS that were most significantly predictive of improvement in motor tics, vocal tics and YGTSS were located in the ventral limbic GPi. Specifically, there were three convergent clusters on the medial medullary lamina in the pallidum at the level of the AC-PC. Areas of maximum efficacy for these three outcomes along with the average VTA are shown in Figure 2. We did not find any voxels significantly associated with percentage improvement in any of the other clinical outcome measures. None of the significant clusters of voxels survived correction for multiple comparisons.
(Figure 2)
Discussion
The long-term outcome data presented here demonstrates that mean YGTSS tic improvement from baseline to latest follow up in the 15 patients included is encouraging but responses can be highly variable. This supports the search for between-patient factors, including the site of stimulation delivery to explain the variability in response. The results of our EF simulation study demonstrate that the most consistent stimulation site associated with vocal and motor tic improvement is the anteromedial limbic GPi bordering on the lamina medullaris interna between the GPi and GPe. This region was not however associated with improvement in mood or OCB outcome, suggesting that there may be some degree of separation between brain networks involved in tic generation from those involved in obsessive compulsive behavior or mood disturbance despite their frequent coexistence within patients with severe TS.
The interpretation of our results should be considered in light of potential limiting factors at various stages of the analysis which will be considered in turn. Firstly, the accuracy of clinical data was limited by the subjectivity of rating scales such as the Y-BOCS which can be highly variable between time points and influenced by patient insight and reporting. Although the change in OCB outcome did not reach statistical significance, sub-group analysis revealed that 4
patients with the most severe OCB symptoms had the greatest improvement suggesting that results may differ in a larger cohort of patients with more severe baseline OCB. The YGTSS is currently the most widely accepted measure of tic severity and reflects the level of tic control during the previous week rather than the acute snapshot of tic severity that is recorded by the MRVRS.
Secondly, the creation of simulation fields, involved the use of computer simulations that assumed an isotropic electrical conductivity of tissue and the random orientation of axons. In reality, white matter in particular is anisotropic with preferential axon directions leading to both changes in the extension of the EF isolevels and the ease at which the axons are triggered. However, previous simulations studies have shown this to be only a minor influence, compared with for instance, CSF filled cysts due to Virchow Robin spaces (28). Another parameter that is unknown is the exact distribution of axon diameters in the regions of interest; as wider diameter axons are easier to trigger, this will affect what EF isolevel is relevant for calculation of the stimulation (21). The axon model used to calculate the triggering isolevels also contains parameters other than axon diameter that could affect the ease of activation, such as internodal length.
For these reasons the isolevels for two different axon diameters are presented in this paper and were chosen from the smallest and largest simulated by Åström et al (21). An
electron-microscopy study of axon diameter by Liewald et al. (29) indicated that the median inner axon diameter in white matter axons is around 0.5 µm and the maximum inner diameter is below 5 µm in most structures. The larger outer axon diameter of 5 µm used in this study should thus be seen as the approximate upper limit though it would have been interesting to have estimates of required EF for activation of diameters smaller than 2 µm. Comparisons of EF levels with the borders of the GPi by Hemm et al indicates that an EF isolevel of 0.2 V/mm is the best fit for axon activation (30) which corresponds to an axon diameter of approximately 3.5 µm (21). It may thus be that activation of a small subset of the largest axons is sufficient for the therapeutic effect of DBS.
Apart from intrinsic uncertainties in the electric conductivities of the different tissue types, there is also a tendency for gliosis formation around the electrode lead that somewhat reduces the electric conductivity in the closest vicinity (31) the effect of which has not been included. Previous simulations by Yousif (32) and Alonso (33) however show this has little impact at chronic stimulation points as was the case in our study. Further limitations lie in MRI resolution and contrast between different tissue types which introduces some uncertainty in the tissue classification of the voxels and for neural tissue as well as a dependency from axon activation on the electric conductivity (34).
Co-registration of pre-operative and post-operative images, followed by co-registration to MNI space following the field simulations is a further potential source of error. At each stage we used whole brain data and utilized the linear and non-linear registration tools to minimize errors introduced by the co-registration process. Finally as demonstrated by the loss of significance after correction for multiple comparisons the small sample size was an important limitation. While we have included 3 times more patients than the previous study assessing EF simulations in TS, it is likely that other patient specific factors exist, such as age, symptom duration,
comorbidity, medication exposures, which all impact on the degree of tic improvement.
In the majority of patients, tic improvement translated into functional gains. However we have observed that symptom course over time can vary, with some patients tending to reach a response plateau while others deteriorate in comparison to previous follow up points, unless stimulation parameters are progressively increased, though in general such patients do not decline to baseline tic severity. These observations are supported by previous long term studies targeting the pallidum (3)(2) though whether other factors also predict long term tic outcome remains unclear.
Tic control is one important aspect of quality of life and tends to dominate the picture when first discussing the potential use of DBS in severely affected TS patients. However non-tic
co-morbidities also have a crucial impact on patient quality of life and these can become the focus of the patient’s attention once tic severity decreases. While patients continue to have significant
improvements in mood and quality of life following DBS, improvements in OCB do not reach the threshold for statistical significance, and in our imaging analyses, changes in these other
variables were not significantly related to the minor variability in the site of electrical stimulation.
In summary, we conclude that chronic high frequency stimulation, particularly in the anterior limbic GPi, is most associated with long term improved motor and vocal tic outcome. Although we plan to already learn from these data to inform future electrode targeting at this region, we acknowledge that the methods we have utilised require replication in a larger number of patients in order to improve reliability. We of course cannot conclude that amGPi DBS is superior to stimulation through electrodes targeting in other GPi regions, or the centromedian thalamus however our findings may help future targeting within the amGPi region. It can be argued that due to patient-specific factors ie differing TS patient phenotypes, there is unlikely to be one target region that will benefit all patients to the same degree. Anecdotally, we have observed several patients with optimal responses from the dorsal contacts of the electrodes lying within the amGPe. This is consistent with a previous report of efficacy of GPe DBS in TS patients (35). Therefore, collecting more information about patient co-morbidities and tic types in relation to patient specific simulations and outcomes may help to further individualise targeting.
Given the observation of tolerance emerging in some patients, the role of plasticity in tic and behaviour related networks should also be considered. Stimulation of one node in a tic related network may eventually lead to the escape of abnormal firing patterns into different networks which could partly explain the increased tolerance that some patients with DBS can develop. Understanding network changes over time in patients with DBS for TS e.g. by using functional imaging may help further understand this phenomenon of tolerance and elucidate further those networks that are involved in tic expression and their anatomical connections with relevance for future electrode targeting.
References
1. Martínez-Fernández R, Zrinzo L, Aviles-Olmos I, Hariz M, Martinez-Torres I, Joyce E, et al. Deep brain stimulation for Gilles de la Tourette syndrome: A case series targeting subregions of the globus pallidus internus. Mov Disord. 2011;26(10):1922–30.
2. Cannon E, Silburn P, Coyne T, O’Maley K, Crawford JD, Sachdev PS. Deep brain stimulation of anteromedial globus pallidus interna for severe tourette’s syndrome. Am J Psychiatry. 2012;169(8):860–6.
3. Sachdev PS, Mohan A, Cannon E, Crawford JD, Silberstein P, Cook R, et al. Deep brain stimulation of the antero-medial globus pallidus interna for Tourette syndrome. PLoS One. 2014;9(8):e104926.
4. Huasen B, McCreary R, Evans J, Potter G, Silverdale M. Cervical myelopathy secondary to Tourette’s syndrome managed by urgent deep brain stimulation. Mov Disord. 2014 Apr;29(4):452–3.
5. Smeets AYJM, Duits AA, Plantinga BR, Leentjens AFG, Oosterloo M, Visser-Vandewalle V, et al. Deep Brain Stimulation of the internal globus pallidus in refractory Tourette Syndrome. Clin Neurol Neurosurg. 2016 Mar;142:54–9.
globus pallidus stimulation for severe Tourette’s syndrome: a double-blind, randomised crossover trial. Lancet Neurol. 2015 Jun;14(6):595–605.
7. Baldermann JC, Schuller T, Huys D, Becker I, Timmermann L, Jessen F, et al. Deep Brain Stimulation for Tourette-Syndrome: A Systematic Review and Meta-Analysis. Brain Stimul. 2016;9(2):296–304.
8. Wårdell K, Diczfalusy E, Åström M. Patient-Specific Modeling and Simulation of Deep Brain Stimulation. Patient-specific Model Tomorrow’s Med. 2011;357–78.
9. Åström M, Tripoliti E, Hariz MI, Zrinzo LU, Martinez-Torres I, Limousin P, et al. Patient-specific model-based investigation of speech intelligibility and movement during deep brain stimulation. Stereotact Funct Neurosurg. 2010;88(4):224–33.
10. Åström M, Tripoliti E, Hariz MI, Zrinzo LU, Martinez-torres I, Limousin P, et al. Linköping University Post Print Patient-Specific Model-Based Investigation of Speech Intelligibility and Movement during Deep Brain Stimulation. 2010;(88):224–33.
11. Foltynie T, Zrinzo L, Martinez-Torres I, Tripoliti E, Petersen E, Holl E, et al. MRI-guided STN DBS in Parkinson’s disease without microelectrode recording: efficacy and safety. J Neurol Neurosurg Psychiatry. 2011;82(4):358–63.
12. Hirabayashi H, Tengvar M, Hariz MI. Stereotactic imaging of the pallidal target. Mov Disord. 2002;17 Suppl 3:S130-134.
13. Leckman JF, Riddle MA, Hardin MT, Ort SI, Swartz KL, Stevenson J, et al. The Yale Global Tic Severity Scale: initial testing of a clinician-rated scale of tic severity. J Am Acad Child Adolesc Psychiatry. 1989;28(4):566–73.
14. Goetz CG, Pappert EJ, Louis ED, Raman R, Leurgans S. Advantages of a modified scoring method for the Rush video-based tic rating scale. Mov Disord. 1999;14(3):502–6. 15. Cavanna AE, Schrag A, Morley D, Orth M, Robertson MM, Joyce E, et al. The Gilles de la
Tourette syndrome-quality of life scale (GTS-QOL): development and validation. Neurology. 2008 Oct;71(18):1410–6.
16. Goodman WK, Price LH, Rasmussen S a, Mazure C, Fleischmann RL, Hill CL, et al. The Yale-Brown Obsessive Compulsive Scale. I. Development, use, and reliability. [Internet]. Vol. 46, Archives of general psychiatry. 1989. p. 1006–11.
finite element modeling and simulation of deep brain stimulation. Med Biol Eng Comput [Internet]. 2009;47(1):21–8.
18. Wardell K, Zrinzo L, Hariz M, Andersson M. Patient-specific brain modelling for deep brain stimulation simulations. Int IEEE/EMBS Conf Neural Eng NER. 2013;148–51. 19. Andreuccetti D, Fossi R, Petrucci C. An Internet resource for the calculation of the
dielectric properties of body tissues in the frequency range 10 Hz - 100 GHz. In: Website at http://niremf.ifac.cnr.it/tissprop/ IFAC-CNR, Florence (Italy) [Internet]. 1997. Available from: http://niremf.ifac.cnr.it/tissprop/
20. Gabriel S, Lau RW, Gabriel C. The dielectric properties of biological tissues: II. Measurements in the frequency range 10 Hz to 20 GHz. Phys Med Biol Phys Med Biol [Internet]. 1996;41(41):2251–69. Available from: http://iopscience.iop.org/0031-9155/41/11/002
21. Åström M, Diczfalusy E, Martens H, Wårdell K. Relationship between neural activation and electric field distribution during deep brain stimulation. IEEE Trans Biomed Eng. 2015;62(2):664–72.
22. Smith SM. Fast robust automated brain extraction. Hum Brain Mapp. 2002;17(3):143–55. 23. Grabner G, Janke AL, Budge MM, Smith D, Pruessner J, Collins DL. Symmetric atlasing and
model based segmentation: an application to the hippocampus in older adults. Med Image Comput Comput Assist Interv Int Conf Med Image Comput Comput Assist Interv.
2006;9:58–66.
24. Jenkinson M, Smith S. A global optimization method for robust affine registration of brain images. Med Image Anal. 2001;5:143–56.
25. Jenkinson M, Bannister P, Brady M, Smith S. Improved optimisation for the robust and accurate linear registration and motion correction of brain images. Neuroimage. 2002;17(2):825–841.
26. Andersson JLR, Jenkinson M, Smith S. Non-linear registration aka Spatial normalisation FMRIB Technial Report TR07JA2. In Pract [Internet]. 2007;(June):22. Available from: http://fmrib.medsci.ox.ac.uk/analysis/techrep/tr07ja2/tr07ja2.pdf
27. Smith SM, Nichols TE. Threshold-free cluster enhancement: Addressing problems of smoothing, threshold dependence and localisation in cluster inference. Neuroimage.
2009;44(1):83–98.
28. Astrom M, Johansson JD, Hariz MI, Eriksson O, Wardell K. The effect of cystic cavities on deep brain stimulation in the basal ganglia: a simulation-based study. J Neural Eng. 2006 Jun;3(2):132–8.
29. Liewald D, Miller R, Logothetis N, Wagner HJ, Schüz A. Distribution of axon diameters in cortical white matter: an electron-microscopic study on three human brains and a macaque. Biol Cybern. 2014;108(5):541–57.
30. Hemm S, Mennessier G, Vayssiere N, Cif L, El Fertit H, Coubes P. Deep brain stimulation in movement disorders: stereotactic coregistration of two-dimensional electrical field modeling and magnetic resonance imaging. J Neurosurg. 2005 Dec;103(6):949–55. 31. Lungu C, Malone P, Wu T, Ghosh P, McElroy B, Zaghloul K, et al. Temporal macrodynamics
and microdynamics of the postoperative impedance at the tissue-electrode interface in deep brain stimulation patients. J Neurol Neurosurg Psychiatry [Internet].
2014;85(7):816–9.
32. Yousif N, Bayford R, Bain PG, Liu X. The peri-electrode space is a significant element of the electrode-brain interface in deep brain stimulation: a computational study. Brain Res Bull. 2007 Oct;74(5):361–8.
33. Alonso F, Hemm-Ode S, Wårdell K. Influence on Deep Brain Stimulation from Lead Design , Operating Mode and Tissue Impedance Changes - A Simulation study. Brain Disord Ther 4:169. doi:10.4172/2168-975X. 1000169
34. Hemm S, Vayssiere N, Mennessier G, Cif L, Zanca M, Ravel P, et al. Evolution of Brain Impedance in Dystonic Patients Treated by GPi Electrical Stimulation. Neuromodulation. 2004;7(2):67–75.
35. Piedimonte F, Andreani JC, Piedimonte L, Graff P, Bacaro V, Micheli F, et al. Behavioral and motor improvement after deep brain stimulation of the globus pallidus externus in a case of Tourette's syndrome. Neuromodulation. 2013 Jan-Feb;16(1):55-8.
Figure 1: Visualization of the isolevels 0.075 V/mm (red) and 0.32 V/mm (blue) assumed to trigger 5 and 2 µm axons respectively at a pulse width of 120 µs. The isolevels are overlaid on the T1-weighted images of the patient.
(1)
(2)
(3)
(4)
Figure 2: Voxels associated with significant percentage motor improvement in red (row 1), vocal improvement in blue (rows 2 and 3), YGTSS improvement in green (row 4) and average VTA in pink. First column= coronal, middle=axial and third=sagittal T1-weighted images.
Table 1: Assumed isolevels for axon activation Pulse Width (µs) EF isolevel(V/mm)
5 µm EF isolevel (V/mm) 2 µm 60 0.11 0.47 90 0.09 0.37 100 0.08 0.35 120 0.08 0.32 240 0.06 0.25
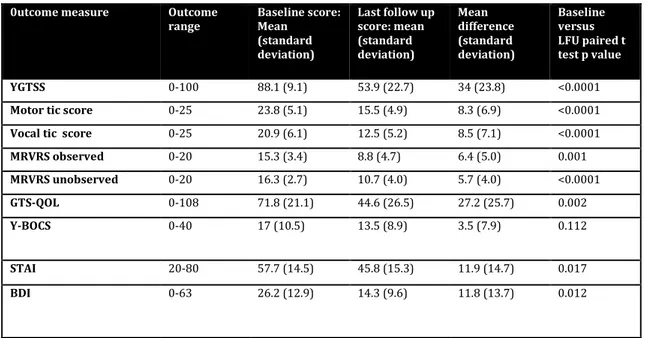
Table 2: Outcome measures at baseline and last follow up
0utcome measure Outcome
range Baseline score: Mean (standard deviation) Last follow up score: mean (standard deviation) Mean difference (standard deviation) Baseline versus LFU paired t test p value YGTSS 0-100 88.1 (9.1) 53.9 (22.7) 34 (23.8) <0.0001 Motor tic score 0-25 23.8 (5.1) 15.5 (4.9) 8.3 (6.9) <0.0001 Vocal tic score 0-25 20.9 (6.1) 12.5 (5.2) 8.5 (7.1) <0.0001 MRVRS observed 0-20 15.3 (3.4) 8.8 (4.7) 6.4 (5.0) 0.001 MRVRS unobserved 0-20 16.3 (2.7) 10.7 (4.0) 5.7 (4.0) <0.0001 GTS-QOL 0-108 71.8 (21.1) 44.6 (26.5) 27.2 (25.7) 0.002 Y-BOCS 0-40 17 (10.5) 13.5 (8.9) 3.5 (7.9) 0.112 STAI 20-80 57.7 (14.5) 45.8 (15.3) 11.9 (14.7) 0.017 BDI 0-63 26.2 (12.9) 14.3 (9.6) 11.8 (13.7) 0.012
Table 3: Active contacts and parameters (voltage, pulse width and frequency) for 15 patients at time of optimal tic control.
Patient Active contacts Voltage (v) Pulse width
(µs) Frequency (Hertz) 1 2-3-10-11- 3.9 120 130 2 2-10- 3.2 60 130 3 1-2-9-10- 3.4 90 130 4 2-3-10-11- 2-10- (1) 3-11- (1.5) 60 130 5 2-3-10-11- 2.5 60 130 6 2-3-10-11- 1 60 130 7 2-10- 3.1 60 130 8 0-1-8-9- 4.2 60 130 9 0-1-8-9- 0-8- (2) 1-9- (3.8) 60 125 10 1- 3-9-11- 1-9- (4) 3-11- (2.5) 3-11- (60) 1-9- (90) 125 11 3-11- 3.9 60 80 12 2-3-10-11- 0-2.5 60 125 13 2-3-10-11- 3.2 60 130 14 0-3-8-11- 0-3- (4) 8-11-(3.7) 8-11- (180) 0-3- (240) 150 15 0-1-3-8-9-11- 0-1-3- (3) 8-9-11- (2.5) 90 130