A study of value investment
strategies based on dividend
yield, price-to-earnings and
price-to-book ratios in Swedish
stock market
MASTER THESIS WITHIN: Business Administration NUMBER OF CREDITS: 15
PROGRAMME OF STUDY: International Financial Analysis AUTHOR: Markus Drevelius & Jonas Sormunen
Master Thesis in Business Administration
Title: A study of value investment strategies based on dividend yield,
price-to-earnings and price-to-book ratios in Swedish stock market
Authors: Markus Drevelius & Jonas Sormunen
Tutor: Agostino Manduchi
Date: 2015-05-21
Key terms: Value investing, dividend yield, price-to-earnings ratio, price-to-book ratio.
Abstract
As the existence of value premium has been showed in previous studies, this paper focuses on studying strategies for capitalizing this value premium in Swedish stock market. This paper studies the possible gains and risks of value investing strategies constructed with dividend yield, price-to-earnings (P/E) and price-to-book (P/B) ratios in Swedish stock market during 2006-2016. The findings show that the studied value portfolios offered abnormal returns during the studied time-period. Moreover, value stocks performed better than growth stocks when dividend yield and P/B-ratio were used as criteria. However, the paper could not confirm the same effect in P/E-ratio as high P/E tended to work better than low P/E. Out of the studied ratios, the best risk-adjusted returns were received from companies with the lowest P/B-ratios. The findings in this paper also indicate that including more ratio-based criteria in to an investment strategy does not offer more risk-adjusted returns.
Table of Contents
... 1
1.
Introduction ... 1
1.1 Background ... 1 1.2 Problem ... 2 1.3 Purpose ... 3 1.4 Research questions ... 52.
Literature Review ... 5
2.1 Benjamin Graham’s stock selection criteria ... 5
2.2 Value investing and excess returns ... 7
2.3 Value investing in small markets ... 9
2.4 The three ratios ... 11
2.4.1 Price-to-earnings ratio ... 11
2.4.2 Price-to-book ratio ... 13
2.4.3 Dividend yield... 15
3.
Method ... 18
3.1 Building the portfolios ... 18
3.2 Fama-French three-factor model ... 19
3.3 Sharpe ratio ... 21
4.
Results ... 21
4.1 Dividend yield portfolios ... 23
4.2 Price-to-earnings ratio portfolios ... 25
4.3 Price-to-book ratio portfolios ... 27
4.4 Combination portfolios ... 28
5.
Discussion ... 30
6.
Conclusion ... 33
Graph
Graph 1: Dividend yield ... 23
Graph 2: Price-to-earnings ... 26
Graph 3: Price-to-book ... 27
Graph 4: Combination portfolios ... 29
Tables
Table 1: Average dividend yields, P/B and P/E-ratios of portfolios ... 24Table 2: Fama French three factor model with dividend yield... 24
Table 3: Sharpe ratio with dividend yield ... 24
Table 4: Fama French three factor model with price-to-earnings ... 26
Table 5: Sharpe ratio with price-to-earnings ... 26
Table 6: Fama French three factor model with price-to-book ... 27
Table 7: Sharpe ratio with price-to-book ... 28
Table 8: Fama French three factor model with combination portfolios ... 29
Table 9: Sharpe ratio with combination portfolios ... 30
Appendix
Appendix 1 ... 37Appendix 2 ... 38
Appendix 3 ... 39
1. Introduction
_____________________________________________________________________________________
In this chapter the foundation for value investing is presented and the problems that the philosophy may encounter since it was presented. Furthermore, the purpose of this thesis is presented as well as three research questions.
______________________________________________________________________
1.1 Background
Benjamin Graham (1894-1976) was one the first influential investors whose research in securities is still well-known. Graham published several books and one of his most famous book, “The intelligent investor”, published in 1949, established the concept for value investing for which reason he is still widely known as the “father of value investing”. In his books, Graham defines value investing as an investing strategy where certain type of stocks are selected. These stocks should have an intrinsic value that is higher than their current price. In other words, value investor is looking for stocks that are undervalued in the market.
Benjamin Graham’s investing philosophy was a combination of caution and courage. He believed that an investor has to be brave but at the same time he was also known as the creator of the safe margin concept. Graham was also a strong supporter of stock selection. His standpoint was that an investor who spends time and effort to analyse companies will get compensation. As a value investor, he emphasized especially the importance of stock price at the buying moment. As he stated it, stocks should be bought like vegetables, not like perfumes. The biggest losses will be made when investor is not paying enough attention to the current price.
In his famous books, Graham did not just present the concept of value investing but also created stock selection criteria for value investing. He believed that a successful value investing could not be achieved without carefully analysing stocks and their financial ratios in order to find undervalued quality stocks. By following Graham’s stock selection criteria, investors could be assured of the quality of the stock. The criteria included several different requirements including the importance of dividends, low price-to-book (P/B) ratio as well as low price-to-earnings (P/E) ratio. Graham found that especially these three
factors were important to take in to a consideration when buying a stock. The high and preferable uninterrupted dividend payments ensured the stability and quality of a company whereas the low price-to-book and low price-to-earnings ratios ensured that the investor was not paying too much for the company. Since the late 1940’s, these ratios have gained more popularity among investors (Graham, 2003).
1.2 Problem
Arguably, the stock markets have changed quite a bit from the Graham’s early days due to the current trends in the investment world. The markets around the world have seen new trends that are changing the way how investors are acting on the markets.
One of the biggest trend on the market at the moment is the index investing. Many of the world leading investors, such as Warren Buffett, have highlighted the benefits of passive index investing. This investing strategy indeed has plenty of upsides especially in the long run due to its cheapness and low market risk. Since index investing has been so much on the news and has gained so much popularity lately, one can argue that the stock markets would not perform correctly if everybody invested in passive indexes. Another criticism is that index investing is not appropriate for investors who are willing to get higher returns than the average market (Rowley et al, 2018).
Another big trend is the robot technology which is still fairly new on market but has a huge future potential. It is said that robot technology will eventually replace human portfolio managers due to its effectiveness, computing power and lack of emotions. Many financial companies have already adopted this technology and are promising to offer the future of investing (Allgayer et al, 2017).
The third main trend is the staggering amount of information and complexity. A vast amount of information usually makes everything more complicated. When it comes to investment strategies, there are already existing hundreds of them each more complex than the other. The popularity of complex strategies is explained by the asset managers who are willing to differentiate from each other and charge more for providing something new. The complicated investment world may lead investors to think that also complicated solutions are required. The same can be said for the financial instruments. A person may
not be perceived as a real investor if he does not understand how mortgage-backed securities or collateralized debt obligations work. These financially engineered investment products can get really dangerous for people who do not understand them. The increased complexity related to the security markets is distinctly visible.
Benjamin Graham introduced the stock selection criteria for value investors almost 70 years ago. He demonstrated the importance of using dividends, to-book and price-to-earnings ratios as indicators for screening stocks. However, as we have seen, the stock markets have changed, and the new trends are changing the way how participants are acting on a market. For these reasons, it will be interesting to see if the usage of dividends, P/E and P/B are still useful factors for investors to find good stocks.
1.3 Purpose
The existence of value premium regardless of the market has been shown in many studies. For instance, Fama and French (1992) showed that value stocks outperform the market. However, one could argue that there exists a lack of research regarding how investors could capitalize the value premium in the Swedish stock market.
The purpose of this paper is to study different value investment strategies to build further on the successful work of previous studies and show how value premium can be capitalized in the Swedish stock market. This will be done by using some of the Benjamin Graham’s principles of value investing. The focus is on the three different ratios, namely dividend yield, price-to-book and price-to-earnings. The reason for studying these ratios is that Graham himself found that by far the most important criteria for stock selection were the low to-earnings ratio and high dividends (Rea, 1977). In addition, price-to-book ratio is also added due to its current popularity in investing world. Another notable advice from Graham was that the portfolio should consist of 10-30 stocks in order to provide appropriate amount of diversification (Graham, 2003).
This study will focus on Swedish stock market, meaning that all the stocks will be gathered from the Stockholm stock exchange. The time-period of the study is 10 years from 2006 to 2016. Firstly, three value investment portfolios will be constructed. First portfolio will include 20 highest dividend yield companies from the Swedish stock market
in 2006. The second portfolio includes 20 lowest P/E-ratio companies. The third portfolio includes 20 lowest P/B-ratio companies. These three portfolios are considered to be value stock portfolios since they follow the Graham’s value investment principles. We will test if these portfolios can offer positive abnormal returns individually.
In addition, we will construct three other portfolios that are opposites to the three value portfolios mentioned earlier. These new portfolios will be low dividend yield, high P/E and high P/B-ratio portfolios. These three portfolios can be considered to be growth stock portfolios. In the case of growth stocks, investors have high expectations for the companies’ revenue growth which explains the high P/E and P/B-ratios. The growth stock portfolios will be compared to value stock portfolios to see how the value strategies created in this paper perform against growth strategies.
Finally, we will create two combination portfolios. The first combination portfolio will use simultaneously all the three ratios as stock selection criteria. It will consist companies with the high the dividend yields, low price-to-book ratios and low price-to-earnings ratios. The second combination portfolio will include only two ratios as stock selection criteria. These two ratios will be the two best performing ratios. This will be done to see which combination of ratios perform best and how the combination of ratios perform against individual ratios.
As a conclusion, we will create three value portfolios by using dividend yield, P/E and P/B ratios and test if the portfolios will offer abnormal returns. We will also compare their returns and riskiness to growth stock portfolios. In addition, we will combine the three value portfolio factors together with two different combinations to see if the combination value portfolios are able to perform better than the individual value portfolios. This study will investigate the usefulness of different value investment strategies in Swedish stock market during 2006-2016. It will also give an indication of the usefulness of dividend yield, price-to-earnings and price-to-book ratios in Sweden during the same time-period
1.4 Research questions
1. Do the three individual value portfolios of high dividend yield, low P/E and low P/B offer abnormal returns in Swedish stock market during 2006-2016?
2. Do the three individual value portfolios of high dividend yield, low P/E and low P/B outperform growth stock portfolios in Swedish stock market during 2006-2016?
3. Do the ratios of high dividend yield, low P/E and low P/B work better together than individually in Swedish stock market during 2006-2016?
2. Literature Review
_____________________________________________________________________________________
This chapter presents the literature review from the subjects of value investing, value investing in small market and the different rations used in value investing.
______________________________________________________________________
2.1 Benjamin Graham’s stock selection criteria
Benjamin Graham published his famous book “The intelligent investor” in 1949 where he first time introduced his stock selection criteria. The Graham’s criteria were created for investors to find good value stocks. The whole stock selection criteria included several requirements including high dividend yield, low book ratio and low price-to-earnings ratio that are also the focus of study in this paper. Due to this long history, the Graham’s stock selection criteria have been studied widely throughout the years in different markets and with different study methods. The aspects that differentiate this study from the previous studies are the facts that this study uses Fama French three factor model to assess the performance of chosen stocks, studies the specific three criteria and focuses on a relatively small stock market. However, the previous studies can still be useful to screen previous outcomes and possibly even provide information and explanations for the results of this study.
Terzi (2015) studied the Graham’s criteria in Turkey in 2005-2014. In the study, Terzi had to modify the criteria in order to create a portfolio of stocks due to the reasons that the Istanbul stock exchange did not include stocks that would meet all the Graham’s criteria. All seven criteria were used but all of them were modified for the purposes of the study. Nevertheless, Terzi compared this portfolio to the local market index by using Sharpe ratio, Jensen’s alpha and Treynor’s ratio and found that the created portfolio offered better results than the market. Terzi argued that using fewer criteria will generate higher returns due to the strictness of Graham’s criteria.
A more deeper study was conducted in Indonesia by Rachmattulah and Faturohman (2016) who created 25 portfolios that each included a different combination of Graham’s stock selection rules. This study used the CAPM asset pricing model and found that 24 of the 25 portfolios offered excess returns. Only the portfolio combining the discount to net current asset value and past earnings stability did not perform at the expected level. Similarly, another study was conducted in Indonesia which indicated even more interesting results. Kartikasari (2016) studied Graham’s and Lynch’s criteria in Indonesia in 2010-1014. In this study, three Graham’s criteria were used, namely high earnings-to-price ratio, high dividend yield and low debt to equity ratio. Their results indicate that a portfolio of combining just two ratios, high earnings-to-price and low debt to equity, offered annually risk adjusted returns of 47,55% in 2010-2012 and similarly 5,92% in 2012-2014. However, they did not find any significant risk-adjusted returns when they used a combination of all three ratios. These results indicate that the more criteria added to the portfolio, the less risk adjusted return it will offer. Kartikasari (2016) explains this reasoning by saying that fewer amount of stocks can meet the criteria when more criteria are used. This can make the portfolio more volatile and less diversified. However, one can argue that the study period in Kartikasari (2016) study is relatively small. In a study period of only two years, the adjusted annual returns can have big differences as shown in this study making the results unreliable for longer period estimations.
Interestingly, Chang (2011) found results that are not in line with Kartikasari (2016) results. Chang studied the Graham’s stock selection criteria in Malaysian stock market in 2000-2009. He selected four ratios to study, namely low price-to-earnings ratio, low price-to-book ratio, dividend yield and high current ratio. Similarly, to many other
studies, Chang also modified Graham’s criteria by choosing companies that had dividend yield equal to risk-free rate instead of choosing companies that have continuously paid dividends for at least 20 years. In this study, he found that a combination of more Graham’s criteria performed better than a combination of fewer criteria which is opposite to what Kartikasari (2016) found. According to Chang’s (2011) study, the best return in Malaysian market was offered from a portfolio that combined low price-to-earnings ratio, low price-to-book ratio and dividend yield equal to risk-free rate. The performance of this portfolio was superior to portfolios that included only low price-to-earnings ratio or only low price-to-book ratio. The author also found that some portfolios did not perform as expected during bad economic periods and argued that investors should be careful when applying Graham’s method during these periods due to the increased riskiness. Notable here is that Chang (2011) used similar criteria compared to the criteria studied in this paper. However, Chang’s study uses a study periods of only two years at a time and different dividend yield criterion. In addition, the returns received from Chang’s study are not comparable to the returns received from this study due to the lack of risk adjusted returns in Chang’s study. Most of the previous studies indicate similarities in their results. However, it can be difficult to compare some results to each other due to the different criteria used.
2.2 Value investing and excess returns
Over the years there has been numerous studies concerning the returns from value investing and the possibility of such strategies delivering excess return. One of these studies is Basu (1977) that evaluated if low price-to-earnings ratios can be used as an investment indicator. The author creates different portfolios consisting with similar price-to-earnings ratios, the portfolios are then evaluated on their performance in contrast to the risk. Basu (1977) also creates a portfolio that is comprised of random security that matches the level of risk that the low price-to-earnings ratio portfolios have. This portfolio is then the benchmark that is used to test the efficient market hypothesis. What Basu (1977) finds is that portfolios consisting of securities with low price-to-earnings ratio have on average a higher risk adjusted return then portfolios consisting of securities with high price-to-earnings ratio. Furthermore, portfolios consisting of securities with low price-to-earnings ratio have higher returns than the portfolio consisting of random securities. This is then, according to Basu (1977), a possible violation of the efficient
market hypothesis due to the possibility of low price-to-earnings ratio portfolios beating the market.
Fama and French (1992) sets out to test the asset capital pricing model and to see if there are any association with price-to-earnings ratios and variation in average stock returns. According to the authors, the asset pricing model implies that there is a positive linear relationship between security returns and the market, and that the market shows the cross-section of expected returns. However, Fama and French (1992) presents several articles that have shown these implications to be faulty, instated is seems that price-to-earnings ratio and size are a better way to explain the cross-section of average stock return. To test the hypothesis Fama and French (1992) creates different portfolios where one represents the market portfolio. From these portfolios they then can estimate slopes (Beta) for the portfolios, and from there they try to see if there are any positive relation between the market and average stock return. The results that Fama and French (1992) derives is that in the early to mid-1900 there was a positive relation between the market and average stock return but in more recent years they could see that this relationship is disappearing. Instead what can be used to describe the cross-section of average stock return today are size and price-earnings ratios.
Since Basu (1977) and Fama and French (1992), the subject of value investing and the possibility of getting excess return from investing in low P/E portfolios have evolved even further and have solidified itself academically. Chahine (2008) shows that value investing can be a relative simple investment strategy and with it he finds that there exists a value premium in Europe during 1988 to 2003. Gelderen and Huij (2014) wanted to test if the theories of value investing have been applied by investment managers and if they work in practise. They collected returns for 6814 equity fonds in USA from 1990 to 2010. To identify how the funds are constructed and see if they follow theories that are consistent with value investing or not, Gelderen and Huij (2014) used regression-based method in form of a six-factor model. What they could see was that around 20 to 30 percent of the funds were created as the theory of value investing states, so some of the investment managers have adopted academic knowledge. Furthermore, what they could see was that funds that are created in line with value investing had excess return but not only that, the excess return was consistent and sustainable for the whole period.
Chan and Lakonishok (2004) did a review on the current state of value and growth investing where they present some of the explanations for performance presented in literature and update some of the empirical results. What they say is that it has since long been proven that value outperforms growth on average and it is still relevant today as can be seen in Pettengill, Chang and Hueng (2014). But Pettengill, Chang and Hueng (2014) like Chan and Lakonishok (2004) point out that value investing works better in small cap then in large cap. This is also supported by Asness, Frazzini, Israel and Moskowitz (2015). Furthermore, Asness, Frazzini, Israel and Moskowitz (2015) find evidence that only relying on one factor like P/B when value investing is not the best way to go instead a multiple value factor approach should be used because it delivers more stable return and a higher return per risk unit.
Chan and Lakonishok (2004) say that there have been several explanations presented for the reasons of value premium. The main explanations are that there is higher risk involved when value investing or that it has something to do with the investors’ behaviour. Chan and Lakonishok (2004) cannot find any evidence that value is riskier than growth, they even see that growth is more vulnerable when the market is preforming badly. But they do see a connection between value premium and investor behaviour. Chan and Lakonishok (2004) find that investors extrapolate from the past and overpays for growth leaving value under-priced. Pettengill, Chang and Hueng (2014) have found that the use of multifactor models tends to give bias results against value investing. They say that Fama-French three-factor model is one of the most commonly used methods to test alfa. However, the bias result in favour for growth investing do not capture that value have lower realized risk than growth.
2.3 Value investing in small markets
The performance of value investing strategy has been studied for years and it has been showed multiple times that this strategy correctly performed will yield higher than average returns in the long run. This is obviously nothing unheard of. However, a quick look to previous researches from this field reveals that the value investing strategy is most often studied in large stock markets. These major stock exchanges, such as New York Stock Exchange, are clearly helpful when building a portfolio or testing an investment
strategy due to its liquidity, stability and large amount of choice. However, there is a lack of research done in smaller stock markets such as Stockholm Stock Exchange. One cannot automatically assume that value investing done with certain financial ratios will have the same effects in different sized markets since major stock markets differ from smaller counterparts by their characteristics. Even though Stockholm Stock Exchange is quite large with its 1.26 trillion USD market capitalization, it still falls far behind the largest stock market, New York Stock Exchange, and its 18.5 trillion USD market capitalization (Visualcapitalist.com).
In theory, value investing should work regardless of the market size but implying the strategy in small stock markets will still create issues. It is obvious that finding a good under-priced stock gets more difficult in smaller stock markets since the amount of choice is smaller. One could also argue that liquidity is smaller due to fewer investors. In addition, smaller markets tend to react to information harder in general, making market even more unpredictable and less stable (Fama and French, 1998).
Even with all the downsides, many articles actually prove that value investing works very well also in smaller stock markets. Fama and French (1998) studied the value and growth investing strategies in different countries around the world. They found out that portfolios that were conducted with value investing strategy offered higher returns than the market index in 12 of the 13 developed countries from which many of them were European stock markets. Interestingly, one of their studied countries was Sweden. For the case of Sweden, they studied four different ratios, namely book-to-market, earnings-to-price, cash flow-to-price and dividends per share per price ratios and created four portfolios. Fama and French (1998) found out that all four portfolios generated higher returns than the market index. However, the studied time period was 1975-1995 which means that the results are outdated for today’s standards.
Many other papers also strengthen the hypothesis of good performance of value stocks in small stock markets. Truong (2009) studied low P/E stocks as well as their riskiness and performance in New Zealand. Truong found out that low P/E stocks outperformed high P/E stocks. The same effect was found in Thailand where the local value stock index outperformed growth stocks during the study period of 17 years (Perez, 2017). The
results of these studies indicate that mispricing phenomenon takes also place in smaller stock exchanges. Investors may misprice stocks due to their inabilities of interpreting past performance or detecting the possible future trends (Truong, 2009).
Nonetheless, all research papers are not in line with the results presented above. Pei Fun & Ronni Basana (2012) studied different P/E-ratio stocks in Indonesia. Their results indicate that cheaper stocks were doing better in comparison to more expensive stocks only at short-time period. However, the authors could not find the same effect in long-time period since there was no difference between the returns of low and high P/E stocks. According to their results, cheaper stocks are not offering higher than average returns in the long run which is against the whole idea of value investing strategy. In addition, Abhyankar, Hob and Zhao (2009) investigated the value versus growth strategies in several different countries and found out that value premiums in the UK, Germany and Italy are statistically insignificant. Although, it says that value stocks are losing to growth stocks in these countries, it does not show the performance of value strategy in comparison with their market indexes. Because the results of previous research papers are not in line with each other, this may imply that the performance of value investing strategies may vary depending on the market.
2.4 The three ratios
This paper will examine three financial ratios that are in accordance with Benjamin Graham’s investing ideology and measure their performance in Swedish stock market. The three ratios are namely price-to-earnings, price-to-book and dividend yield. In this next part of the literature review we will briefly explain each of the three ratios and provide results from previous research papers in order to establish a strong theoretical
framework.
2.4.1 Price-to-earnings ratio
The price-to-earnings ratio (P/E-ratio) is a ratio that is generally used for valuing a company. It shows the company’s current share price to its per-share earnings. In other words, the price-to-earnings ratio can be used to show how much an investor has to invest in a company in order to receive one unit of the relevant currency of the company’s earnings. The price-to-earnings ratio is one of the most common ratios since it indicates whether the stock is expensive or cheap compared to other stocks.
Price-to-earnings ratio itself is very useful indicator that contains lot of information concerning the company. The usefulness of price-to-earnings ratio in investment making process has been proved in numerous research papers. So often the attention goes to the size of P/E ratio since it indicates the relative price of the stock. For instance, S. Basu (1977) studied the relationship between investment performance and P/E ratios during the time period of 14 years and found evidence that low P/E portfolios earned higher absolute and risk-adjusted rates of return than the high P/E securities.
These results were interesting since they conflicted with the efficient market hypothesis. According to the efficient market theory, investors should not be able to receive higher than average returns by using only historical data. Arguably, the markets seem to be more inefficient than the theory explains them to be.
The study from Basu raised lot of doubts about the correctness of the findings and Banz and Breen (1986) came up with a paper that criticised the some of the previous studies regarding P/E-ratio. Banz and Breen said that there was a mistake in Basu’s results due to the problems with used database. The authors also stated that the earlier studies that highlighted the positive performance of low P/E portfolios included biases such as look-ahead bias and the survivorship bias. The survivorship bias takes place if companies that merge or go bankrupt are not taken into account. A study may suffer from look-ahead bias if price-to-earnings ratios are calculated with the same year’s information which would not be available for investors until the next year (Banz and Breen, 1986). Banz and Breen (1986) continued with studying low P/E-ratio companies by changing the database and by avoiding biases. Their new findings indicated that abnormal returns cannot be achieved by solely looking at price-to-earnings ratios (Jacobs and Levy, 2000).
The controversy is evident since many other studies have found opposite results. Lakonishok, Schleifer and Vishny (1994) studied stocks of companies from which some were perceived to be cheap and some expensive. Two groups of companies were made based on how the stock market valued the companies. These two groups were studied for 37 years and the findings showed that low P/E companies tended to do better than more expensive stocks with annual return of 10-11% (Lakonishok, Schleifer and Vishny, 1994).
However, it is worth of noting that the usage of P/E-ratios involve plenty of risks. These risks can hinder investors to see the real value of a stock by affecting the P/E-ratio. For instance, earnings per share which is calculated by companies, involve a risk of being manipulated by the companies. In addition, inflation is also known to affect the P/E-ratios. The valuation of stocks is often based on their future cash-flows and inflation would negatively affect the way how investors perceive the companies’ future cash flows. This means that inflation would have a negative effect on the future growth and in this way decrease the current price of the company’s stock (Mehmet and Kocaman, 2006). It is also good to keep in mind growth rates of industries can differ a lot. Companies that are doing business in the same industry are often similar in many ways. This can be also seen as a similar P/E-ratios (Mladjenovic, 2009). The overall situation in the market, the company’s industry or the company’s own interest are factors that can have a significant impact on the company’s price-to-earnings ratio.
2.4.2 Price-to-book ratio
(2)
Price-to-book ratio (P/B ratio) shows the company’s market value in relation to its book value. Just like with the price-to-earnings ratio, price-to-book ratio indicates the value of stock where low P/B ratio is a possible indication of stock being undervalued while high indicating over-price. However, an investor should be careful with P/B ratio since low P/B ratio could also indicate possible issues in the company. Even though, price-to-book and price-to-earnings ratios are similar in many ways, P/B is arguable more practical in
certain business sectors such as in bank sectors where companies need more book value for generating revenue (Mladjenovic, 2009).
Benjamin Graham became famous during the 30s and 40s for introducing the value investment. For stock selection criteria, Graham used several ratios such as price-to-book ratio. The Graham’s value investing strategy as well as the price-to-book ratio are still effective in the 2000 century (Chang, 2011). As Chang (2011) showed in his paper, companies that have a P/B ratio less than one will likely grow more than the average market in the long-run. The same effects have been found from other research papers. For instance, it is argued that price-to-book ratio has a greater explanatory power for returns than many other ratios (Akhtar and Rashid, 2015).
For a long time, market beta was a supreme explanation for cross-sectional returns. Fama and French (1992) challenged this perception by empirically showing that the size of a company as well as book-to-market ratio are better explainers for returns. The authors go on by showing that book-to-market ratio is a clear indication of the future performance of a company. High book-to-market stocks tend to be less profitable in comparison to low book-to-market stocks five years after ranking dates (Fama and French, 1995).
In their paper, Kothari, Sloan and Shanken (1995) claim that survival bias has affected previous studies that studied book-to-market ratio and average returns and their relation to each other. Loughran (1997) agrees and says that book-to-market ratio does not explain returns realized during the study period of 1963-1995.
The performance of price-to-book ratio is not the only object of interest since many other papers have studied the ratio from other angles. For instance, Fairfield and Harris’s (1993) focus of study were the returns and the deviation from median price-to-book. They created portfolio with different deviations and used a hedging strategy that was relying on the known price-to-book anomalies. The findings showed that the highest deviation portfolios had better return even in the case of including market beta and size factors.
The variations in different companies’ book values was studied by Beaver and Ryan (2000) who investigated the sources of those variations and how the variation can possibly
benefit investors in predicting the future performance by just using P/B-ratios. Their findings did not indicate any connection between future ROE and P/B-ratios.
Penman (1996) studied how much price-to-book and price-to-earnings are related to each other. His paper shows a relatively weak relationship between these two since only 34% of low P/E companies indicated also low P/B. In addition, Penman argues that P/B is the correct measurement of earnings growth since it predicts better future profitability and is not affected by current profitability unlike P/E. The controversy in the results of different studies is evident as price-to-book ratio has been studied for decades. One can argue that the common interest of price-to-book ratio in finance is due to its usefulness in predicting growth and future profitability (Fama and French, 1992).
2.4.3 Dividend yield
(3)
Unlike the previous two ratios, dividend yield does not measure the value of a stock. Dividend yield simply displays the amount of dividends the company pays out each year relative to its share price. Dividend yields are presented in per cents and can vary a lot between different companies. This is because companies do not have to pay dividends every year but instead can invest the money for future growth. Companies that pay regularly high dividends are usually big and stable companies with large amount of free cash-flow. They can also be market leaders. However, high dividends can also tell that the company is undervalued in the market or that the company is trying to attract new investors (Kohei Aono and Tokuo Iwaisako, 2009).
In their paper, Huang et al. (2014) studied dividend yield strategy called Dogs strategy in the Greater China region. For the purpose of this study, equally-weighted measure, three factor model and value weighted-measure was used to examine performance of the strategy. Their empirical findings indicate that companies which had the highest dividend yields, had also positive abnormal returns even under the three-factor model. Furthermore, high dividend yield companies also over performed the Chinese MSCI Golden Dragon index in 2003-2009. On the other hand, as Aono and Iwaisako (2009)
showed, dividend yield can only weakly predict stock returns in Japan. Although, when the bad periods in the economy were excluded and autocorrelation in returns was taken into account, there was evidence that the log dividend yield was useful when forecasting future stock returns.
Black and Scholes (1973) found evidence that stocks that had higher dividend yield ratios did not bring higher returns. Their test involved several steps where they first constructed a portfolio with a specific return they intended to have. Black and Scholes also created their own method where they could separate high dividend yield stocks from low dividend yield stocks. After that they created high dividend yield portfolio and a low dividend yield portfolio in a way where they minimised the possibilities of affecting risk level. The authors’ findings show a non-existing relation between dividend yield ratio stock returns. Black and Scholes concluded that ignoring dividend yield could be a good idea since it is not significantly affecting stock returns. Although, the authors did not state that dividend yield was completely useless. Investors can find dividend yield useful if they have for example a taxational reason for going after low or high dividend stocks (Black and Scholes, 1973).
Modigliani and Miller (1961) said that dividends from companies have no significant effect on stock price. In their paper, the authors demonstrated this by showing that investors can make own dividends which do not differ from the actual dividend paid by the company. To do this, the investor can reinvest his dividends by buying new shares if he thinks the company paid too much dividends. With the same logic, investor can sell part of his shares and receive money if he is unhappy with small dividends that the company paid. What this means is that investors should not care too much about the dividends of a firm. Although, Modigliani and Miller had to point out that the dividend irrelevance theory only works in an ideal capital market (Modigliani and Miller, 1961). The bird in the hand theory, on the other hand, highlights the importance of dividends in investing. The key idea behind this theory is that dividends from companies are usually more predictable when compared to capital gains. This implies that companies tend to have more control of dividends than capital gains for which reason investors might not see dividends as risky as capital gains. Investors might require higher returns from capital
gains. However, as Keown et al. (2007) said, dividend is not a factor that makes companies less risky by itself.
Another theory called dividend signalling theory argues that with dividends, management is signalling messages to their shareholders. According to this theory, there is only “good” and “bad” firms. The “good” firms can separate themselves from “bad” firms in the eyes of investors by promising to pay dividends that are too large for “bad” companies to mimic. “Bad” companies cannot promise to pay dividends as large as “good” companies since it will get too risky for them (Ogden et al. 2003).
Ogden et al. (2003) present another factor that highlights the importance of dividends in successful companies. According to their paper, companies can have conflicts between actors. The conflicts are usually due to the different interests concerning the company. The authors argue that dividend payments can actually solve many conflicts and with this way improve the overall performance of a company. There can be several reasons for conflicts between actors. For instance, the management might want to increase the size of company. With this way, the management will probably get higher income as the size increases. Furthermore, this means that getting rid of managers will be more difficult due to complexity that has increased as the company’s size increased. This kind of self-interest of managers’ can make owners worried about the future of the company. However, a solution would be to offer portion of the free cash flow to the owners (Ogden et al. 2003).
3. Method
_____________________________________________________________________________________
The purpose of this chapter is to provide the method on how the data is collected and how the portfolios are constructed. In addition, this part presents how the portfolios are evaluated, which models are used and what they capture.
______________________________________________________________________
3.1 Building the portfolios
To create the portfolios, we collected P/E, P/B and dividend yield for all companies listed on Nasdaq OMX Stockholm for the year of 2005 through Thomson Reuters DataStream. We only use volume shares and disregard the voting shares, which left us with 165 observations. Then if a company had a zero value in P/E or P/B ratios it is removed from the data set, because it is then not in line with value investing or growth investing. The reasoning for why the same is not done in consideration to dividends yield is because zero dividends is not interfering with growth investing. So, the zero dividends are used in a growth portfolio, therefore needed. This then leaves 119 observations in P/E, 160 observations in P/B and 153 in dividends yield.
The remaining companies were then ranked based on their P/E, P/B and dividend yield. P/E and P/B function as indicators for a company’s potential, where lower P/E and P/B values are better. The company with the lowest P/E is ranked as number one, the second lowest is ranked as number two and so on and so forth. P/B ratio ranking follows the same method as P/E where the lowest P/B company is ranked as number one and so on and so forth. In the case of dividend yield, the ranking method is opposite to P/E and P/B, because the company with the highest dividend yield is ranked as number one, the second highest as number two and so on and so forth. However, that is not the only difference since there are several companies that during the period did not pay out any dividends. In this study all the companies with zero dividends are given the same value.
After the ranking, we created the portfolios needed for the thesis. To start with, three value portfolios were created. The first portfolio includes the top 20 lowest P/E companies, the second portfolio includes the top 20 lowest P/B companies and the third
portfolio has the top 20 highest dividend yield companies. These three portfolios are following value investing selection principles where it is recommended that companies pay dividends and have P/E less than 15 and P/B less than 1,5.
To contrast the value portfolios, three growth portfolios were created. First portfolio has the 20 highest ranked P/E companies, the second has the 20 highest ranked P/B companies and the third has the 20 lowest ranked dividend yield companies. In other words, there will be a high and low portfolio for each of the individual ratios.
This paper also includes two value portfolios consisting of different combinations of ratios. First combination portfolio consists low P/E, low P/B and high dividend yield. The second consists just low P/B and high dividend yield. The combined portfolios are created by summarizing the scores from the respective individual ratios from the previous ranking and then the 20 companies with the lowest total score is picked to create the combination portfolios. For instance, if a company was placed number one in each of the three categories, in combination ranking it would have a total score equal to three. The returns of the different portfolios were calculated by using adjusted closing prices and the historical prices were collected from Thomson Reuters DataStream. The portfolio monthly return is then calculated with the average return of the companies in that portfolio. In the appendix, the portfolios are presented with the companies and their rank in the respective portfolio.
3.2 Fama-French three-factor model
The next step, after creating the portfolios is to see how they perform. However, only looking at a portfolios return will not tell the whole story. Instead what we need to take in to consideration is the amount of return the portfolios deliver in relation to the risk. To do this, there are several ways how one could go about it. One way would be to use the Capital asset pricing model (CAPM). The problem with CAPM is that it has been proven to be insufficient in explain required return on investments. Instead the method that will be used is the development of CAPM, namely Fama-French three-factor model. As described in their article, the three-factor model of Fama and French (1992) expands on the traditional CAPM which only considers one variable, namely market risk. If an investor’s portfolio differs from the overall market by its size or with the growth-value
tilt, then the investor can expect to have different returns than what the market offers on average. This is because there are additional risks involved for having a portfolio bigger or smaller than the market as well as having a portfolio with a different focus on growth and value stocks compared to the market. In their famous article, Fama and French (1992) introduced the Fama-French three-factor model to describe stock returns where the three factors are market risk, small versus big companies and high book-to-market companies versus low book-to-market companies. By adding size and value factors, the Fama-French three-factor model can explain up to 90 % of investment’s return which is a high number compared to CAPM`s 70 % (Fama and French,1992). The Fama-French three-factor model is presented below:
𝑟
𝑖− 𝑟
𝑓= 𝛼
𝑖+ 𝛽
1𝑖(𝑟
𝑚− 𝑟
𝑓) + 𝛽
2𝑖𝑆𝑀𝐵 + 𝛽
3𝑖𝐻𝑀𝐿 + 𝜀
𝑖(4)
Where 𝑟𝑖 is the portfolio’s expected rate of return, 𝑟𝑓 is the risk-free rate,𝑟𝑚 is the market
return, SMB is the return of the size factor, HML is the return of the value factor, 𝛽𝑖 is the
coefficients of 𝑟𝑚− 𝑟𝑓, SMB and HML and finally
𝜀
𝑖 is the residuals.To estimate the three-factor model there is four things needed, the monthly market return, monthly risk-free rate, monthly SMB factor data and monthly HML factor data for 2006 to 2016. Market return is the return for the market portfolio that includes all the stocks on the specific market. In this study we are investigating the Swedish market. Nasdaq Stockholm provides a portfolio that consists of all the available stocks in the market. The portfolio is called OMXSPI. In the case of the market return, we collected historical prices for OMXSPI from Nasdaq and then calculated the monthly return to be used in the regression. The risk-free rate was received by collecting monthly return of Swedish government bonds with ten-year maturity, the data were downloaded from Statistic Sweden (SCB). Finally, monthly data for SMB and HML were collected from Kenneth French’s website. On his website Kenneth French provides data for these factors and he updates them regularly. He is also one of the founders of three-factor model and the data is considered to be highly reliable.
3.3 Sharpe ratio
Fama-French three factor model is used in this study to measure abnormal returns. Moreover, Fama-French also gives precise indications of different risks involved in each individual portfolio. However, this paper will also compare different portfolios to each other. It is rather difficult to compare risk adjusted performance between different portfolios with Fama-French model since this method involves three different betas. For this reason, Sharpe ratio is also used in this study to measure the returns and risk. The reason for adding Sharpe ratio is that Sharpe ratio gives more understandable indications for comparing the overall performance of different portfolios to each other.
Sharpe ratio measures portfolio’s reward to its own volatility. Unlike many other methods such as CAPM and Fama-French, Sharpe ratio does not use beta as a risk measurement but instead uses standard deviation. Moreover, the interpretation of Sharpe ratio is simple since higher number indicates better risk adjusted performance (Bodie et. al, 2010). Sharpe ratio is calculated by subtracting risk-free rate from the portfolio return and dividing it by the standard deviation of the portfolio.
(5)
4. Results
_____________________________________________________________________________________
In this chapter the results are presented for the eighth portfolios constructed, in conjunction whit the results from the evaluation of the portfolios.
______________________________________________________________________ This chapter includes results from the empirical research conducted in this study. The results are summarized in order to give a good understanding for the reader. The result part is divided in to four individual parts. Firstly, the results of dividend yield portfolios are presented which is followed by the results of price-to-earnings and price-to-book ratio
portfolios. After going through individually the results of each ratio, the results of combination portfolios will be presented.
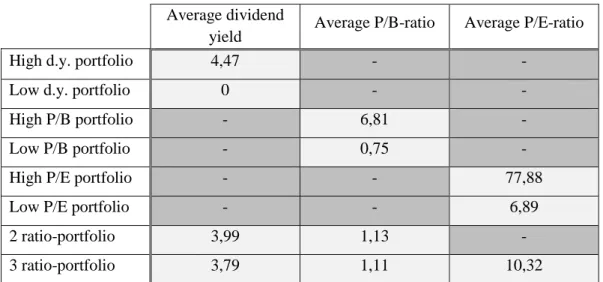
Two portfolios have been constructed for each three ratios. This is done by taking the highest 20 companies and the lowest 20 companies based on their ratios. High dividend yield portfolio contains 20 companies with the highest dividend yield ratios and low dividend yield portfolio contains the lowest 20 dividend yield companies. The same portfolio construction method is applied to all three ratios. Two combination portfolios are also created. The first combination portfolio combines a mixture of high dividend yield and low price-to-book ratio companies. The second combination portfolio includes companies with high dividend yields, low price-to-earnings and low price-to-book ratios. The table 1 shows the average dividend yields, average P/B-ratios and average P/E-ratios for the studied portfolios.
Table 1: Average dividend yields, P/B and P/E-ratios of portfolios
The stocks have been taken from the Stockholm stock exchange and the study period lasts from the beginning of 2006 to the end of 2015. The graphs indicate the average yearly returns of high and low portfolios together to show the reader how the two portfolios are performing against each other during the same time period. The graphs are followed by tables that show the results of Fama-French three factor model. The Fama-French tables are also presented in a way that the reader can compare the results of high and low portfolios. The time period in the Fama-French tables are similarly 10 years. For all the
Average dividend
yield Average P/B-ratio Average P/E-ratio High d.y. portfolio 4,47 - -
Low d.y. portfolio 0 - - High P/B portfolio - 6,81 - Low P/B portfolio - 0,75 - High P/E portfolio - - 77,88 Low P/E portfolio - - 6,89 2 ratio-portfolio 3,99 1,13 - 3 ratio-portfolio 3,79 1,11 10,32
Fama-French tables, actual return is the annual average return of equally weighted portfolio and required return is the cost of equity calculated with the Fama-French three factor model. A, b, s and h are correspondingly the intercept, market risk factor, size risk factor and value risk factor. P(a), p(b), p(s) and p(h) are the p-values for intercept and market, size and value risk factors. Lastly, the R square indicates how well the observed outcomes are explained by the Fama-French three factor model. In addition, the result part contains tables of Sharpe ratio for each portfolio that are calculated with the annual returns. Higher Sharpe ratio indicates better portfolio.
4.1 Dividend yield portfolios
In the graph below the average returns of high and low portfolios are presented together. Low d.y. represents the low dividend yield portfolio and high d.y. represents the high dividend yield portfolio. In the graphs, the holding period gradually increases from left to right. The graph indicates that the after the market crash in 2008, the high dividend yield portfolio has been able recover returns quicker than the low dividend yield portfolio. The high dividend yield portfolio has provided stable annual returns the last five years of the study period whereas the low dividend yield portfolio has had difficulties in providing positive returns.
Graph 1: Dividend yield -0,200 -0,100 0,000 0,100 0,200 0,300 0,400 0,500 2006 2007 2008 2009 2010 2011 2012 2013 2014 2015 Low d.y. High d.y. Investment horizon Av e ra ge y e ar ly r e tu rn
Dividend yield
Actual Return Required Return a b s h p(a) p(b) p(s) p(h) R Square High d.y. 13,96% 6,82% 0,60 0,89 0,26 0,02 0,12 0,00 0,14 0,91 0,53 Low d.y. 7,95% 7,50% 0,04 0,88 0,21 -0,45 0,95 0,00 0,43 0,05 0,30
Table 2: Fama French three factor model with dividend yield
Sharpe ratio of annual dividend yield returns
High dividend yield 0,64
Low dividend yield 0,28
Table 3: Sharpe ratio with dividend yield
The results of the portfolio returns are presented more accurately in the Fama-French table 1 above. The required return, also known as the cost of equity, shows the minimum annual return that the portfolio should offer in order it to be justified to invest in that specific portfolio. Required return takes into account the three risk factors of Fama-French model. As the table 1 shows, both of the portfolios offered higher returns compared to their required return levels. In other words, high and low dividend yield portfolios offered positive abnormal returns. In addition, both portfolios indicate a positive intercept, but the p-values are not significant at 10 percent significance level. When it comes to risks, both portfolios have almost identical market beta and since it is almost equal to one, it means that these portfolios and the market share similar movements. The table also shows that the size risk factor is slightly greater for high dividend yield portfolio meaning that it contains more small cap stocks. The value factor is seemingly greater in high dividend yield portfolio and with value risk factor of 0,02 it has a better balance of growth and value stocks. Although, the value risk factor is statistically significant only in low dividend yield portfolio meaning that this portfolio is not exposed to value risk. Overall, investing in both portfolios is justified according to
Fama-French three factor model. However, high dividend yield portfolio was a better option for an investor in 2006 since it offered higher return with approximately the same amount of risk compared to the low dividend yield portfolio. Table 2 supports this result by showing better Sharpe ratio for high dividend yield portfolio.
4.2 Price-to-earnings ratio portfolios
Graph 2 and table 3 summarize the results of portfolios ranked by their P/E-ratio. The graph indicates similar phenomena than the previous graph; the year of 2006 offers relatively high returns especially for low P/E-ratio portfolio. However, the returns of both portfolios fall in the following year due to the financial market crash. Nevertheless, the returns bounced back relatively quickly and remained stabilized until the end of 2015. During the study period, the returns of low P/E-ratio portfolio have fluctuated more indicating more riskiness whereas the high P/E-ratio portfolio has shown more stability.
Both, the high and the low P/E-ratio portfolios, offered positive abnormal returns during 2006-2015. As mentioned in the last paragraph, low P/E portfolio seems to fluctuate more indicating more riskiness. The same effect can be seen in the Fama-French table as market beta of low P/E portfolio is 0,92 whereas the high P/E portfolio has a market beta of 0,57. This means that low P/E portfolio is responding more to the swings in the market making it riskier investment option. Interestingly, according to the Fama-French model, low P/E portfolio does not have a tilt towards value factor since its value risk factor is only -0,14. This is interesting result because low P/E companies are usually seen as value companies. On the other hand, the p-value of value risk factor for low P/E portfolio is not significant at 10% significance level. The results from Fama-French clearly indicate that the low P/E portfolio offers higher returns than its counterpart but at the same time also carries more risk. An investor would have earned higher absolute returns with low P/E portfolio, but Sharpe ratio indicates that the high P/E portfolio would have been preferred due to its lower volatility.
Graph 2: Price-to-earnings Actual Return Required Return a b s h p(a) p(b) p(s) p(h) R Square High P/E 10,63% 5,21% 0,45 0,57 0,08 -0,30 0,17 0,00 0,59 0,02 0,33 Low P/E 11,30% 7,19% 0,34 0,92 0,05 -0,14 0,36 0,00 0,77 0,35 0,51
Table 4: Fama French three factor model with price-to-earnings
Sharpe ratio of annual P/E returns
High P/E 0,65
Low P/E 0,52
Table 5: Sharpe ratio with price-to-earnings -0,15 -0,1 -0,05 0 0,05 0,1 0,15 0,2 0,25 0,3 2006 2007 2008 2009 2010 2011 2012 2013 2014 2015 High P/E Low P/E Investment horizon Av er ag e ye ar ly r etu rn
P/E
4.3 Price-to-book ratio portfolios
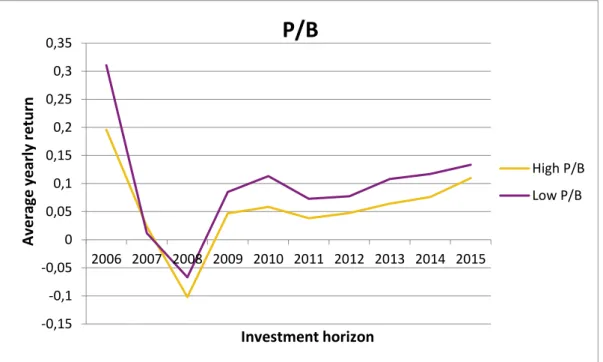
Graph 3 and table 5 summarize the results of portfolios ranked by their P/B-ratio. The graph indicates that the low ratio portfolio offers better raw returns than the high P/B-ratio portfolio most of the time during the studied time period. Notable here, just like in the previous graphs, is the quick recovery of the returns in 2009 after the market crash. This recovery was followed by another smaller decrease in returns in 2011. All the studied portfolios except the low dividend yield portfolio have shown a small and steady growth in their returns during the last four years of the study period.
Graph 3: Price-to-book Actual Return Required Return a b s h p(a) p(b) p(s) p(h) R Square High P/B 10,96% 6,15% 0,40 0,70 0,12 -0,35 0,29 0,00 0,50 0,02 0,37 Low P/B 13,35% 6,57% 0,57 0,78 0,08 -0,27 0,13 0,00 0,63 0,07 0,43
Table 6: Fama French three factor model with price-to-book -0,15 -0,1 -0,05 0 0,05 0,1 0,15 0,2 0,25 0,3 0,35 2006 2007 2008 2009 2010 2011 2012 2013 2014 2015 High P/B Low P/B Investment horizon Av e ra ge y e ar ly r e tu rn
P/B
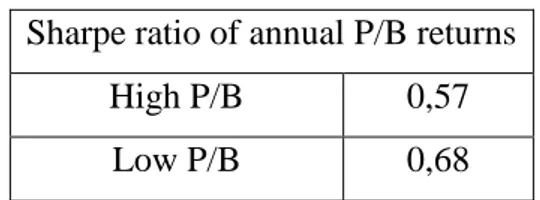
Sharpe ratio of annual P/B returns
High P/B 0,57
Low P/B 0,68
Table 7: Sharpe ratio with price-to-book
In actual returns, the low P/B portfolio offered seemingly higher raw returns than the high P/B portfolio. The required return level was notably low for both portfolios indicating that both of them performed well considering their risk loadings. Neither of the positive intercepts are statistically significant. When it comes to the risk factors, both portfolios have similar market beta. The market betas of 0,7 and 0,78 indicate that the returns of portfolios are moving little bit less than the overall market. The table also shows that the high P/B portfolio has a little bit higher size risk factor meaning that it is exposed more to small cap stocks. Notable here is the fact that the value risk factors are statistically significant in both portfolios at 10% significance level. The value factors of 0,35 and -0,27 indicate that neither of the portfolios are exposed to value risk. This result is interesting since low P/B stocks are expected to have a tilt towards value risk. As a conclusion, these results indicate that low P/B portfolio is clearly better investment option than the high P/B portfolio. It offered clearly higher returns while there are no seemingly large differences in their riskiness. This is also supported by Sharpe ratio which shows a better risk-adjusted return for low P/B portfolio although, the difference is only 0,11.
4.4 Combination portfolios
So far, the results have indicated that high dividend yield portfolio performed better than the low dividend yield portfolio when risk factors were taken into account. Similarly, the low P/B portfolio outperformed the high P/B portfolio. In the case of P/E-ratio, the low portfolio surprisingly did not show better performance in comparison to the high portfolio. This final section in the result part contains two combination portfolios. The first combination portfolio includes all the three value criteria presented in this paper, namely high dividend yield, low P/E and low P/B. In other words, this portfolio includes 20 companies with the highest dividend yields and lowest P/E and P/B-ratios. However, as we showed it earlier, the low P/E portfolio did not outperform high P/E portfolio for which reason the low P/E will be left out from the second combination portfolio. This
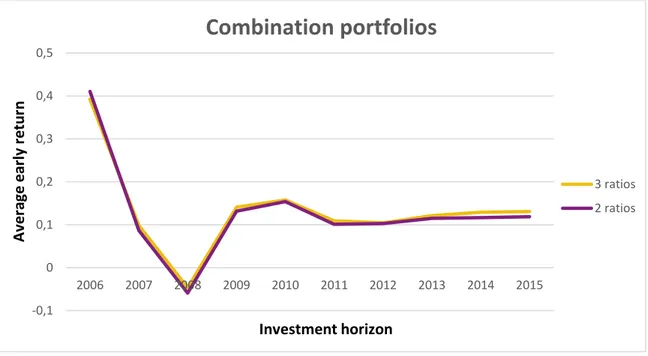
means that the second combination portfolio only includes the high dividend yield and low P/B since these two ratio portfolios proved to be working better than their counterparts. The graph 4 below indicates the annual returns from these two combination portfolios. The “3 ratios” indicates the high dividend yield, low P/E and low P/B portfolio whereas the “2 ratios” indicates high dividend yield and low P/B portfolio. The returns from the two portfolios are evidently similar throughout the whole 10-year time-period.
Graph 4: Combination portfolios Actual Return Required Return a b s h p(a) p(b) p(s) p(h) R Square High d.y., low P/E, low P/B portfolio 13,09% 6,81% 0,52 0,89 0,10 0,00 0,18 0,00 0,60 0,98 0,50 High d.y., low P/B portfolio 11,89% 6,92% 0,41 0,92 0,14 0,05 0,28 0,00 0,42 0,76 0,53
Table 8: Fama French three factor model with combination portfolios
-0,1 0 0,1 0,2 0,3 0,4 0,5 2006 2007 2008 2009 2010 2011 2012 2013 2014 2015
Combination portfolios
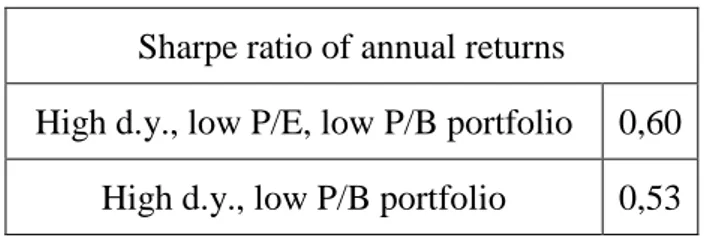
3 ratios 2 ratios Av e ra ge e ar ly r etu rn Investment horizonSharpe ratio of annual returns
High d.y., low P/E, low P/B portfolio 0,60
High d.y., low P/B portfolio 0,53
Table 9: Sharpe ratio with combination portfolios
As the Fama French table 5 above shows, the portfolio with three ratios performed better than the portfolio with only two ratios. This can be seen by looking at the actual and required returns. Moreover, the three-ratio portfolio also shows less riskiness since it has 0,03 lower market beta factor. The other risk factors are not statistically significant. The better performance of three-ratio portfolio can also be seen from the Sharpe ratio table 6. However, notable here is the fact that neither of the combination portfolios outperformed the individual value portfolios. The high dividend yield portfolio as well as the low P/B portfolio both performed better than combination portfolios during 2006-2016. This indicates that including more ratios in an investment strategy is not beneficial for investor. The investor in 2006 would have got the highest risk adjusted returns by simply investing in 20 lowest price-to-book ratio companies which can be seen by comparing Sharpe ratios.
5. Discussion
_____________________________________________________________________________________
The purpose of this chapter is to answer to the research questions presented in the beginning as well as present the conclusions that can be drawn from this thesis.
______________________________________________________________________
The purpose of the thesis is to test different value investing strategies and compare their returns and risk loadings to see which strategy was most preferable in Sweden during 2006-2016. All strategies are based on either dividend yield, to-book ratio or price-to-earnings ratio or different combinations of them. We presented three questions; do there exist a value premium for the three value portfolios in Sweden during 2006-2016, do the three value portfolios outperform growth stock portfolios, and do a combination of the three ratios result in better risk adjusted returns than using the ratios individually.
On the first question what we can see is that there exists a value premium in the Swedish market. In fact, all the three individual value portfolios, namely low P/B, low P/E and high dividend yield, have higher actually return than required return in the Fama-French three-factor model. This shows that value premium is not only a phenomenon in large markets like USA but also in smaller market like Sweden and that it is in line with other studies conducted on small market (Abhyankar, Hob and Zhao, 2009; Truong, 2009; Fun and Basana, 2012). An interesting observation is that much like Pettengill, Chang and Hueng (2014), we see that Fama-French three-factor model has problem when testing the value premium. The model is not capable of identifying where this premium comes from. However, as Chan and Lakonishok (2004) stated it, this is something that is in great discussion and no one has a conclusive answer to the value premium.
Value and growth investing has been an interesting and hot topic for several years. Looking at the Swedish market we see that high dividend yield and low P/B were better options than low dividend yield and high P/B. This finding indicates that when considering these two ratios, the value stocks indeed performed better than growth stocks. However, for P/E-ratio the high portfolio outperformed the low, meaning that in this ratio the growth portfolio had the better results during 2006-2016. The P/E value portfolio still delivered good return but for the studied period we see that growth outperforms it. This may not come as a shock since the results from the theoretical part regarding P/E are inconclusive. Basu (1977) found evidence of low P/E stocks outperforming high P/E stocks. However, this finding faced criticism from Banz and Breen (1986) who found that Basu (1977) was bias in the stock selection. Banz and Breen (1986) demonstrated that if Basu’s study was done without this bias, there was no significance overperformance of the low P/E portfolio. At the same time there are several other besides Basu (1977) that have found that low P/E outperforms high P/E (Lakonishok, Schleifer and Vishny, 1994). Considering this study, we can say that there does not exist one truth regarding the outperformance of low and high price-to-earnings stocks. The results may vary due to differences in markets, time periods or securities. What it means for this thesis is that this is an interesting subject for further investigation. A several time-period studies needs to be conducted regarding P/E- ratio which is outside of the scope for this thesis.