D E T E C T I O N O F M Y O C A R D I A L I S C H E M I A U S I N G R E A L - T I M E M Y O C A R D I A L C O N T R A S T E C H O C A R D I O G R A P H Y
Malmö Univeristy Health and Society Dissertation 2006:3
© Petri Gudmundsson 2006 Illustrator, Petri Gudmundsson ISBN 91-7104-202-4
PETRI GUDMUNDSSON
DETECTION OF MYOCARDIAL
ISCHEMIA USING REAL-TIME
MYOCARDIAL CONTRAST
ECHOCARDIOGRAPHY
Malmö högskola, 2006
Hälsa och Samhälle
Publikationen finns även elektroniskt, se www.mah.se/muep
To my lovely wife Cornelia and my wonderful children, Amadeus, Ofelia and Esmeralda Without you I would never have kept my balance
CONTENTS
ORIGINAL PAPERS... 9
ABBREVIATIONS ... 10
ABSTRACT ... 11
INTRODUCTION... 13
Basic echocardiographic principles ...13
Echocardiography in Myocardial ischemia ...14
Echocardiographic contrast agents ...16
Contrast agents and safety...18
Myocardial Contrast Echocardiography (MCE) in myocardial ischemia 19 Power Modulation ...20
From Visual to Parametric and Quantitative MCE...22
Visual ...22
Parametric, Quantitative, Qontrast®...22
In this thesis ...23
Method of reference...25
AIMS ... 26
MATERIAL AND METHODS... 27
Patients...27
Echocardiographic equipment ...27
Study protocol...28
Real-time perfusion interpretation ...29
Perfusion artefacts and non-interpretable territories ...35
SPECT ...36
STATISTICS ... 38
R.eal-time perfusion adenosine stress echocardiography...28
SUMMARY OF RESULTS ... 39 Paper I ...39 Paper II ...41 Paper III ...43 Paper IV...50 RTP-ASE Variability ...55 DISCUSSION ... 56 Limitations...62 CONCLUSIONS ... 64
POPULÄRVETENSKAPLIG SAMMANFATTNING PÅ SVENSKA. ... 66
Diagnostisering av syrebrist i hjärtmuskeln med hjälp av kontrast-förstärkt ultraljudsundersökning avhjärtmuskelns genomblödning ACKNOWLEDGEMENTS ... 69
REFERENCES... 72
Preface
MY CONTRIBUTIONS TO THE INCLUDED PAPERS OF THIS THESIS I planned the major part of the work and performed all echocardio-graphic examinations except a few examinations in paper I where I and a co-author alternated. SPECT examinations were carried out by expert staff at the department of clinical physiology. I have been responsible for all of the writing with helpful correspondence by my tutors and co-authors when needed.
NOT INCLUDED PAPERS TO WHICH I HAVE CONTRIBUTED DURING MY WORK OF THE PRESENT THESIS:
Borgquist R, Gudmundsson PGudmundsson PGudmundsson PGudmundsson P, Winter R, Nilsson P, Willenheimer R. Erectile dys-function in healthy subjects predicts reduced coronary flow velocity reserve. Int J Cardiol. 2006 Sep 20;112(2):166-70.
Gudmundsson P Gudmundsson PGudmundsson P
Gudmundsson P, Rydberg E, Winter R, Willenheimer R. Visually estimated ejection fraction is closely correlated with quantitative methods.Int J Cardiol. 2005 May 25;101(2):209-12.
Winter R, Gudmundsson PGudmundsson PGudmundsson PGudmundsson P, Willenheimer R. Real-time perfusion adenosine stress echocardiography in the coronary care unit: a feasible bedside tool for predicting coronary artery stenosis in patients with acute coronary syndrome. Eur J Echocar-diogr. 2005 Jan;6(1):31-40.
Rydberg E, Gudmundsson PGudmundsson PGudmundsson P, Kennedy L, Erhardt L, Willenheimer R. Left atrioven-Gudmundsson P tricular plane displacement but not left ventricular ejection fraction is influenced by the degree of aortic stenosis. Heart. 2004 Oct;90(10):1151-5.
Winter R, Gudmundsson PGudmundsson PGudmundsson PGudmundsson P, Ericsson G, Willenheimer R. Correlation of the M-mode atrioventricular plane early diastolic downward slope and systolic parameters. Coupling of LV systolic and early diastolic function. Int J Cardiovasc Imaging. 2004 Apr;20(2):101-6
Rydberg E, Arlbrandt M, Gudmundsson PGudmundsson PGudmundsson PGudmundsson P, Erhardt L, Willenheimer R. Left atrio-ventricular plane displacement predicts cardiac mortality in patients with chronic atrial fibrillation. Int J Cardiol. 2003 Sep;91(1):1-7.
Winter R, Gudmundsson PGudmundsson PGudmundsson PGudmundsson P, Willenheimer R. Feasibility of noninvasive transthoracic echocardiography/Doppler measurement of coronary flow reserve in left anterior descending coronary artery in patients with acute coronary syndrome: a new tech-nique tested in clinical practice. J Am Soc Echocardiogr. 2003 May;16(5):464-8.
ORIGINAL PAPERS
I. Real-time perfusion adenosine stress echocardiography versus myocar-dial perfusion adenosine scintigraphy for the detection of myocarmyocar-dial ischemia in patients with stable coronary artery disease. Petri Gud-mundsson, Reidar Winter, Magnus Dencker, Mariusz Kitlinski, Ola Thorsson, Lennart Ljunggren, Ronnie Willenheimer. Clin Physiol Funct Imaging. 2006 Jan;26(1):32-8.
II. High-resolution grey scale or angio mode power modulation? Head to head comparisons of two modalities of real-time perfusion adenosine stress echocardiography with simultaneous SPECT. Petri Gudmunds-son, Kambiz Shahgaldi, Reidar Winter, Magnus Dencker, Mariusz Kitlinski, Ola Thorsson, Lennart Ljunggren, Ronnie Willenheimer.
Submitted.
III. Parametric quantification of myocardial ischemia using real-time perfu-sion adenosine stress echocardiography images, with SPECT as refer-ence method. Petri Gudmundsson, Kambiz Shahgaldi, Reidar Winter, Magnus Dencker, Mariusz Kitlinski, Ola Thorsson, Lennart Ljunggren, Ronnie Willenheimer. Submitted.
IV. Quantitative detection of myocardial ischemia by real-time perfusion adenosine stress echocardiography. A comparison with SPECT. Petri Gudmundsson, Kambiz Shahgaldi, Reidar Winter, Magnus Dencker, Mariusz Kitlinski, Ola Thorsson, Lennart Ljunggren, Ronnie Willen-heimer. Submitted.
ABBREVIATIONS
RTP Real time perfusion
ASE Adenosine stress echocardiography
RTP-ASE Real time perfusion adenosine stress echocardiography SPECT 99mTc-sestamibi single-photon emission computed
tomo-graphy
DSE Dobutamine atropine stress echocardiography
ECG Electrocardiogram
CAD Coronary artery disease
LAD Left anterior descending coronary artery
LCx Left circumflex coronary artery
RCA Right coronary artery
RPD Right posterior descending coronary artery
MI Mechanical index
MCE Myocardial contrast echocardiography
AM Angio mode of power modulation
HR High resolution grey scale of power modulation
A Peak signal intensity
β Myocardial blood flow velocity
Axβ Myocardial blood flow
A-r Peak signal intensity reserve
β-r Myocardial blood flow velocity reserve
Axβ-r Myocardial blood flow reserve
PPV Positive predictive value
NPV Negative predictive value
ABSTRACT
Echocardiography is an ideal clinical method for obtaining information about morphology and function of the heart. Echocardiography is more accessible, mobile and inexpensive compared to other imaging techniques and has become the perhaps most used diagnostic method in cardiology during recent years. To assess myocardial ischemia, different types of stress echocardiography have been available, where mainly wall motion analysis at rest and stress has been used to evaluate the presence and ex-tent of ischemia. During the last few years, second generation contrast agents have become clinically available. This has improved image quality in echocardiography, which, combined with new ultrasound technical developments, has made it possible to obtain echocardiographic images of myocardial perfusion. When this myocardial contrast echocardiogra-phy technique is carried out in real-time, as in the studies of this thesis, it is labelled real-time perfusion (RTP). RTP in combination of adenosine stress (RTP-ASE) has the potential to become a valuable clinical tool to evaluate myocardial ischemia. If proven as accurate as other clinically and scientifically accepted methods, such as 99mTc-sestamibi single-photon emission computed tomography (SPECT), RTP-ASE might be-come an alternative method. Compared to SPECT, it is more accessible, mobile, inexpensive, and without radiation, compared to dobutamine-atropine stress echocardiography (DSE) it is more tolerable and swifter, and it is more accurate than exercise ECG.
In all studies of this thesis, we performed RTP-ASE in patients with known or suspected stable coronary artery disease (CAD), admitted to adenosine SPECT evaluation. Adenosine was infused to provoke relative regional hypo-perfusion in ischemic myocardial territories. Using a
SONOS 5500 echocardiography machine, patients underwent RTP imag-ing durimag-ing Sonovue® infusion, before and throughout the adenosine stress, also used for SPECT. RTP images were stored for later, blinded, off-line analysis. In studies III and IV, the commercially available soft-ware Qontrast® was used to generate parametric images of myocardial perfusion and quantitative values of perfusion replenishment from RTP-ASE image loops. Method of reference for the ischemia evaluation in the thesis was the presence or absence of reversible ischemia at SPECT. The left ventricular myocardium was divided into three territories correspond-ing to the distribution territories of the three main coronary arteries; left anterior descending (LAD), left circumflex (LCx) and right coronary ar-tery (RCA).
In studies I and II, we investigated the feasibility of RTP-ASE for the detection of ischemia using visual interpretation of RTP-ASE loops ac-quired at rest and stress.
Study III was carried out to examine the value of quantitatively gener-ated parametric perfusion images from RTP-ASE loops, in detecting myocardial ischemia.
In study IV, the usefulness of quantitative detection of myocardial is-chemia from RTP-ASE loops was assessed. Data comparing quantitative measurements of perfusion replenishment from RTP-ASE images at rest and stress were used as markers of ischemia.
The results from the studies in this thesis suggest that visual evaluation of ischemia from RTP-ASE images, using angio-mode as well as high resolution grey scale mode, is accurate and feasible. It is therefore a clini-cally useful method in patients with known or suspected stable CAD. Quantification of ischemia or parametric imaging for ischemia evaluation using Qontrast®, are not yet suitable for clinical use, as judged by the findings of this thesis. However, since further technical development can be expected, quantitative assessment of myocardial perfusion may well be a clinically useful method in the near future.
INTRODUCTION
Echocardiography has become a widespread imaging technique for evaluating morphology and function of the heart and its components. An echocardiographic examination can be performed almost anywhere and anytime since it is a very mobile technique. Echocardiography is associ-ated with an extremely low rate of hazardous events and is relatively in-expensive. Alternative imaging modalities, like X-ray, scintigraphy or magnetic resonance imaging, can sometimes provide better image quality, but are not nearly as mobile techniques. X-ray computer tomography and scintigraphy transmit radioactivity to the patient and most alternative techniques are in most cases more expensive than echocardiography. These are some of the reasons making echocardiography an appealing technique to use and to develop further for an even more widespread use in cardiac disease.
However, there are also limitations of the echocardiographic tech-nique. One is that it demands experienced operators and interpreters in order to obtain both good enough image quality and correct interpreta-tions. There is also, in some patients, low signal to noise ratio of the im-ages, especially from a digital point of view, when post-processing or quantifying findings from the echocardiographic images. Differences in image quality between patients depend on patient composition and, due to high acoustic impedance differences, ribs and lungs might decrease im-age quality.
Basic echocardiographic principles
Echocardiography and ultrasound-based imaging techniques are based on the principle that, an ultrasound signal is partly or completely
re-flected when propagating from one tissue to a tissue with different acous-tic impedance. The reflected ultrasound, the echo, from a specific point is then detected at the source where it was originally sent out. The time de-lay between sending out the ultrasound and receiving the echo is propor-tional to the distance the signal has travelled and, thus, the distance from the source to the point of reflection can be calculated and displayed. The more of the signal that is reflected, the less is continuing further into the tissue and, finally, all of the energy of the ultrasound beam is reflected or absorbed as energy in the tissue. All echoes from different depths of the tissue can be displayed at the corresponding depth of a screen and by sending multiple ultrasound beams simultaneously, a two-dimensional image can be generated. By repeating the procedure, multiple frames can be generated every second and, thus, be presented as moving images of, for example, the heart. Higher signal power (mechanical index [MI]) in-creases image quality, but at the same time the energy transmitted into the tissue increases. However, using MI less than 1.5 is considered to be harmless in adult humans. Increasing MI to higher levels becomes less beneficial since the amount of reflected echo power is proportional to the power of the transmitted signal. Therefore, proportionally more signal power will be reflected as near field reflections and will not contribute as much in the far field as wanted.
Echocardiography in Myocardial ischemia
Echocardiography can be used to evaluate myocardial ischemia in pa-tients with known and suspected coronary artery disease (CAD), using different ways to provoke ischemia in the myocardium. These include physical exercise, dobutamine and dipyridamole infusion, and pacemaker stimulation to increase heart rate (Pozzoli, Fioretti et al. 1991; Marwick, Wil-lemart et al. 1993; Olmos, Dakik et al. 1998; Parodi, Picano et al. 1999; Smart, Bha-tia et al. 2000; Biagini, Schinkel et al. 2005; Bombardini, Agrusta et al. 2005).
In low risk patients with suspected myocardial ischemia, evaluation of ischemia is generally recommended for optimal care and treatment (1997; Erhardt, Herlitz et al. 2002). Ischemia can be assessed by exercise ECG, sin-gle-photon emission computed tomography (SPECT) or dobutamine at-ropine stress echocardiography (DSE), where the two latter are well es-tablished and more accurate methods (Schinkel, Bax et al. 2003; Sozzi, Elhendy
et al. 2003; Picano 2004; Underwood, Anagnostopoulos et al. 2004), although more expensive.
DSE uses wall motion evaluation to detect myocardial ischemia. This is possible since myocardial wall motion during maximum stress increases in normal and decreases in ischemic segments of the myocardium. DSE is however quite strenuous for the patient, because of a relatively long ex-amination time with high heart rate, with or without chest pain.
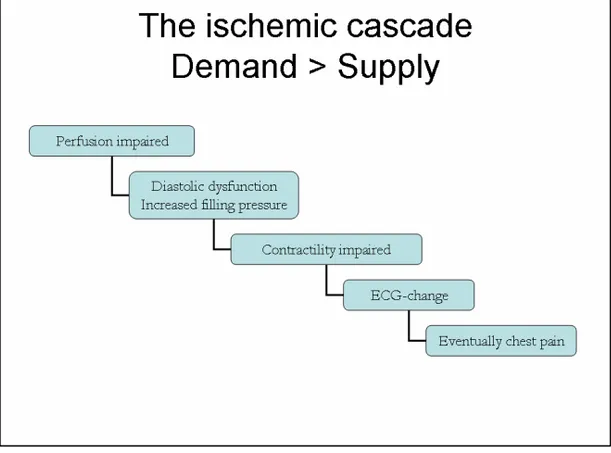
Adenosine stress echocardiography (ASE) can also be used for ischemia evaluation, but demands evaluation of myocardial perfusion to reach similar accuracy for detecting ischemia and can not solely rely on wall motion assessment (Marwick, Willemart et al. 1993; Takeishi, Chiba et al. 1994; Lafitte, Matsugata et al. 2001). Therefore, the best approach in ASE is to inves-tigate myocardial perfusion instead of or in combination with wall motion assessment. This would also bring the ischemia evaluation closer to the origin of ischemia according to the ischemic cascade (Figure 1) (Nesto and Kowalchuk 1987), which is likely to be beneficial to the detection of myo-cardial ischemia. However, visualisation of myomyo-cardial perfusion by
echocardiography has only been possible during the last few years. This was first achieved by administering echocardiographic contrast agents di-rectly into the aortic root and (Kemper, O'Boyle et al. 1983), recently, by in-travenous injection of second generation contrast agents (Kaul 1990; Be-cher, Tiemann et al. 1997; Becher and Burns 2000; Heinle, Noblin et al. 2000; Agati, Funaro et al. 2001; Senior, Villanueva et al. 2004; Janardhanan, Dwivedi et al. 2005).
Echocardiographic contrast agents
The components of blood, including erythrocytes, are very poor reflec-tors of ultrasound. Therefore, it has long been impossible to measure the presence or absence of blood in the ventricular myocardium. It became possible to overcome this problem when second generation contrast agents were developed. After intravenous injection, second generation micro bubbles survive the passage through the lung capillaries and can enter the left ventricle. Consequently, they can also enter the coronary arteries and the myocardial vascular bed. The micro bubbles are encapsu-lated, gas-filled (air or high-molecular-weight gas) micro spheres with a protein or phospholipid shell. They are 2-8 µm in diameter, i.e. as small as or smaller than erythrocytes, and can therefore follow the blood any-where the erythrocytes go.
The micro-bubbles have specific characteristics making them ideal to detect by ultrasound examination. First of all, they reflect ultrasound very well and are, therefore, usually very easy to detect in an ultrasound image. When they are exposed to ultrasound above an amplitude corre-sponding to a MI between 0.1 and 1, they begin to vibrate (resonate) in a way that generates overtones of the original frequency of the reflected trasound signal (second and third harmonics) (figures 2 and 3). If the ul-trasound system is programmed to detect these overtones, technical solu-tions make it possible to differentiate between signals from the tissue and the contrast agent and, consequently, between myocardium and contrast in the myocardium, i.e. myocardial perfusion. However, when the micro-bubbles are exposed to a higher MI than approximately 1, they implode and give rise to one strong harmonic signal. Although this signal is very
easy to detect, each bubble will only produce one signal since it is de-stroyed when generating the signal. This second high MI destructive technique demands intermittent imaging of one frame every second, or up to every 8th
heartbeat, if assessment of myocardial perfusion is the objec-tive. The high MI perfusion technique is quite difficult, since the image Figure 3. Micro-bubble response to different levels of mechanical index (MI)
view has to be contained without the possibility to see the actual image between the image frames. Furthermore, the high MI technique does not allow for evaluation of wall motion, which might be valuable during a stress test.
If the MI is kept low, between 0.1-0.2, the micro bubbles still generate non-linear echoes, which enables differentiation from tissue echoes. Since the bubbles are not destroyed, perfusion replenishment and/or wall mo-tion evaluamo-tion is possible. This low MI technique is in this thesis called real-time perfusion (RTP).
Sonovue® is the second generation contrast agent used in the studies of this thesis. The Sonovue® micro-bubbles consist of a phospholipid monolayer which encapsulate the inert gas sulphur----hexafluoride (SF6).
These bubbles have a mean diameter of 2.5 µm and 90 % of the bubbles are smaller than 8 µm.
There are various techniques for RTP, which differ between manufac-turers, but they all try to differentiate between tissue and contrast and display contrast and, thus, perfusion continuously, without destroying the micro-bubbles.
Contrast agents and safety
Echocardiography is generally an extremely safe method for cardiac examination. However, when a contrast agent is added to the examina-tion there is also some added risk to the patient. The contrast agent Sonovue® showed very good safety in early studies. Nevertheless, after three fatal adverse events in connection with administration of Sonovue®, the safety was recently questioned (Morel, Schwieger et al. 2000; de Groot, van Zwieten-Boot et al. 2004; Dijkmans, Visser et al. 2005). The fatal cases could have been coincidental, since the patients were in poor clinical condition before Sonovue® was given, but the events have resulted in contra-indications for Sonovue® in high-risk patients such as patients with acute coronary syndrome. However, contra-indications do not concern patients with stable CAD, such as those included in the studies performed within this thesis.
Myocardial Contrast Echocardiography (MCE) in myocardial
ischemia
For several reasons, MCE is a promising technique in the context of evaluating myocardial ischemia. It allows the use of several stressors (Kaul, Senior et al. 1997; Lafitte, Matsugata et al. 2001; Olszowska, Kostkiewicz et al. 2003; Mulvagh 2004; Picano 2004; Senior, Lepper et al. 2004; Tsutsui, Xie et al. 2005; Jeetley, Hickman et al. 2006), it can be performed at almost any place anytime since it is a very mobile technique, it is associated with a very low risk of hazardous events, and it is reasonably inexpensive. Therefore, it is worthwhile to further investigate the ability of MCE techniques to detect ischemia.
The various MCE techniques can be roughly classified into two types: (1) The intermittent imaging technique using high MI; and (2) the RTP technique using a low MI. In other studies, both techniques have shown promising results as regards their ability to detect myocardial ischemia (Becher, Tiemann et al. 1997; Kaul, Senior et al. 1997; Heinle, Noblin et al. 2000; Mor-Avi, Caiani et al. 2001; Ronderos, Boskis et al. 2002; Mulvagh 2004; Tsutsui, Xie et al. 2005; Winter, Gudmundsson et al. 2005; Jeetley, Hickman et al. 2006; Ko-rosoglou, Dubart et al. 2006). The principal marker of myocardial ischemia is the reduction of perfusion during stress, as compared with perfusion at rest. Both rest and stress images are based on the replenishment of myo-cardial perfusion during up to ten heartbeats of myomyo-cardial perfusion, following destructive frames of high MI, i.e. above 1.0. Replenishment at stress should be complete after two heartbeats, compared to approxi-mately four heartbeats at rest (Becher and Burns 2000).
Intermittent imaging is possibly a more contrast specific technique. Since it uses high MI, it processes ultrasound signals with higher ampli-tudes and, therefore, probably higher signal to noise ratio. However, as mentioned above, it is a more demanding technique to carry out and it cannot be directly combined with wall motion analysis, which might be of value when comparing stress and rest images. RTP has the benefit of being in real time, which makes the technique somewhat easier to per-form. In addition, by using the same RTP images it can be combined with wall motion evaluation. RTP generates many frames which can be a benefit but also a disadvantage. When interpreting many frames, it may be easier to discard a few frames with poor image quality, which might be beneficial. However, it could also provoke a choice between frames
with signs of ischemia and frames without signs of ischemia, which may make the interpretation somewhat more subjective. The RTP technique should be superior for quantification, because it produces more frames with perfusion information compared to intermittent imaging, which in-creases the statistical power of the calculations. Inversely, RTP has the disadvantage that it shows less contrast specificity, since the power of the ultrasound signals is lower and, consequently, the signal to noise ratio becomes lower. Furthermore the continuous imaging might, regardless of the low MI, still disrupt micro bubbles close to the transducer. This will for example happen if the focal zone is placed in the deeper part of the image sector, because the ultrasound beams then overlap each other
lat-RTP, real-time perfusion.
Power Modulation
The RTP technique used in all studies in this thesis is the Power Modu-lation technique. It is based on the principle that the echoes reflected Figure 4. Principles of RTP power modulation technique.
from contrast bubbles are different from those reflected from tissue, al-lowing these two types of echoes to be accurately differentiated and dis-played.
Two different ultrasound signals are sent out and their echoes are compared. The first signal (S1) has low amplitude and the second signal (S2) has the double amplitude of S1, but still with a low MI (<0.2). The echoes generated by the reflection of S1 are multiplied by two and are, thereafter, subtracted by the received echoes from S2. If the received echo from S1 comes from tissue, it will result in zero amplitude after subtrac-tion by the echo from S2. However, if the received echo from S1 comes from contrast bubbles, it will result in a preserved amount of amplitude after multiplication and subtraction by the S2 echo, since the contrast bubble, due to its specific ultrasound characteristics, has altered the am-plitude of S1 (see also figure 4).
Figure 5. Figure 5.Figure 5.
Figure 5. Patient with apical, anterior perfusion defect at stress (arrows), not present at rest (corresponding left image) in AM (left), HR (right) and SPECT (top).
AM, angio-mode; HR, high resolution grey-scale; SPECT, 99mTc-sestamibi single-photon emission computed tomography.
Two types of power modulation are available; the angio-mode (AM) and the high resolution grey scale (HR). Both are based on the same technique, but, as indicated by the name, HR has a higher pixel resolu-tion compared to AM. On the other hand, AM uses coloured pixels to display contrast in the image, which might be easier to detect in a visual analysis compared to the grey scale contrast presentation used for HR. HR suppresses tissue totally and only displays echoes that power modula-tion identifies as echoes from contrast.
An example of an anterior perfusion defect at stress compared to rest, for AM, HR and SPECT, is demonstrated in figure 5.
From Visual to Parametric and Quantitative MCE.
Visual
Traditionally, echocardiographic perfusion images have been visually evaluated (Becher, Tiemann et al. 1997; Porter, Xie et al. 2001; Winter, Gudmunds-son et al. 2005; Korosoglou, Dubart et al. 2006). In the setting of myocardial ischemia evaluation it has been done by comparing perfusion images at stress with baseline images. If perfusion visually diminishes at stress, that part of the myocardium is considered ischemic.
Parametric, Quantitative, Qontrast
®Visual assessment of RTP-ASE images is subjective and, consequently, user dependent. Therefore, various software programs are being devel-oped for quantification of myocardial perfusion by contrast echocardi-ography. The technical development of these programs is difficult, since echocardiographic images often are of relatively poor quality, from a digital point of view, and since both heart and patient movement has to be dealt with in the most possible automated manner. Studies for quanti-fication of myocardial perfusion, by various methods, have generally shown good accuracy, but a relatively high number of non-interpretable myocardial segments due to poor image quality (Korosoglou, da Silva et al. 2004; Yu, Skyba et al. 2004; Agati, Tonti et al. 2005; Moir, Haluska et al. 2005; Vo-gel, Indermuhle et al. 2005; Malm, Frigstad et al. 2006). Furthermore, echocar-diographic myocardial perfusion quantification is still quite time consum-ing compared to visual assessment of perfusion or wall motion.
Quantitative techniques have shown promising results in animal ex-periments (Lafitte, Higashiyama et al. 2002; Agati, Tonti et al. 2004) and in
hu-mans (Bekeredjian, Hilbel et al. 2003; Korosoglou, da Silva et al. 2004; Peltier, Vancraeynest et al. 2004; Malm, Frigstad et al. 2006). However, there are few studies from clinical settings and most of these have been done with dif-ferent software. If a quantitative echocardiographic technique demon-strated equivalent results to SPECT in detecting myocardial ischemia, it could be an alternative method, more available and without radiation compared to SPECT, more tolerable and swifter than DSE, and more ac-curate than exercise ECG.
Qontrast® (AMID®, Roma, Italy; BraccoTM, Milano, Italy ) is a recently developed and commercially available software, with algorithms that automatically follow the left myocardium contours throughout the car-diac cycle and throughout the replenishment period of the RTP image loop. Since Qontrast® can provide parametric images of myocardial per-fusion, resembling those generated from SPECT, it has the potential to become an user-friendly, available and objective semi-quantitative tool for myocardial ischemia evaluation by RTP-ASE in these patients; para-metric images are easier to understand and differences in perfusion be-tween rest and stress could be more easily detected than in moving RTP replenishment loops. Few studies have investigated the value of paramet-ric images from myocardial contrast stress echocardiograms for the evaluation of myocardial ischemia (Hansen, Bekeredjian et al. 2004; Yu, Skyba et al. 2004; Toledo, Jacobs et al. 2006), and so far, to our knowledge, no study has used Qontrast®.
Qontrast® may also provide a practical way to quantify myocardial perfusion by contrast echocardiography, and has shown promising initial results in both animals and patients with acute myocardial infarction (Agati, Tonti et al. 2004; Agati, Tonti et al. 2005). However, it has not yet been investigated in patients with suspected stable myocardial ischemia.
In this thesis
The first step in this thesis was to test the ability of visual interpreta-tion of RTP-ASE to correctly detect myocardial ischemia, as compared with SPECT, since visual interpretation is the easiest way to interpret RTP images and demands no extra plug-in software. Furthermore, when the first studies of this thesis were performed, quantitative tools were not available at our research laboratory, which was another reason to begin with visual evaluation.
In study I the only RTP-technique accessible was AM. When HR was developed and made available on the Sonos 5500 system, the natural se-quel was to compare this new technique with the existing one, which gave rise to study II.
Visual evaluation has always been questioned due to its subjective na-ture, and rightfully so, since visual ways of interpreting are difficult to pass on from teacher to pupils without drift and misunderstandings. However, the echocardiographic technique is generally largely dependent on visual analysis, not the least when acquiring the images, and so far visual analysis may be reliable enough. Nevertheless, the possibility of quantifying perfusion in echocardiography is warranted and would, if showing good results, take the MCE techniques to a higher status and bring about more widespread use in clinical practise.
Quantification of perfusion from RTP images is, so far, a quite suscep-tible and time-consuming operation. This is partly due to the, from a digitally point of view, low signal to noise ratio and heart movement in the ultrasound images, which demands manual tracings and compensa-tions necessary. If this could be avoided by any quantitative method or software it would make it more useful in clinical practice where time of-ten is an issue. Since Qontrast® uses automatic methods for parametric imaging, we hypothesized that this software could provide a feasible and swift tool for accurate detection of myocardial ischemia. This lead to study III, in which parametric images of RTP at rest and stress, generated through Qontrast®, were the base of ischemia interpretation.
Study III still contains a visual and, therefore, subjective component, although diminished through quantitative processing in Qontrast®, namely the visual evaluation of different grades of colours at stress com-pared to rest. To test if Qontrast® could adequately quantify perfusion, compared to SPECT and compared to visual interpretation like in study I, we carried out study IV. This way of using Qontrast® is more time-consuming than the ischemia evaluation used in study III, and thereby less clinically appealing. However, since it is purely quantitative it is less questionable and, if results were to be favourable enough, study IV could potentially prove Qontrast® to be comparable to SPECT in detecting myocardial ischemia. Furthermore, positive results in study IV could, if similar, confirm results in study III.
Method of reference
SPECT was chosen as method of reference in this thesis since it, similar to RTP-ASE, evaluates perfusion. However, data indicates that RTP might be more sensitive to myocardial ischemia than SPECT due to its higher spatial resolution (Tiemann, Ghanem et al. 2001; Hagendorff, Pfeiffer et al. 2003; Senior, Lepper et al. 2004). Therefore, SPECT might not be the ideal gold standard. In work performed by other groups, MCE methods have been compared with other scintigraphic methods, such as Thallium (Oraby, Hays et al. 2002; Bekeredjian, Hilbel et al. 2003), as well as with coro-nary angiography (Moir, Haluska et al. 2005; Winter, Gudmundsson et al. 2005; Malm, Frigstad et al. 2006) and even with some combinations of both SPECT and coronary angiography (Olszowska, Kostkiewicz et al. 2003; Jeetley, Hickman et al. 2006; Korosoglou, Dubart et al. 2006; Malm, Frigstad et al. 2006). Coronary angiography might have added information that could possibly have contributed to explain differences in the results between RTP-ASE and SPECT. However, coronary angiography was not possible to per-form within the present study protocol, mostly due to ethical reasons, and still, SPECT is at least theoretically more appealing as method of ref-erence since evaluation of myocardial perfusion is the objective of the in-vestigations.
Furthermore SPECT has shown excellent prognostic value (Underwood, Anagnostopoulos et al. 2004) and if RTP-ASE were to show equivalent re-sults, it could be an alternative method, more available and without ra-diation compared to SPECT, more tolerable and swifter than DSE and more accurate than exercise ECG.
Considering its safety, feasibility and accessibility, RTP-ASE has the potential of becoming the method of choice to confirm or discard myo-cardial ischemia, if proven sufficiently accurate compared to SPECT. Therefore, it was felt that it would be worthwhile to investigate RTP-ASE further in this context.
AIMS
The aims of this thesis were
I. To prospectively investigate the ability of RTP-ASE with visual estima-tion to detect myocardial ischemia, in comparison with 99mTc-sestamibi SPECT, in unselected patients referred to SPECT due to sus-pected or known stable myocardial ischemia.
II. To compare the two power modulation techniques, AM and HR, dur-ing RTP-ASE, for the detection of myocardial ischemia, as compared with 99mTc-sestamibi SPECT, in unselected patients referred to SPECT due to suspected or known stable myocardial ischemia.
III. To examine the value of RTP-ASE with Qontrast®-generated paramet-ric images for the evaluation of myocardial ischemia, using SPECT as reference, in unselected patients referred to SPECT due to suspected or known stable myocardial ischemia.
IV. To examine if RTP-ASE with Qontrast® quantification can be used to correctly evaluate myocardial ischemia, as compared with visual evaluation of ischemia by RTP-ASE, as well as with SPECT, in unse-lected patients referred to SPECT due to suspected or known stable myocardial ischemia.
MATERIAL AND METHODS
Patients
All patients in studies I-IV were randomly included patients admitted to adenosine SPECT evaluation of known or suspected stable coronary artery disease. They were all prospectively asked to participate in the studies and written informed consent was obtained from all participating patients. The institutional ethics committee of Lund University, Sweden, approved the studies.
Some patients are included in all studies, but only studies III and IV comprise the exact same cohort. One patient in study I chose not to par-ticipate. In study I, one of the remaining 34 patients had non-interpretable echocardiography images, both regarding wall motion and perfusion, and was therefore excluded from the comparison with SPECT. In study II, one of the 51 included patients had non-interpretable echo-cardiography images, both regarding wall motion and perfusion, and was therefore excluded from the study.
Two of the 69 patients eligible for inclusion in studies III and IV were excluded since they had visually non-interpretable echocardiography im-ages.
Baseline characteristics of the patients in study I-IV are presented in Table 1.
Echocardiographic equipment
The echocardiographic equipment used in all four studies was a Sonos 5500 (Philips, Andover, MA, USA) with S3 probe. RTP using the power modulation AM was used in all studies and in study II power modulation
HR was also used. Both power modulation RTP software are commer-cially available as an option in the Sonos 5500 system.
Table 1. Characteristics of patients in studies I-IV.
LVEF, left ventricular ejection fraction; AMI, acute myocardial infarc-tion; PCI, percutaneous coronary interveninfarc-tion; CABG, coronary artery bypass grafting; ACE, angiotensin converting enzyme; ARB, angiotensin-receptor blocker; WMA, wall motion abnormality; PD, perfusion defect.
Study protocol
Patients in all studies were examined in a left lateral recumbent posi-tion. The second-generation contrast agent Sonovue®
was infused in the left decubital vein using an infusion pump dedicated for this purpose (VueJect®
Esaote, Genova, Italy; BraccoTM
, Milano, Italy), which auto-matically rotates the syringe to prevent sedimentation. The infusion rate of Sonovue was set between 1.0 and 1.3 ml/min (Becher and Burns 2000). Adenosine and echo contrast were infused in the same peripheral venous catheter, using a separate infusion pump through a three-way tap.
60 % 7 % (n=43) 33 % (n=43) 13 % 93 % 18 % 27 % 25 % 57 % 12 % 28 % 57 % 0 % 48 % 13 % 13 % 19 % 40 % 54 (±11) % 33 % 68 (±10) Study III and IV
(n=67) 60 % 6 % (n=31) 31 % (n=29) 10 % 92 % 24 % 29 % 28 % 60 % 14 % 28 % 54 % 0 % 54 % 12 % 16 % 22 % 40 % 55 (±9) % 36 % 70 (±8) Study II (n=50) Study I (n=33) 52 % Regional WMA/PD at rest
19 % (n=21) Significant valvular disease
41 % (n=22) Dilated left atrium
21 % Dilated left ventricle
94 % Sinus rhythm
6 % Calcium blocker use
21 % Diuretic use
27 % Nitrate use (long acting)
54 % Nitro-glycerine use (short acting)
9 % ARB use
33 % ACE inhibitor use
54 % Beta-blocker
0 % Previous valvular surgery
36 % History of hypertension
21 % History of heart failure
15 % Previous CABG 18 % Previous PCI 42 % Previous AMI 52 (±12) % LVEF at rest 33 % Male (sex) 66 (±11) Age (years) 60 % 7 % (n=43) 33 % (n=43) 13 % 93 % 18 % 27 % 25 % 57 % 12 % 28 % 57 % 0 % 48 % 13 % 13 % 19 % 40 % 54 (±11) % 33 % 68 (±10) Study III and IV
(n=67) 60 % 6 % (n=31) 31 % (n=29) 10 % 92 % 24 % 29 % 28 % 60 % 14 % 28 % 54 % 0 % 54 % 12 % 16 % 22 % 40 % 55 (±9) % 36 % 70 (±8) Study II (n=50) Study I (n=33) 52 % Regional WMA/PD at rest
19 % (n=21) Significant valvular disease
41 % (n=22) Dilated left atrium
21 % Dilated left ventricle
94 % Sinus rhythm
6 % Calcium blocker use
21 % Diuretic use
27 % Nitrate use (long acting)
54 % Nitro-glycerine use (short acting)
9 % ARB use
33 % ACE inhibitor use
54 % Beta-blocker
0 % Previous valvular surgery
36 % History of hypertension
21 % History of heart failure
15 % Previous CABG 18 % Previous PCI 42 % Previous AMI 52 (±12) % LVEF at rest 33 % Male (sex) 66 (±11) Age (years)
Adenosine was given at an infusion rate of 100 µg/kg/min during one minute, after which the infusion rate was increased to 140 µg/kg/min.
Infusion of adenosine in studies III and IV had minor but significant ef-fects on both heart rate and blood pressure, where heart rate increased from 72 ± 14 to 82 ± 14 (p<0.001), systolic blood pressure fell from 133 ± 20 to 127 ± 20 (p<0.001) and pulse-pressure product increased from 9.65 ± 2.32 k to 10.44 ± 2.57 k (p<0.001). Only minor side-effects oc-curred and no stress-test had to be interrupted due to side-effects. At SPECT 18 patients (27%) were ischemic with a total of 19 ischemic terri-tories, 10 left anterior descending (LAD) territerri-tories, 5 left circumflex (LCx) territories and 4 right coronary artery (RCA) territories.
All patients underwent RTP imaging (mechanical index=0.1) during in-fusion of echo contrast, at rest and after a minimum of one minute of hy-peraemia during adenosine stress (at 140 µg/kg/min). Image acquisition was started after at least one minute of Sonovue® infusion. RTP image loops containing 8-10 heartbeats were collected from the parasternal long-axis and apical four- and two-chamber views, respectively. At the beginning of each loop a destruction impulse of 10 high mechanical index frames (mechanical index=1.5) was given to destroy all contrast micro bubbles in the myocardium (Bahlmann, McQuillan et al. 2002).
In all studies, during RTP AM, the AM gain was set at between 60 and 70%, depending on what was suitable for the individual patient as judged by a visual on-line assessment, and 2D greyscale gain was set at zero. During RTP HR (only in study II) the greyscale gain was set be-tween 90 and 95%, depending on what was suitable for the individual patient, as judged by a visual on-line assessment. Focus was set close to the base of the left ventricle. All images were stored digitally for later off-line analysis.
Real-time perfusion interpretation
All of the different interpretations were made at different time-points blinded to the results of any other interpretation.
Visual RTP-ASE interpretation
Image interpretation was performed off line, analyzing myocardial per-fusion and wall motion by RTP-ASE, using the EnConcert Image
Diagno-sis Application (Philips, Andover, Massachusetts). A separate analyDiagno-sis ex-clusively of perfusion was also made for both AM and HR to estimate the value of sole perfusion analysis.
Each segment was attributed to one of the three main coronary vessel areas of interest; the LAD; the LCx; and the RCA (Figure 8). Myocardial ischemia was visually evaluated comparing rest and stress images, using both perfusion and wall motion analysis in a complementary manner. A visually detected perfusion defect during stress was used as the principal marker of ischemia. Thus, a myocardial segment was considered ischemic if perfusion was impaired in the stress images, compared to the rest im-ages (Lafitte, Matsugata et al. 2001). Perfusion defects were analysed at the earliest four beats following the destruction impulse at rest and after two beats at peak stress.
Wall motion was used in addition to reveal perfusion defect artefacts at rest and to evaluate segments with suspected perfusion artefacts at stress (A detailed description of perfusion artefact assessment and wall motion analysis is given later, in a separate section). Since perfusion can be decreased without a decrease in wall motion in ASE, the use of solitary wall motion analysis in segments with perfusion artefacts might decrease the sensitivity with regard to ischemia. However, this complementary use of wall motion analysis increases the number of interpretable segments without negatively affecting specificity (Winter, Gudmundsson et al. 2005).
Parametric RTP-ASE evaluation
Parametric images from rest and adenosine stress were generated from contrast replenishment RTP loops using Qontrast® as follows: Two points were manually placed in the left ventricular cavity of the perfusion images. The first point was placed in the centre of the cavity where the apex “half-circle” ends, i.e. approximately two thirds from the base of ventricle, where it was always inside the cavity (never in the myocardium) during the complete loop. The point was placed in a cavity area that was fully opacified directly after the destruction impulse in the beginning of the loop, as well as throughout the entire RTP-loop, since this formed the basis of the maximum image contrast intensity reference-point. Any iso-lated frames not fulfilling these criteria were excluded from analysis. The second point was placed at the base of the ventricle, enabling the soft-ware to automatically outline the complete left ventricle, including both
cavity and myocardium, with dotted “M-mode” lines crossing perpen-dicular through the myocardial wall (Figure 6).
Figure Figure Figure
Figure 666.... Manually placed points to enable an automatic outline of the 6 complete left ventricle, including both cavity and myocardium, before automated Qontrast®
perfusion analysis.
The first frame was selected to be the one directly after destruction im-pulse frames. Automatic perfusion analysis was then started. Qontrast®
uses an advanced image processing technique that allows identification of the dynamic image sequence coherence in a space-time domain. The tech-nique enables tracking of the myocardial pixel movement throughout the cardiac cycle and the entire RTP-loop. This increases the accuracy of the perfusion evaluation compared to triggered imaging, due to the higher number of quantifiable frames. Three parametric images were then auto-matically generated from the perfusion analysis, displaying either the peak signal intensity (A), myocardial blood flow velocity (β) or myocar-dial blood flow (Axβ). These were generated for each pixel, from the re-plenishment curve of each pixel, according to the standard curve A=A(1-e-βt
). Each of the parametric images could be displayed using a different number of colours (4, 8 or full), where more colours corresponded to
more levels between zero and 100% with regard to A, β or Axβ. Exam-ples of the different parametric images are shown in Figure 7.
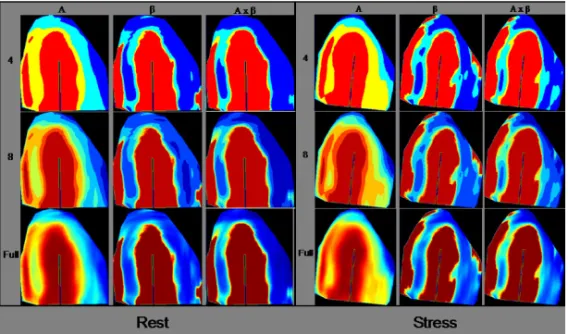
Fi Fi Fi
Figure gure gure gure 777.... Parametric images of A, 7 β, Axβ in different map segmentations, 4, 8 and full number of colours. Example with images at rest and stress. A, peak signal intensity; β, myocardial blood flow velocity; Axβ, myocar-dial blood flow.
In the parametric images, the left ventricle was divided into 17 seg-ments (Cerqueira, Weissman et al. 2002). Each segment was attributed to one coronary territory of interest, corresponding to the LAD, LCx and RCA arteries (Figure 8). Images at rest were compared with those at stress to evaluate ischemia. The respective map segmentations (4, 8, full) were evaluated at different time-points, blinded to the result of other map segmentations and to the result of the SPECT examination. Parametric images of A, β and Axβ for the same map segmentation were evaluated at the same time.
For each segment and each parametric parameter (A, β and Axβ), dif-ferences between rest and stress were given a value between one and five: 1) a large negative colour difference, i.e. an area change >1/3 of the ment; 2) a small negative difference, i.e. an area change <1/3 of the seg-ment; 3) no difference; 4) a small positive difference, i.e. an area change <1/3 of the segment; and 5) a large positive difference, i.e. an area change
>1/3 of the segment. Accordingly, the lower the score, the more ischemic was the segment.
Figure Figure Figure
Figure 888.... Distribution territories of the three main coronary arteries in a 8 17 segment model. Left anterior descending (LAD), left circumflex (LCx) and right coronary artery (RCA).
Three different types of analyses were made from the parametric ischemic scores, for each of the map segmentations:
1. WCS – “Worst case scenario”: The lowest score of a variable (i.e. A, β or Axβ) in any segment belonging to a coronary distribution territory (i.e. LAD, LCx or RCA), was considered the correct score for that territory.
2. SUM – “Sum of worst case scenario”. To reduce the individual value of A, β and Axβ, their respective WCS scores were added together. This new score could consequently have a value be-tween 3 and 15. This summation procedure decreases the effect on the ischemia evaluation of artefacts originating from one spe-cific parametric variable.
3. SoftSUM – “Soft case scenario summation”. Since echocardi-ography is known to have higher spatial resolution than SPECT, which could lead to false positive rulings of ischemia by RTP-ASE, a third analysis was made to diminish the influence of a sin-gle segment score. Within a certain coronary territory, the mean
6 12 13 17 15 9 3 5 11 16 17 14 8 2 1 7 4 10 LAD12, 13, 15, 17 LCx9, 3 RCA6 LAD2, 8, 14, 16, 17 RCA5, 11 LAD1, 7 LCx4, 10 Four chamber view Two chamber view Long axis view
of all segments’ A, β, Axβ-summations was calculated. The SoftSUM could, accordingly, also have a score between 3 and 15.
Quantitative RTP-ASE analysis
The pure quantitative analysis used in study IV was carried out by tracing parametric images that were generated in the same fashion as in study III, from RTP images in apical four- and two-chamber and parast-ernal long-axis view, at rest and stress, respectively.
Figure 9. Figure 9. Figure 9.
Figure 9. Tracings of coronary territories of interest in four-chamber (middle), two-chamber (left) and long-axis (right) views. LAD, left ante-rior descending; LCx, left circumflex; RCA, right coronary artery.
To acquire quantitative values of A, β and Axβ, region of interests were manually traced both at rest and stress, corresponding to the distri-bution territories of the three main coronary arteries; LAD, LCx and RCA (figure 9). Since earlier studies indicated that β is the most sensitive quantitative parameter (Moir, Haluska et al. 2005; Malm, Frigstad et al. 2006), special care was taken that the tracing would align correctly in the para-metric β image, avoiding red areas, which correspond to contrast in the left ventricular cavity or could be perfusion artefacts origin from main coronary arteries. Red areas in the β image could also be caused from mathematically generated high β-values due to very low A-values, which predominantly could occurs in rest images where the A-values can be low for physiological reasons.
Comparing A, β and Axβ values at rest and stress (hyperaemia), the corresponding reserve values (A-r; β-r and Axβ-r) were derived by divid-ing the stress value with the matchdivid-ing rest value, thus resembldivid-ing invasive measurement of coronary flow reserve. Accordingly, this generated three A-r, β-r, and Axβ-r values from the LAD territory, originating from the three different echocardiographic views (from four- and two-chamber, and long-axis views), two reserve values each from the LCx territory (from four-chamber and long-axis views) and two from the RCA terri-tory (from four- and two-chamber views). The lowest A-r, β-r and Axβ-r value from any of the views corresponding to a coronary territory was selected for the ischemia comparison with SPECT, since the lowest re-serve value should originate from the most ischemic or the least perfused territory.
Perfusion artefacts and non-interpretable territories
In all studies, a visual judgment of the RTP-loops was done with re-gard to perfusion artefacts. In studies III and IV, there was also a judg-ment of the parametric images, which could result in additional non-interpretable territories.
Artefacts from visual judgment of RTP-loops.
Wall motion was used to reveal perfusion defect artefacts at rest and to evaluate segments with suspected perfusion artefacts at stress. Since wall motion should not be normal if a segment has a true perfusion defect at rest, a perfusion defect at rest was considered to be an artefact when wall motion was normal in that segment. A perfusion defect at peak stress was considered to be an artefact if there was a suspicion of a perfusion arte-fact, such as lateral or anterior shadowing from ribs or lungs, or basal segments shadowed by contrast. In such segments, the ischemic evalua-tion was based on wall moevalua-tion analysis alone. If wall moevalua-tion decreased at stress compared to rest images, the segment was considered ischemic. Since perfusion can be decreased without a decrease in wall motion in ASE, the use of solitary wall motion analysis in segments with perfusion artefacts might decrease the sensitivity with regard to ischemia. However, this complementary use of wall motion analysis increases the number of interpretable segments without negatively affecting specificity (Winter, Gudmundsson et al. 2005).
Non-interpretable territories by judgment of Qontrast®
parametric im-ages.
In the quantitative analysis, territories were considered non-interpretable using the Qontrast® software due to low parametric image quality, which made it too difficult to differentiate the left ventricular myocardium from the cavity. A coronary territory could also be consid-ered non-interpretable if the manual placement of cavity points in Qon-trast® could not be placed as predefined in the left ventricular cavity.
SPECT
The rest and stress studies were performed using a 2-day protocol, starting with injection of 600 MBq 99mTc-tetrofosmin at stress. The stress examination was performed simultaneous with the RTP-ASE ex-amination. Normal findings at stress were not followed by a rest study. Pathological stress studies were followed by a rest study with injection of 800 MBq 99mTc-tetrofosmin. A five-minute adenosine infusion protocol was used. Starting the infusion with 100 µg/ml/min of adenosine for 1 minute, the dose was then increased to 140 µg/ml/min for two minutes before injecting 99mTc-tetrofosmin. Infusion of adenosine was continued for 2 min after the injection of 99mTc-tetrofosmin. The scintigraphic data were acquired one hour after the end of the stress test, using con-tinuous SPECT over 180 degree elliptical rotation from the 45 degree right anterior oblique position, with a dual-head gamma camera (Siemens AG Medical Solutions, Erlangen, Germany). Low energy high-resolution collimator and a zoom factor of 1.0 were used. We obtained 64 tions in a 128x128 matrix, with an acquisition time of 20 s per projec-tion. Tomographic reconstruction and calculation of short axis slice im-ages were performed using Siemens software. A two-dimensional Butter-worth pre-reconstruction filter was used with critical frequency of 0.35, order 5. For each patient, the same sets of short axis slices were then processed with an automatic software package (4D-MSPECT) on a Sie-mens e.soft workstation. The software package defined apex and base and generated, coronal, longitudinal, sagital tomographic slices as well as polar maps with schematic map of the territories of the main coronary arteries used for scoring. Radiotracer uptake of the vascular segments were scored visually and stress images were compared with rest images
regarding ischemia and infarct. The specialist in nuclear medicine who performed the scoring was blinded to the results of the RTP analysis.
STATISTICS
All statistical analyses were performed using The SPSS®
(Version 12.0.1 or 14.0, Chicago, IL, USA) statistical program.
Power calculations in all studies were based on a sensitivity and speci-ficity between 80 and 90 % of the methods used. We assumed a sensitiv-ity and specificsensitiv-ity of 85% in the study. With 30 patients we would have a 95% confidence interval of ± 13 %, with 50 patients ± 10 % and with 100 patients ± 7% around sensitivity and specificity.
Method of reference for the ischemia evaluation in the studies was the presence or absence of reversible ischemia at the SPECT examination. Results are expressed as mean ± SD and as percent. P<0.05 denoted sta-tistical significance.
Calculations of sensitivity and specificity, positive and negative predic-tive values (PPV, NPV), as well as accuracy and Kappa values in the three predefined distribution areas of the three main coronary vessels were per-formed in all studies.
In study II, the chi-squared test was used to assess differences between AM and HR.
In studies III and IV, receiver operating characteristic (ROC) curves were used to examine and compare predictive ability of different para-metric variables, by calculating sensitivity, specificity, accuracy and area under the curve.
In study IV, the unpaired t-test was used to test for differences between patients. For intra-assay variability of quantitative measurements of A and β, coefficient of variation was used.
SUMMARY OF RESULTS
Paper I
Of 102 coronary territories assessed, 99 (97%) were considered inter-pretable. These 99 territories were analysed both using SPECT and RTP. The overall level of agreement between RTP-ASE and SPECT in detecting ischemia was 92% in all segments with a Kappa value of 0.67. The level of agreement was 97 % in LCx, 91 % in RPD and 88 % in LAD seg-ments. Accuracy, sensitivity, specificity, predictive values and Kappa val-ues for the detection of myocardial ischemia of RTP-ASE compared to SPECT are shown in Table 2.
Table Table Table
Table 2222.... Accuracy, positive (PPV) and negative (NPV) predictive values, sensitivity, specificity and Kappa values of RTP-ASE using SPECT as method of reference.
LAD, left anterior descending coronary artery; LCx, left circumflex ar-tery; RPD, right posterior descending coronary artery, ***=p<0.001, ns=not significant. -0.042 ns 0.89*** 0.64*** 0.67*** Kappa 94 96 89 93 Specificity (%) 0 100 83 83 Sensitivity (%) 97 100 96 98 NPV (%) 0 83 63 63 PPV (%) 91 97 88 92 Accuracy (%) RPD (n=33) LCx (n=33) LAD (n=33) Any territory (n=99) -0.042 ns 0.89*** 0.64*** 0.67*** Kappa 94 96 89 93 Specificity (%) 0 100 83 83 Sensitivity (%) 97 100 96 98 NPV (%) 0 83 63 63 PPV (%) 91 97 88 92 Accuracy (%) RPD (n=33) LCx (n=33) LAD (n=33) Any territory (n=99)
Perfusion artefacts were present in 35 (35%) segments at rest and in 24 (24%) segments at peak. Of the 59 segments with artefacts, 34 (58%) were located in basal parts of the left ventricle in apical views, and 23 (68%) of these 34 basal segments had artefacts at rest.
Wall motion was non-decisive with regard to ischemia evaluation in a segment with a perfusion artefact at rest if the perfusion at stress was normal, since normal perfusion at stress is not consistent with ischemia.
Results regarding perfusion artefacts are summarised in Table 3. In 26 (44%) of the segments with perfusion artefacts, wall motion was decisive for the ischemia evaluation; two at rest and 24 at peak. Wall motion was decisive in two segments at rest, since perfusion defects in these two seg-ments were observed both at rest and during hyperaemia. The perfusion defect at rest was considered to be an artefact due to normal wall motion at rest, since wall motion should not be normal if a segment has a true perfusion defect at rest. Hence, when perfusion and/or wall motion was impaired during stress the segment was judged ischemic despite un-changed impaired perfusion. The ischemic evaluation was in accordance with SPECT in 25 (96%) of these 26 segments. In 23 (88%) of the 26 segments, wall motion correctly acquitted segments from ischemia.
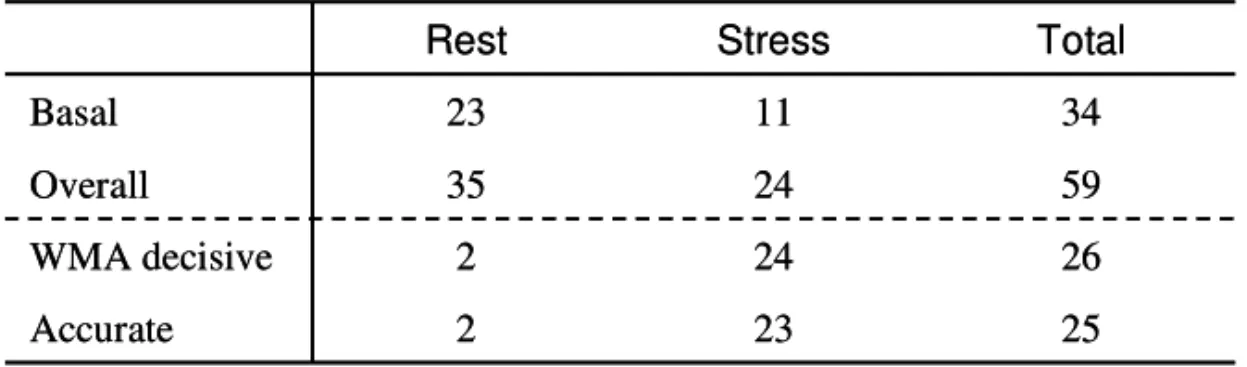
Table Table Table
Table 333.... Perfusion artefacts characteristics. 3
WMA, wall motion analysis
On a patient basis (n=33), the ischemic evaluation with RTP-ASE showed an accuracy of 91% with sensitivity, specificity, PPV and NPV of 78%, 96%, 88% and 92%, respectively. Total Stress Rest 25 23 2 Accurate 26 24 2 WMA decisive 59 24 35 Overall 34 11 23 Basal Total Stress Rest 25 23 2 Accurate 26 24 2 WMA decisive 59 24 35 Overall 34 11 23 Basal
Paper II
Of 150 coronary areas assessed, all were considered interpretable and were analysed both using SPECT and RTP with AM and HR. The overall level of agreement between RTP-ASE and SPECT in detecting ischemia was 93% for AM and 96% for HR. The chi-squared test for difference between AM and HR in correctly judging ischemia was borderline-significant (p=0.08). The Kappa values were 0.67 for AM and 0.75 for HR (p<0.001). Accuracy, sensitivity, specificity, predictive values and Kappa values for the detection of myocardial ischemia of RTP-ASE AM and HR compared to SPECT are shown in Table 4. HR generally showed somewhat higher values for kappa, accuracy, positive prediction and specificity, whereas AM showed higher sensitivity values. The NPVs were similar. The same comparative values for the sole perfusion interpretation concerning AM and HR compared to SPECT are displayed in Table 5, demonstrating differences similar to the combined perfusion and wall motion analysis. Accuracy and Kappa values for the agreement between AM and HR are shown in Table 6, indicating lesser agreement between AM and HR than for their respective comparison with SPECT.
tion analysis. Accuracy, PPV, NPV sensitivity, specificity and Kappa of RTP-ASE using SPECT as method of reference.
1.00*** 0.65*** 0.56*** 0.78*** 0.75*** Kappa HR 100 98 95 97 98 Specificity (%) HR 100 67 57 78 77 Sensitivity (%) HR 100 98 93 92 98 NPV (%) HR 100 67 67 91 77 PPV (%) HR 100 96 90 92 96 Accuracy (%) HR 0.85*** 0.64*** 0.63*** 0.72*** 0.67*** Kappa AM 100 94 86 87 93 Specificity (%) AM 75 100 100 92 92 Sensitivity (%) AM 98 100 100 97 99 NPV (%) AM 100 50 54 71 57 PPV (%) AM 98 94 88 88 93 Accuracy (%) AM RPD (n=50) LCx (n=50) LAD (n=50) Patient (n=50) All CA (n=150) 1.00*** 0.65*** 0.56*** 0.78*** 0.75*** Kappa HR 100 98 95 97 98 Specificity (%) HR 100 67 57 78 77 Sensitivity (%) HR 100 98 93 92 98 NPV (%) HR 100 67 67 91 77 PPV (%) HR 100 96 90 92 96 Accuracy (%) HR 0.85*** 0.64*** 0.63*** 0.72*** 0.67*** Kappa AM 100 94 86 87 93 Specificity (%) AM 75 100 100 92 92 Sensitivity (%) AM 98 100 100 97 99 NPV (%) AM 100 50 54 71 57 PPV (%) AM 98 94 88 88 93 Accuracy (%) AM RPD (n=50) LCx (n=50) LAD (n=50) Patient (n=50) All CA (n=150)
AM, angio-mode; HR, high resolution; PPV, positive predictive value; NPV, negative predictive value; CA, coronary area; LAD, left anterior de-scending coronary artery; LCx, left circumflex artery; RPD, right posterior
mo-Table 5. Table 5. Table 5.
Table 5. RTP-ASE AM versus HR using solitary perfusion analysis. Accu-racy, PPV, NPV, sensitivity, specificity and Kappa of RTP-ASE using SPECT as method of reference.
AM, angio-mode; HR, high resolution; PPV, positive predictive value; NPV, negative predictive value; CA, coronary area; LAD, left anterior de-scending coronary artery; LCx, left circumflex artery; RPD, right poste-rior descending coronary artery, ***=p<0.001.
fusion and wall motion analysis, and using solitary perfusion analysis.
AM, angio-mode; HR, high resolution; CA, coronary area; LAD, left ante-rior descending coronary artery; LCx, left circumflex artery; RPD, right pos-terior descending coronary artery; RTP, real time perfusion; WM, wall mo-tion; **=p<0.01; ***=p<0.001. 1.00*** 0.66*** 0.69*** 0.87*** 0.78*** Kappa HR 100 100 95 97 98 Specificity (%) HR 100 50 80 90 80 Sensitivity (%) HR 100 98 97 97 98 NPV (%) HR 100 100 67 90 80 PPV (%) HR 100 98 93 95 97 Accuracy (%) HR 0.63*** 0.63*** 0.50*** 0.68*** 0.58*** Kappa AM 96 91 78 81 89 Specificity (%) AM 75 100 100 92 92 Sensitivity (%) AM 98 100 100 96 99 NPV (%) AM 60 50 43 71 48 PPV(%) AM 94 92 81 85 89 Accuracy (%) AM RPD (n=48) LCx (n=42) LAD (n=44) Patient (n=39) Any CA (n=134) 1.00*** 0.66*** 0.69*** 0.87*** 0.78*** Kappa HR 100 100 95 97 98 Specificity (%) HR 100 50 80 90 80 Sensitivity (%) HR 100 98 97 97 98 NPV (%) HR 100 100 67 90 80 PPV (%) HR 100 98 93 95 97 Accuracy (%) HR 0.63*** 0.63*** 0.50*** 0.68*** 0.58*** Kappa AM 96 91 78 81 89 Specificity (%) AM 75 100 100 92 92 Sensitivity (%) AM 98 100 100 96 99 NPV (%) AM 60 50 43 71 48 PPV(%) AM 94 92 81 85 89 Accuracy (%) AM RPD (n=48) LCx (n=42) LAD (n=44) Patient (n=39) Any CA (n=134) 0.54*** 0.37** 0.43** 0.52** 0.47*** Kappa 94 91 78 77 88 Agreement (%) Sole RTP 0.85*** 0.64*** 0.43** 0.51*** 0.61*** Kappa 98 94 82 80 92 Agreement (%) RTP + WM RPD (n=50) LCx (n=50) LAD (n=50) Patient (n=50) Any CA (n=150) 0.54*** 0.37** 0.43** 0.52** 0.47*** Kappa 94 91 78 77 88 Agreement (%) Sole RTP 0.85*** 0.64*** 0.43** 0.51*** 0.61*** Kappa 98 94 82 80 92 Agreement (%) RTP + WM RPD (n=50) LCx (n=50) LAD (n=50) Patient (n=50) Any CA (n=150)
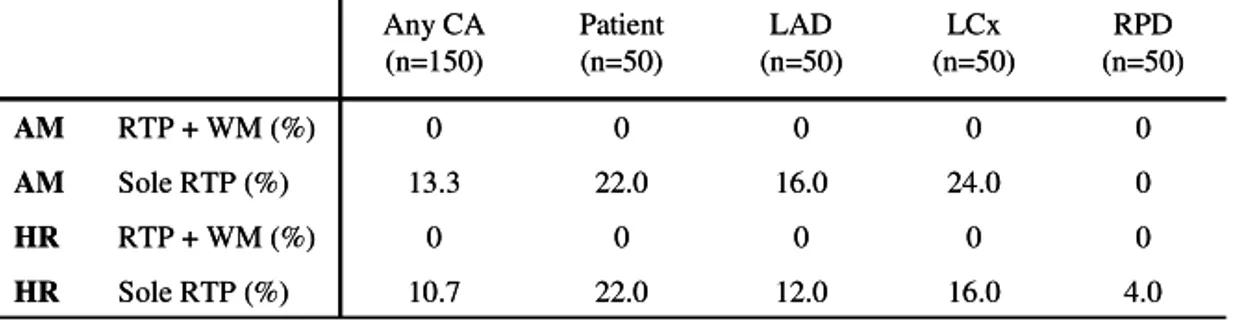
per-In Table 7, the numbers of non-interpretable coronary areas are pre-sented. In the sole perfusion analysis the numbers include coronary areas considered to be perfusion artefacts. There is evidence of similar loss of interpretable coronary areas for both AM and HR.
Table Table Table
Table 777.... Non-interpretable coronary areas for RTP-ASE AM and HR, 7 with combined perfusion and wall motion analysis, and solitary perfusion analysis.
AM, angio-mode; HR, high resolution; CA, coronary area; LAD, left an-terior descending coronary artery; LCx, left circumflex artery; RPD, right posterior descending coronary artery; RTP, real time perfusion; WM, wall motion.
Paper III
Of the 201 coronary distribution territories, 31 (15%) could not be analysed by echocardiography due to perfusion artefacts.
The results of the ischemia analysis based on the Qontrast®-generated parametric images are summarised in tables 8, 9 and 10. Cut-off values were chosen to obtain the most optimal sensitivity and specificity. Accu-racy, sensitivity and specificity were only calculated for variables showing significant area under the curve. Of the different parametric variables, β and Axβ showed the highest values for area under the curve, kappa and accuracy. Significant results were found when all coronary territories were analysed and predominantly in the LAD territory.
4.0 16.0 12.0 22.0 10.7 Sole RTP (%) HR 0 0 0 0 0 RTP + WM (%) HR 0 24.0 16.0 22.0 13.3 Sole RTP (%) AM 0 0 0 0 0 RTP + WM (%) AM RPD (n=50) LCx (n=50) LAD (n=50) Patient (n=50) Any CA (n=150) 4.0 16.0 12.0 22.0 10.7 Sole RTP (%) HR 0 0 0 0 0 RTP + WM (%) HR 0 24.0 16.0 22.0 13.3 Sole RTP (%) AM 0 0 0 0 0 RTP + WM (%) AM RPD (n=50) LCx (n=50) LAD (n=50) Patient (n=50) Any CA (n=150)
Table Table Table
Table 8888.... Worst case scenario. Results for the respective map segmenta-tion and the different parametric values, A, peak signal intensity, β, myo-cardial blood flow velocity and Axβ, myocardial blood flow.
MS, map segmentation; PV, parametric value; F, Full; Sens, sensitivity; Spec, specificity; Acc, accuracy; PPV, positive predictive value; NPV, negative predictive value; AUC, area under the curve; *=p<0.05; **=p<0.01; ***=p<0.001; NS, not significant. Grey tone represent NS.
MS PV Coronary Territory Sens (%) Spec (%) Acc (%) PPV (%) NPV (%) kappa AUC 4 A All 84 47 80 24 94 0.22** 0.66 * 4 A LAD 80 67 78 40 93 0.37** 0.77 * 4 A LCx 0.45 NS 4 A RCA 0.60 NS 4 β All 71 82 72 24 97 0.25*** 0.80 *** 4 β LAD 62 100 59 29 100 0.26** 0.81 ** 4 β LCx 0.73 NS 4 β RCA 0.78 NS 4 Axβ All 77 71 75 25 96 0.25*** 0.77 *** 4 Axβ LAD 62 89 65 31 97 0.28** 0.77 * 4 Axβ LCx 0.73 NS 4 Axβ RCA 0.74 NS 8 A All 44 82 82 21 92 0.14 NS 0.67 * 8 A LAD 79 67 77 38 93 0.35** 0.76 * 8 A LCx 0.56 NS 8 A RCA 0.52 NS 8 β All 73 71 73 23 96 0.23*** 0.75 ** 8 β LAD 83 67 80 43 93 0.41** 0.77 * 8 β LCx 83 75 82 27 98 0.32** 0.83 * 8 β RCA 0.60 NS 8 Axβ All 79 65 78 26 95 0.26*** 0.76 *** 8 Axβ LAD 72 89 75 38 97 0.40** 0.83 ** 8 Axβ LCx 0.76 NS 8 Axβ RCA 0.61 NS F A All 0.64 NS F A LAD 90 44 82 44 90 0.34* 0.74 * F A LCx 0.43 NS F A RCA 0.59 NS F β All 0.59 NS F β LAD 0.54 NS F β LCx 0.60 NS F β RCA 0.61 NS F Axβ All 0.62 NS F Axβ LAD 0.59 NS F Axβ LCx 0.45 NS F Axβ RCA 0.69 NS