Examensarbete i Engelska och lärande
15 högskolepoäng, avancerad nivå
Differences in Second Language
Learning Depending on Starting Age and
Amount of Exposure
Skillnader i andraspråksinlärning beroende på startålder
och exponeringsmängd
Gabriella Malmgren
Grundlärarexamen med inriktning mot arbete i årskurs F-3, 240 högskolepoäng
2017-03-22
Examinator: Shannon Sauro Handledare: Damien
Finnegan
2
Acknowledgments
Firstly, I would like to say a big thank you to my boyfriend, friends, and family for all the support and encouragement during these stressful weeks of writing this paper. Secondly, thank you to my supervisor Damien Finnegan for guiding me through this paper, giving good advice and believing in me when I did not believe in myself. Thirdly, thank you to Eric Palmér for helping me with the statistical part of the study. Finally, a big thank you to all the school workers around the country who replied to my emails.
3
Abstract
In the Swedish school system, English is one of three core subjects that are mandatory to pass at the end of year 9 to be able to engage in further studies in high school. However, English is not introduced at the same time in all schools. In fact, primary schools in Sweden can choose freely (between age 6-10) when they want to start introducing English to their students. The main purpose of this paper is to disclose if starting English education at an earlier age results in higher student scores on the total score and the three different parts of the National Exam for English in year 6. The National Exam scores from 14 different schools were collected and compared. 7 schools that introduce English in year 1, and 7 schools who begin their English education in year 3. The results from the statistical tests show that there is a significant difference between the two groups at the total score, speaking, and receptive skills. The early starters performed better on all parts. However, there was no significant difference between the groups in writing.
Keywords: Amount of Exposure. Early Language Learning. National Exam. Second Language Learning. Starting age.
4
Table of Content
1Introduction ... 5
2 Research Questions ... 7
3 Background ... 8
3.1 The Swedish Board of Education and the National Exam ... 8
3.2 The Three Skills ... 10
3.3 Previous Research ... 12
3.3.1 The Critical Period Hypothesis ... 12
3.3.2 Speaking ... 13
3.3.3 Receptive skills ... 13
3.3.4 Writing ... 14
3.3.5 All-embracing Second Language Learning ... 15
4 Method ... 19 4.1 Procedure ... 19 4.2 Ethical considerations ... 21 5 Results ... 22 5.1 Speaking ... 22 5.2 Receptive Skills ... 25 5.3 Writing ... 28 5.4 Total score ... 31 6 Discussion ... 35 7 Conclusion ... 38 7.1 Limitations ... 38 7.2 Further research ... 39 8 References ... 40
5
1 Introduction
After having participated in the teaching of English as a second language (ESL) in the Swedish school system as part of a teaching practicum, it has come to my attention that the guidelines for ESL courses in the primary years of school are rather vague in describing when to start teaching English in school. Referring to my own experience of teaching practicum, the students begin their English education in year 1 (6-7 years old). The young students are motivated, show a great deal of interest for the new targeted language, and are eager to learn. However, after experiencing several different schools whilst working as a substitute teacher, I came to the understanding that not all schools in Sweden start their English education in year 1. The starting age varies from as early as preschool (5-6 years old) to three years later in year 3 (8-9 years old).
Seeing that the starting age varies as much as it does, pupils in primary school in Sweden do not get to experience an equal amount of English education. According to Skolverket (The Swedish Board of Education) (2011), “The Education Act stipulates that the education provided in each school form and in the leisure-time centre should be equivalent, regardless of where in the country it is provided. National goals specify the norms for equivalence” (p. 10). The students that have started learning the language as early as preschool are exposed to a large amount of English, as opposed to the students that start three years later, in year 3, which makes this a problematic aspect of the fact that the pupils are not receiving an equivalent education. Focusing on the latter part of the quote from the Swedish Board of Education, another problematic aspect is that there are no knowledge requirements for English in year 3 (Skolverket, 2011, p 35). Teachers of English as a second language in primary school must study the knowledge
requirements for year 6 in order to know what the students need to work towards. This could result in a great disparity in students’ knowledge when they start year 4, which then can lead to a difficulty reaching the knowledge requirements in year 6.
English is one of the main subjects taught in Swedish schools. To enter a national program at a Swedish high school, the student must have passed English at the end of year 9 (Skolverket, 2013). Are the students that begin their English education in year 3 being provided with an equivalent opportunity to reach their knowledge requirements in
6
year 9, as the students that start learning English in year 1? According to some research, starting age and amount of exposure to the second language do not have a significant effect on language acquisition as a whole (Muñoz, 2011; Cepik & Sarandi, 2012; Holmstrand, 1982; Griffin, 1993; Pfenninger, & Singleton, 2016). However, Muñoz, (2011) found that when age did not matter, the amount of exposure was seen to be an important aspect that has a substantial effect on language proficiency outcomes (p. 129). A study conducted by Larson-Hall (2008) also resulted in a difference between early and late starters when focusing on both age and amount of exposure (p. 57).
However, when studying differences in English education, it is important to understand that there are four abilities that the students need to develop in order to achieve progress in language acquisition. The four abilities mentioned are reading, listening, speaking, and writing (Pinter, 2006, p. 45:65). Speaking and listening are the primary skills focused on when learning a new language, followed by reading and writing (Pinter, 2006. p. 45:65). Furthermore, the National Exams in English are divided into three parts, where reading and listening are viewed as one skill: Receptive skill (Skolverket, 2016c). Therefore, the mentioned skills in this study will be Speaking, Receptive, and Writing.
Previous studies which focused on the different parts of language learning do not agree on the importance of starting age and amount of exposure of the second language. The results from the majority of the studies do not show a significant difference in any of the skills (Cepik & Sarandi, 2012; Cardimona, Smith, & Roberts, 2015; Navés, Torras, & Luz, 2003;). However, two researchers did find a significant difference when focusing on the different skills combined with starting age and amount of exposure (Domínguez, & Pessoa, 2005) (Doiz, & Lasagabaster, 2004).
Because of the difference in the findings from the different studies, and because the choice that schools in Sweden have to make regarding the starting age of English, this area is problematic and worth looking into. Therefore, the main purpose of this study is to disclose if starting English education at an earlier age results in higher student scores on the total score and the three different parts of the National Exams: speaking,
receptive skills, and writing. Additionally, I will present previous research regarding this area.
7
2 Research
Questions
In order to achieve the purpose of this study, I will aim to answer the following research questions:
1. Is there a difference between those students who have started English education in year one and those who have started in year three, on the results from the three different parts of the National Exams in English in year six?
2. If so, how significant is the difference? 3. If not, how come?
8
3 Background
In this section I will start by describing the content of the syllabus for English in the Swedish National Curriculum. Furthermore, I will explain the content and meaning of the National Exam, and what the statistical information from the results include. In addition, I will explain the three skills tested in the National Exams: speaking, receptive skills, and writing. Moreover, the previous research about language learning, starting age, and amount of exposure to the second language will be presented.
3.1 The Swedish Board of Education and the National
Exam
The Swedish National Curriculum for the compulsory years of school is divided into three parts: the fundamental values and tasks of the school, the overall goal and guidelines, and the syllabuses for all subjects. As I previously mentioned in the introduction, The Swedish Board of Education (2011, p.10) states in the fundamental values and tasks of the school that education in each school should be equivalent, regardless of where in the country the education is provided. However, The Swedish Board of Education (2011, p.10) also points out that an equivalent education does not mean that the teaching should look identical everywhere and that the resources of the schools may be allocated differently.
Relevant for this study is the syllabus for English, which can be found in the third part of the curriculum. The syllabus begins with the definition of the overall aims of English teaching in compulsory school before defining the core content of each year group; 1-3, 4-6, 7-9. This is followed by the knowledge requirements for English (Skolverket, 2011, p.32-42). The structure is identical in all syllabuses for the different subjects. However, in the syllabus for English, there are no knowledge requirements for year 3, as there are in the syllabuses for most of the other subjects (Skolverket, 2011, p.35). Therefore, teachers teaching English to younger students must use the knowledge
9
requirements for year 6 when assessing their students’ knowledge and language acquisition.
The knowledge requirements for year 6 are based on the overall aims in English, and it includes the four different skills: speaking, listening, reading and writing. To pass English at the end of year 6, pupils need to comprehend the most important content regarding familiar topics from a simple, clearly spoken English. To show their understanding, the content must be reported back by using a simple method with comments on the topics. If the content included instructions or a special message, the pupils must act on them with acceptable results. The pupils must also be able to choose and implement a strategy for reading and listening to facilitate their understanding of spoken language and texts. Furthermore, to pass English at the end of year 6, the
students can choose material, of both spoken and written English, that can be relevant to their own interaction and production. Pupils have the ability to express themselves simply and comprehensibly by using sentences, and phrases. To speak with a clear and variated language, students can make simple improvements to their communications. Pupils have the ability to speak simply and understandably in words, sentences, and phrases when engaging in oral and written interaction. Moreover, students can choose and implement a strategy that can solve possible problems, which develops their
interaction. Students are able to mention, in simple forms, some singularities in different environments where English is used, and, in addition, be able to compare it with their own knowledge and experiences (Skolverket, 2011, p.35-36).
The students in year 6 are being assessed and graded based on the mentioned knowledge requirements. To support the teachers’ assessment process, all year 6
students in Sweden are being tested in English in the National Exam. The purpose of the National Exam is to endorse a fair and equivalent assessment; however, it can also be used as a means to measure to what extent the knowledge requirements are being achieved (Skolverket, 2016a). According to The Swedish Board of Education (2016b), the exam is constructed by teachers and researchers from several universities in
Sweden. During the two years of constructing the exam, it is tried and tested by a group of 200-1000 students. This is being done in order to make the exam as reliable, and as valid as possible (Skolverket, 2016b).
10
According to The Swedish Board of Education (2016c), The National Exam for English is divided into three parts. The two receptive skills - reading and listening - are represented in Part B, and the two productive skills - speaking and writing - both represent one part each - Part A and C. To prevent cheating, and to make the results as reliable as possible, the written parts of the exam are conducted on the same day across the country. The oral part must be carried out during the time period set by the Swedish Board of Education (Skolverket, 2016c). When marking and grading the exam, the teachers use the knowledge requirements for English as guidelines. Just as the Swedish grading system, the grading of the National Exam is based on the rating scale A-F: where A is the highest grade, and F is the lowest. To pass the exam, the student has to get a score to match grade E.
These scores and results are being collected by The Swedish Board of Education’s database for statistical information: SIRIS (www.siris.skolverket.se). The grades from each test, and each school, are changed into digits instead of letters in order to be able to make statistical comparisons of the results. The grades are transformed into the
following: F=0; E=10; D=12,5; C=15; B=17,5; A=20.
3.2 The Three Skills
In language development, researchers often refer to four different skills: reading, listening, writing, and speaking (Pinter, 2006. p. 22). However, the national exam is divided into three parts where reading and listening are joined together as a receptive skill (Skolverket, 2016c). Thus, the three skills that will be discussed in this section are speaking, writing, and reception.
When starting to learn a new language, the first ability the students develop is a receptive skill: listening. Pinter (2006) puts emphasis on the importance of exposing young learners to a great deal listening activities (p. 45). Teachers should be the main source of the target language and it is important because the students need to get used to the sounds and the intonation patterns of the new language (Pinter, 2006. p. 47). The other receptive skill – reading – is taught at a later stage when the students have gotten used to the new language. In the beginning of learning a second language the student
11
may not be a confident reader, which is why this is not the primary skill to learn. However, when literacy in the first language is established, students often feel
enthusiastic to learn how to read in the second language as well. The Swedish Board of Education (2011) states in the core content for year 3 in the Syllabus for English that the process of developing the receptive skills should include the following:
Clearly spoken English and texts from various media. Simple instructions and descriptions.
Different types of simple conversations and dialogues. Films and dramatized narratives for children.
Songs, rhymes, poems and sagas.
Words and phrases in their local surroundings, such as those used on signs and other simple texts. (Skolverket, 2011. p. 33).
The students need to be exposed to a variety of written and spoken English in order to develop their ability to listen and read in their second language. However, the students also need to develop strategies that can help them in the process of learning the
receptive skills (Pinter, 2006. p. 46).
The secondary skill to develop when learning a second language is speaking. Learning how to speak in a second language begins with practicing set phrases, and with a lot of repeating (Pinter, 2006. p. 55). It is important to begin with simple but meaningful activities in order to get the students enthusiastic about learning the
language (Pinter, 2006. p. 56). Writing is one of the latter skills that are taught in second language learning. Much like reading, the reason behind this is that the young learners have not yet established a confidence in writing in their first language (Pinter, 2006. p. 65). In the beginning of learning how to write in a second language, it is beneficial to start with activities that include copying whole or parts of sentences (Pinter, 2006. p. 74). In the core content for the productive skills - writing and speaking – The Swedish Board of Education (2011) established that the English teaching should include “Subject areas that are familiar to the pupils. Interests, people and places. Daily life and ways of living in different contexts and areas where English is used” (p. 33). These different
12
areas should be included in the following methods of production and interaction: “Simple presentations. Simple descriptions and messages. Songs, rhymes and dramatizations” (Skolverket, 2011. p. 33).
3.3 Previous Research
In this section, previous research in the area of starting age and amount of exposure will be disclosed. Firstly, I will explain the Critical Period Hypothesis (CPH) before I will disclose previous studies investigating starting age, exposure to a second language, and achievement level in the different areas of second language acquisition: speaking, receptive skills, and writing. Furthermore, I will present previous studies concerning the all-embracing second language learning including confidence and attitude. Finally, studies regarding school workers’ views on starting age and the reasons behind their beliefs will be presented.
3.3.1 The Critical Period Hypothesis
It is debatable if age has an impact on second language learning, although to start at a younger age is normally considered to be beneficial. The CPH has been used to describe the differences between first language acquisition and age (Cardimona, Smith, &
Roberts, 2015. p. 543). Brown (2007) described the CPH as a “biologically determined period of life when language can be acquired more easily and beyond which time language is increasingly difficult to acquire” (p. 57) (cited in Cardimona, Smith, & Roberts, 2015. p. 543). If this hypothesis is correct, there is a certain period that is preferable when learning a language. According to Birdsong (2005), the CPH is not referring to a certain age where language learning cannot be successful, but rather to a time period in which a person is more sensitive to provocations from the environment (cited in Cardimona, Smith, & Roberts, 2015. p. 543). Birdsong also discusses the ages 4-7 years old as the period of when a language can be attained to a full adult
competence. However, Pinker (1994) discusses ages 0-6 years old as the most preferable ages (cited in Cardimona, Smith, & Roberts, 2015. p. 544).
13
3.3.2 Speaking
Researchers have conducted studies regarding the ability to speak in a second language combined with different starting ages and amount of exposure. Dominguez and Pessoa (2005) conducted a study on 32 sixth grade students in Pennsylvania, USA, who have started learning a second language at different ages. There were 27 early learners and five late learners participating in the study; this means that the 27 students have been exposed to the second language a lot longer than the five late learners. The students were tested on their speaking ability in their second language, which in this case was Spanish. Dominguez and Pessoa’s (2005) study resulted in an advantage in oral production for the students who started learning Spanish at an early age, in
kindergarten. The reason behind the results may be a combination of an earlier start, more exposure, and a higher confidence level shown in the early learners.
Contrary to the mentioned study, Cepik and Sarandi (2012) conducted a study in the same area that resulted in finding no significant difference in oral production between early and late starters of a second language. A total of 83 Turkish students in the ages of 11-12 years old participated in the study. The early starters began learning English when they were 5-6 years old and had received 992 hours of instruction, which is more than double the amount of instruction hours than the late starters who had begun their English studies at the age of 9-10 years old. The effectiveness of the early learners’ teaching, and the fact that the classes were mixed with early and late learners, may have had an impact on the results.
3.3.3 Receptive skills
Thee two mentioned studies that include oral production (Dominguez & Pessoa, 2005) (Cepik & Sarandi, 2012) also include tests that measured the receptive abilities.
However, the receptive skills’ result from the two studies differs. Dominguez and Pessoa (2005. p. 478) found that both the early and late learners performed well in the listening task. However, there was a significant difference in favour of the early starters when combining the results from the test with the use of additional prompts to answer
14
correctly. The results from the reading task showed no significant difference between the two groups.
Cepik and Sarandi (2012. p. 3207) did not include a listening task in their study, although it did include a reading task. The results from their study shows there was no significant difference between the two groups.
Cardimona, Smith and Roberts (2015) also conducted a study concerning the receptive skills. The study included 23 participants between the ages of 18 and 50. The participating 23 men and women were divided into two groups depending on when they started their English education: early starters (before and at 6 years old) and late starters (older than 8 years old). The study shows there is no significant difference between the two groups regarding the receptive skills. However, the results did show that the late starters made more mistakes in one of the tasks.
3.3.4 Writing
In addition to speaking and receptive skills, Dominguez and Pessoa (2005), and Cepik and Sarandi (2012) also included tasks on writing in their studies. Much like in the previous mentioned skills, the two studies had different results. Dominguez and Pessoa’s (2005. p. 478) study resulted in a significant difference between the early learners and late learners. However, Cepik and Sarandi (2012. p. 3207) found no significant difference between the two groups in their study.
Agreeing with the results from Cepik and Sarandi’s (2012) study, Navés, Torras, and Celaya (2003) found no significant difference between two age groups in their study; it focused on difference in ages combined with the ability to write in a second language. In this study, the 520 participants were in the ages of 9-17 years old. The early starters had begun their English education at the age of eight, while the late starters began learning English at eleven years old. Contrary to Cepik and Sarandi’s (2012) and Dominguez and Pessoa’s (2005) studies, Navés, Torras, and Celaya’s (2003) study focused on difference in ages with the same amount of input. Therefore, the groups in the study had been exposed to the same amount of hours when learning English.
15
Much like Dominguez and Pessoa’s (2005) study, the study conducted by Doiz and Lasagabaster (2004) showed differences between the groups in several parts of written production. The participants in the study were thirty-eight 15-16 year-old students who had started learning English as a foreign language at different ages. The early learners started their English education at an age of eight years old and had been exposed to 792 hours of English lessons, while the late learners began their English tuition at an age of eleven years old and had had 660 hours of English in school. The results from the study showed that there is a significant difference between the two groups regarding “[…] organization, vocabulary, language use, and in the overall score (Doiz & Lasagabaster, 2004. p.536)”. However, in the areas of mechanics and content there was no significant difference.
3.3.5 All-embracing Second Language Learning
When looking at the all-embracing second language learning, several researchers have studied what impact it has when combined with age and amount of exposure. The only study found that was conducted on Swedish learners of English as a second language was Holmstand (1989) (cited in Muñoz, 2008. p. 206). Holmstrand (1989) compared two groups of students in year 6. One group started their English studies in year 1; the other group started in year 3. However, when the students were tested at the end of year 6, all the students had the same amount of hours of which they were exposed to English in school. Holmstrand (1989) did not find any differences between the two groups in relation to proficiency in English.
Griffin (1993) conducted a study in the area of starting age and second language learning. In the mentioned study, 26 students were divided into two groups; early starters who had begun learning French in the years of kindergarten to year 4, and late starters who started their second language education between year 5 and year 8. The results from the study showed that early starters did not outperform late starters despite the fact that they had been exposed to a larger amount of French.
Agreeing with the results from the previously mentioned studies, Cepik and
Sarandi’s (2012. p. 3207) study showed no significant difference regarding the language proficiency between early starters and late starters. In some of the cases in the study, the
16
early starters were mixed in a new class with late starters; which could have made the initial developed proficiency of early starters levelled so that the lesson could be
organized in an even way. According to Cepik and Sarandi (2012) the reason behind the result might be “[…] that intensity and quality of programs used for the early starters may not be effective enough to create a profound change in their linguistic competence. (p. 3207)”. Thus, the quality of the early English education varies which gives the students unequal chance to succeed. Cepik and Sarandi (2012) also indicate that early starters have extra time to process the language which may result in a more reflective learning.
Pfenninger and Singleton’s (2016) study also resulted in showing no significant difference between early and late starters of learning a second language. The study included 200 secondary school students who were tested twice, first at the age of 13 years old, then at 18 years old. The students were divided into two groups where the groups age of onset were 8-9 years old, and 13-14 years old. The reason behind the results might be that the students who participated were from different primary and secondary school regions. According to Pfenninger and Singleton (2016) “[…] early starters who were in primary schools with less than optimal learning conditions might not be able to profit from the extended learning period […] (p. 335)”.
Muñoz (2011) conducted a study on the difference in proficiency level depending on starting age and amount of input. The participants were 162 undergraduate students in an English degree at a university in Spain. The results from the study showed that there is no significant difference between different starting ages regarding level of
proficiency. However, there was a significant difference in the amount of instruction exposure and proficiency level.
Contrary to the previous mentioned studies, the study conducted by Larson-Hall (2008) showed a modest difference in favour of the early learners regarding second language learning. The study was conducted on 200 Japanese college students which were divided into groups of early learners (starting age 9 or later) and late learners (starting age 12-13). The students were exposed to minimal input. Although, despite the results, starting early does not magically give the students an ability to learn a second language rapidly and natively. However, Larson-Hall (2008) concludes “Starting to study a language at a younger age is one way to ensure larger amounts of language
17
input, so the present experiment overall finds a beneficial effect for starting to study a language at a younger age, even when input is only minimal (p. 58-59)”.
Some researchers did not just focus on the test results, but also students’ attitude and confidence combined with starting age, amount of exposure and second language learning. Being confident and having a positive attitude do influence the learning of a new language (Pfenninger, & Singleton, 2016. p. 336). However, the different studies do not agree when discussing whether or not starting age matters in terms of attitude and confidence. Pfenninger, and Singleton’s (2016. p. 336) study shows that a positive attitude was not associated with an early starting age, as did the study conducted by Holmstrand (1982) (cited in Muñoz, 2008. p. 206). On the other hand, Dominguez and Pessoa’s (2005. p. 479) study resulted in finding a link between an early starting age and higher confidence in using the language. Larson-Hall (2008. p. 58) found that the earlier the start, the more positive attitude towards learning a new language.
When discussing an early start in second language learning, the schools’ and teachers’ views are very important aspects in order to make the teaching successful. Cepik and Sarandi’s (2012. p. 3205) study showed that the majority of the teachers participating in the study believed that early learners achieved better results in second language classes. According to Cepik and Sarandi (2012. p. 3205), one teacher argues that the early starters are more confident and more active, but the late starters are more enthusiastic. Teachers from Dominguez and Pessoa’s (2012. p. 477-478) study also argues that an early start equals more confidence when using the second language.
Trivat (2015) conducted a study regarding schools in Sweden that choose to start their English education at a certain age, and why that age is preferable. The four interviewees in the study were representations from three different schools. All three schools introduce English in year 1; although, they did not have any research to support their decision, but instead they base their decision on the general saying “the earlier the better” (Trivat, 2015. p. 25). None of the interviewees could see any negative aspects with an early start. According to Trivat (2015. p. 22) a lack of competence may be an issue for some schools, but the interviewees have not experienced any problems on that point. When discussing if the chance to choose the starting age of teaching English may result in an equivalent education, the interviewees agreed that since all schools have to cover the core content for years 1-3 before the end of year 3, this should not be a
18
problem. However, one of the interviewees expressed a wish that all schools should start teaching English at the same time.
In Lundberg’s (2007) licentiate thesis, she discusses the inequivalent English
education in Sweden based on both the differences in quality, but also an issue with not enough hours of exposure of the language for the young students. The teachers who took part in the action project conducted by Lundberg (2007) believe that their year 1 students have been ready to learn English for some time, and that an early start can help with the attitude towards language learning to stimulate lifelong language learning (p.190).
19
4 Method
In this section, I will start by explaining how I have used a quantitative method to answer my research questions by comparing statistical information gathered from the results of the National Exams. I will describe the gathering of results and the chosen test used to measure how significant the different results were. Furthermore, I will explain the ethical considerations of this study.
4.1 Procedure
When searching for answers to the research questions, a quantitative study was
conducted. The study is based on statistical information: results from the National Exam in English for year 6. The results are divided into four parts: speaking, receptive skills, writing, and the total scores. The information about the results from the exams have been gathered from SIRIS (www.siris.skolverket.se), which is the Swedish Board of Education’s online database containing results and quality regarding childcare and education.
At the start, my intention was to conduct a study which included the results from 100 schools. However, after considering the time limit of ten weeks, I decided to minimalize my study. My aim is to be able to generalise the results, therefore, I base my study on a list of randomly selected 100 Swedish K-6 schools, provided by the Swedish Board of Educational statistics. An email was sent to the principles of the 100 schools with the following question; “In which year does your school introduce scheduled English to your students?” Furthermore, I gave the schools a week to reply before starting to gather the information that had been provided.
The study is focusing on the results from the schools that are starting with English in year one (Y1) and in year three (Y3). Out of the 100 schools that had been contacted, 39 schools replied to my email. Out of these 39 schools, 20 have scheduled English in Y1 and 10 in Y3. To get an equal number of schools in both groups, I decided to compare the average results from 10 schools, seeing that there are 10 schools in the Y3 group.
20
Furthermore, I used a search database found at SIRIS (www.siris.skolverket.se) to get the results of each school. I started by gathering the results of the Y3 schools. I chose to start with Y3 group because I did not have to make a random selection out of the group since it already included 10 schools. However, whilst collecting the results, the scores from three of the schools had not been registered on the account that there were less than ten students taking the tests. Thus, each group will include the average scores from seven randomly chosen schools. When choosing which of the 20 schools that should be included from Y1 group, I used the Google database and typed in random+number+generator. I set the range to choose numbers from to 1-20. By doing this, I could get the results of seven randomly selected schools in the Y1 group. I gathered all the scores from the National Exams and compared the results of the two groups.
In general, statistical tests are performed in order to determine whether a hypothesis is extremely unlikely given the observed data. The goal of this specific statistical analysis is two-pronged: To determine if the differences between the two group means is greater than you'd expect to see by chance, and to determine the 95% confidence interval for the difference. Since the data presented here is random and gathered from a true population, a confidence interval of 95% means that 95% of the intervals obtained from these samples will contain the true parameter. In this statistical test I perform a hypothesis test to determine if there is a significant difference in regard to the measured scores between those who start their English studies in year one compared to year three. Although a bigger sample size is always preferable, a common misconception is that employing statistical tests on a small sample size such as this (n=7) is incorrect, and there are indeed appropriate statistical methods that can be utilized. The data gathered here is continuous (as opposed to binary) and as such, a two sample t-test can be employed. A detailed explanation of the mathematics behind this test is not within the scope of this paper, but simplified, I utilized the software GraphPad to perform this statistical test and generate a p value. In order for the data to fall in the 95% confidence interval and be significant, the measured p value of the gathered data must be < 0.05. If the p value is above this limit, we cannot say that the observed difference in score is statistically significant.
21
4.2 Ethical considerations
The data collected in this study is public information. Thus, the use of data does not require permission from the schools of which the scores are collected from. However, all schools in the study are coded, which ensures that the schools are kept anonymous and the privacy of the schools are guaranteed. The collecting and analysing of the data have maintained the highest level of objectivity. Since the schools are randomly selected, the writers possible biased view towards early English teaching have not affected the choice of schools or the collection of data.
22
5 Results
In this section, I will present the results found when conducting the quantitative study in order to find answers to the following research questions:
1. Is there a difference between those students who have started English education in year one and those who have started in year three, comparing the results from the three different parts of the National Exams in English in year six?
2. If so, how significant is the difference? 3. If not, how come?
The quantitative study is based on the scores from the National Exams in English for year 6. The statistical data found when investigating the scores from the National Exams will be presented in graphs and tables. Furthermore, I will describe the content of the graphs and explain what the data represent. The results are divided into four parts: Speaking, Receptive Skills, Writing, and Total Score.
The schools in the bar graphs are coded; 01 or 03 before the semicolon represent the starting age, and the 0x after the semicolon represent the different schools. I.e. 01:01 is starting English in year 1, and is school number 1; 01:02 is starting English in year 1, and is school number 2. The scores in the graph are shown in the range of 0-20; where 0 is the lowest score, and 20 is the highest score.
5.1 Speaking
This section will present the graphs of the 14 schools’ average scores from Part A: Speaking at the National Exams for year 6. The gathered data from each school will be displayed, before illustrating the difference between the Y1 average Speaking score and Y3 average Speaking score.
23
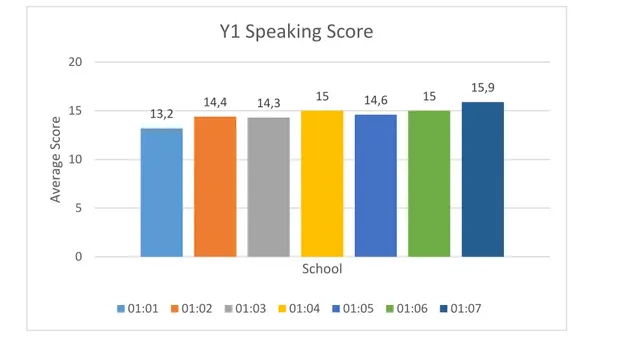
Figure 1: Y1 scores from Part A: Speaking at the National Exams
Figure 1 displays the Y1 schools’ average scores at Part A: Speaking of the National Exam for English in year 6. It presents the data of seven schools that introduces
scheduled English in year 1. The horizontal axis shows the schools. What is more, the vertical axis displays the scores from 0-20.
Out of the schools in Figure 1, school 01:01 had the lowest score, 13.2. School 01:02 scored an average of 14.4 on Part A: Speaking, while school 01:03 scored 14.3. Two schools - school 01:04, and school 01:06 - both had an average of 15. School 01:05 achieved an average score of 14.6. However, school 01:07 had the highest average score on Part A: Speaking with a score of 15.9. The Y1 schools scored within the range of 13.2-15.9 at Part A: Speaking at the National Exam for English.
13,2 14,4 14,3 15 14,6 15 15,9 0 5 10 15 20 Av era ge Score School
Y1 Speaking Score
01:01 01:02 01:03 01:04 01:05 01:06 01:0724
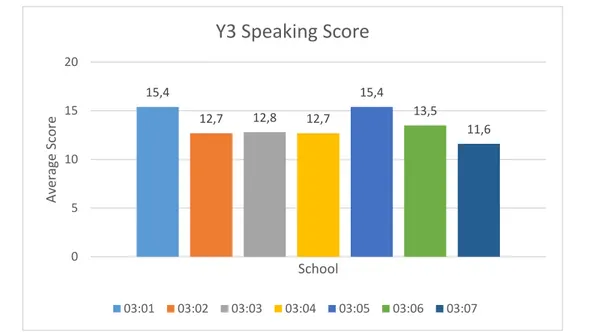
Figure 2: Y3 scores from Part A: Speaking at the National Exams
Figure 2 shows 7 Y3 schools’ average scores from Part A: Speaking from the National Exam for English in year 6. The vertical axis shows the scores from 1-20. Furthermore, the horizontal axis displays the schools.
School 03:01 and school 03:05 achieved the highest score of 15.4. School 03:02 and school 03:04 both scored an average of 12.7. School 03:03 scored 12.8, while school 03:06 achieved a score of 13.5. School 03:07 score the lowest average score on Part A: Speaking, with a score of 11.6. The Y3 schools scored within the range 11.6-15.4 on Part A: Speaking at the National Exam for English.
Table 1: Descriptive Statistics of Y1 and Y3 Speaking Score
Y1 Y3
Mean 14.63 13.44
Standard Deviation 0.8261 1.448 Standard Error of Mean 0.3122 0.5472
Max 15.9 15.4 Min 13.2 11.6 15,4 12,7 12,8 12,7 15,4 13,5 11,6 0 5 10 15 20 Av era ge Score School
Y3 Speaking Score
03:01 03:02 03:03 03:04 03:05 03:06 03:0725
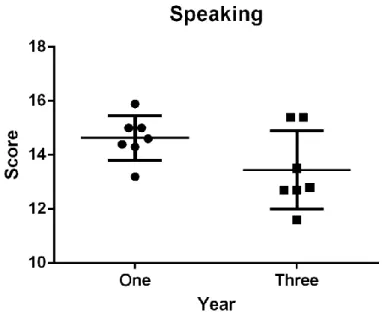
Figure 3: Differences between the scores from Y1 schools and Y3 schools at Part A: Speaking at the National Exams in English
Figure 3 displays the difference between the scores from the seven Y1 schools and the seven Y3 schools. In Figure 3, the vertical axis shows the scores 10-18. The horizontal axis displays the two year-groups: Year One and Year Three. The circles represent the schools that begin introducing English in year 1. The squares represent the schools that start their English education in year 3.
Results of the T-test for the speaking score obtained by the schools show a
statistically significant difference, with a p value of 0.0422. Shown also on this graph is the mean, while the error bars indicate standard deviation. The exact value of these are displayed in Table 1.
5.2 Receptive Skills
In this section, the graphs of the scores from Part B: Receptive skills from the National Exam for English in year 6 will be displayed. The collected data from the 14 schools will be presented. Furthermore, I will illustrate the difference between the Y1 average Receptive Skills score and Y3 average Receptive Skills score in a graph.
26
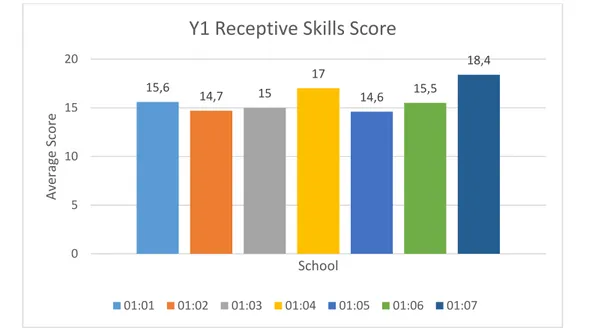
Figure 4: Y1 scores from Part B: Receptive Skills at the National Exams
Figure 4 displays the average scores from Part B: Receptive Skills at the National Exam for year 6 contained by 7 schools who starts introducing English in year 1. The horizontal axis shows the schools, while the vertical axis displays the scores 0-20.
School 01:01 had an average score of 15.6 on Part B, while school 01:02 scored 14.7. School 01:03 achieved a score of 15. School 01:04 had the second highest score with a score of 17. School 01:05 score the lowest score out of the Y1 schools on Part B, with a score of 14.6. School 01:06 scored 15.5, while school 01:07 had the highest score out of all Y1 schools with a score of 18.4 on Part B: Receptive.
15,6 14,7 15 17 14,6 15,5 18,4 0 5 10 15 20 Av era ge Score School
Y1 Receptive Skills Score
27
Figure 5: Y3 scores from Part B: Receptive Skills at the National Exams
Figure 5 shows the average scores of 7 schools that introduce English in year 3. The scores are from Part B: Receptive skills on the National Exam for English in year 6. Furthermore, the horizontal axis shows the 7 different schools, while the vertical axis displays the scores of 0-20.
School 03:01 achieved a score of 16.1, while school 03:02 had the lowest score out of the Y3 schools on Part B with a score of 10.2. School 03:03 scored 14.6. School 03:04 attained a score of 13.8, while the highest score out of the seven schools were achieved by school 03:05 with a score of 16.3. School 03:06 scored 13, and school 03:07 scored 14.2 on Part B: Receptive Skills on the National Exam for English in year 6. The 7 schools scored within the range of 10.2-16.3.
Table 2: Descriptive Statistics of Y1 and Y3 Receptive Skills Score
Y1 Y3
Mean 15.83 14.03
Standard Deviation 1.391 2.065 Standard Error of Mean 0.5259 0.7803
Max 18.4 16.3 Min 14.6 10.2 16,1 10,2 14,6 13,8 16,3 13 14,2 0 5 10 15 20 Av era ge Score School
Y3 Receptive Skills Score
28
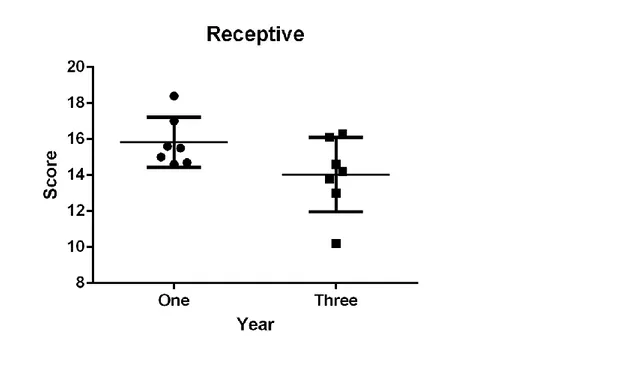
Figure 6: Differences between the scores from Y1 schools and Y3 schools at Part B: Receptive Skills at the National Exams in English
Figure 6 shows the difference between the scores from the Y1 schools and the Y3 schools at Part B: Receptive Skills. The vertical axis displays the scores 8-20. The horizontal axis shows the two year-groups: Year One and Year Three. The circles represent the schools that begin their English education in year 1. The squares represent the schools that start introducing English in year 3.
Results of the T-test for the receptive skills score obtained by the schools show a statistically significant difference, with a p value of 0.0400. Shown also on this graph is the mean, while the error bars indicate standard deviation. The exact value of these are displayed in Table 2.
5.3 Writing
This section will include the tables of the scores achieved in Part C: Writing at the National Exams for English in year 6. The gathered data from the different schools will be displayed, before illustrating the difference between the Y1 average Writing score and Y3 average Writing score.
29
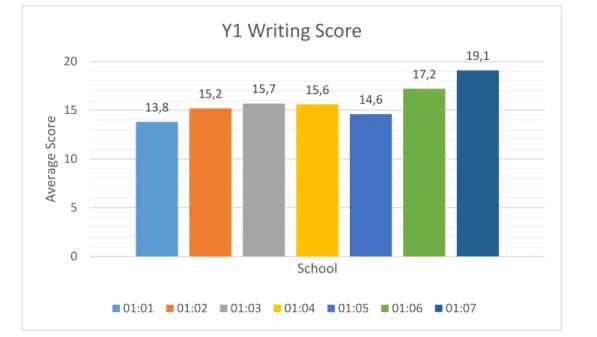
Figure 7: Y1 scores from Part C: Writing at the National Exams
Figure 7 displays seven schools’ average score at Part C: Writing at the National Exam for English in year 6. The schools introduce English to their students in year 1. The horizontal axis shows the seven schools, while the vertical axis displays the scores 1-20.
School 01:01 scored the lowest out of the seven Y1 schools, with a score of 13.8. School 01:02 achieved a score of 15.2, while school 01:03 had a score of 15.7 at Part C: Writing. Furthermore, school 01:04 scored 15.6, and school 01:05 achieved a score of 14.6. School 01:06 attained the second highest score out of the seven schools, with a score of 17.2. However, the highest score at Part C from the National Exam for English was achieved by school 01:07, with a score of 19.1. The average scores from the seven schools are within the range of 13.8-19.1.
13,8 15,2 15,7 15,6 14,6 17,2 19,1 0 5 10 15 20 Av era ge Score School
Y1 Writing Score
01:01 01:02 01:03 01:04 01:05 01:06 01:0730
Figure 8: Y3 scores from Part C: Writing at the National Exams
Figure 8 shows the average scores from seven schools that begin their English education in year 3. The scores are from Part C: Writing at the National Exam for English in year 6. What is more, the vertical axis shows the average scores 0-20, while the horizontal axis displays the seven different schools.
In figure 8, school 03:01 attained the highest average score out of the seven schools, with a score of 16.9. However, school 03:02 scored the lowest score out of the seven schools, with a score of 12.5. School 03:03 scored 12.9, and school 03:04 had a score of 15.2 on Part C. School 03:05 achieved a score of 15.1. School 03:06 attained a score of 13.8, while school 03:07 achieved a score of 14.9. The scores from the seven schools are within the range of 12.5-16.9.
Table 3: Descriptive Statistics of Y1 and Y3 Writing Score
Y1 Y3
Mean 15.89 14.47
Standard Deviation 1.763 1.517 Standard Error of Mean 0.6663 0.5735
Max 19.1 16.9 Min 13.8 12.5 16,9 12,5 12,9 15,2 15,1 13,8 14,9 0 5 10 15 20 Av era ge Score School
Y3 Writing Score
03:01 03:02 03:03 03:04 03:05 03:06 03:0731
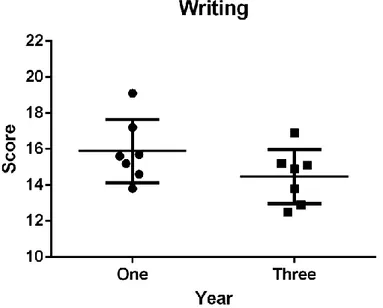
Figure 9: Differences between the scores from Y1 schools and Y3 schools at Part C: Writing at the National Exams in English
Figure 9 shows the difference between the average scores from the seven Y1 schools and the seven Y3 schools. In Figure 9, the vertical axis displays the scores 10-22. The horizontal axis show the two year-groups: Year One and Year Three. The circles represent the schools where the students start learning English in year 1. The squares represent the schools that begin their English education in year 3.
Results of the T-test for the writing score obtained by the schools show a
non-statistically significant difference, with a p value of 0.0668. Shown also on this graph is the mean, while the error bars indicate standard deviation. The exact value of these are displayed in Table 3.
5.4 Total score
In this section, the tables of the total scores from the National Exams will be displayed. The collected data from each school will be presented before illustrating the difference between the Y1 average total score and Y3 average total score.
32
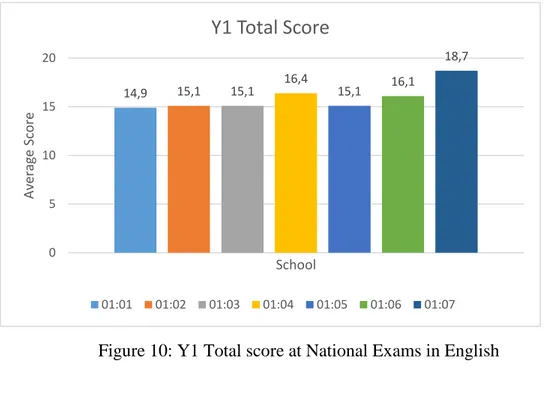
Figure 10: Y1 Total score at National Exams in English
Figure 10 shows the average total score at the National Exams in English for year 6 gathered from the seven randomly selected schools that introduce English in year 1. The vertical axis shows the scores from 1-20. The horizontal axis shows a representation of the seven schools.
The average score from school 01:01 is 14.9, while both school 01:02 and 01:03 has an average of 15.1. School 01:04, which has a higher average score than the previously mentioned schools, scored 16.4. School 01:05 also scored an average of 15.1. School 01:06 has an average score of 16.1. However, school 01:07 has the higher score in the table with a score of 18.7. The total scores from the Y1 schools is within the range of 14.9-18.7. 14,9 15,1 15,1 16,4 15,1 16,1 18,7 0 5 10 15 20 Av era ge Score School
Y1 Total Score
01:01 01:02 01:03 01:04 01:05 01:06 01:0733
Figure 11: Y3 Total Score at National Exams in English
Figure 11 presents the data from seven schools that introduces English in year 3. It shows the average total scores from the National Exams in English for year 6. The horizontal axis presents the seven schools, while the vertical axis presents the scores from 0-20.
School 03:01 is the school with the highest score in the table, with a score of 16.6. The lowest average score in the table is represented by school 03:02, scoring 11.7. School 03:03 has an average total score of 14.2, while school 03:04 has an average of 14.8. School 03:05 scored an average of 16.2 on the National Exams in English. School 03:06 has an average score of 13.7, which is a little bit lower than school 03:07, which has a score of 14. The Y3 schools average total score from the National Exams in English is within the range of 11.7-16.6.
Table 4: Descriptive Statistics of Y1 and Y3 Total Score
Y1 Y3
Mean 15.91 14.46
Standard Deviation 1.357 1.643 Standard Error of Mean 0.5129 0.6210
Max 18.7 16.6 Min 14.9 11.7 16,6 11,7 14,2 14,8 16,2 13,7 14 0 5 10 15 20 Av era ge Score School
Y3 Total Score
03:01 03:02 03:03 03:04 03:05 03:06 03:0734
Figure 12: Differences between the scores from Y1 schools and Y3 schools at Part A: Speaking at the National Exams in English
Figure 12 displays the difference between the total scores from the Y1 schools and the Y3 schools. In Figure 12, the vertical axis show the scores 10-20, while the horizontal axis displays the two year-groups: Year One and Year Three. The circles represent the schools that introduce English in year 1. The squares represent the schools that start teaching English in year 3.
Results of the T-test for the total score obtained by the schools show a statistically significant difference, with a p value of 0.0478. Shown also on this graph is the mean, while the error bars indicate standard deviation. The exact value of these are displayed in Table 4.
35
6 Discussion
In this section, I will compare the findings from this study with the results from previous studies. I will discuss the possible reasons behind the similar and different results. I will discuss the findings from my quantitative study and the results from the National Exams, where I will start by discussing the results from Part A: Speaking; before moving on to Part B: Receptive; followed by Part C: Writing; and lastly I will discuss the Total Score and overall second language learning.
The result from the two sample t-test in this study show that there is a significant difference in Part A: Speaking between the students who have started their English education in year 1, and the students who began learning English in year 3. When focusing on the ability to speak, the results from the National Exams for English in year 6 shows it is beneficial to start scheduled English in year 1, as opposed to starting in year 3. The results from this study validate the findings from the study conducted by Domínguez, and Pessoa (2005. p. 478), who also found a significant difference between early and late starters of English. However, this study does not concur with the results from Cepik, and Sarandi’s (2012. p. 3207) study, which did not find any significant difference between early and late starters. The participants of the three studies were around the same age (11-12 years old) when tested, but the two previous studies are based on the results from individual students, while this study is based on the average scores from all year 6 students from a school. The sample of students in this study is larger seeing that the study was conducted on 14 schools in total; in each school, more than 10 students participated in the National Exam.
Speaking is one of the primary skills focused on when first learning a language, and the students who started in year 1 have had additional two years to process their oral language skills than the students who began their English studies in year 3, which could be one of the reasons why there was a significant difference in the results. A reason why the results from this study differs from the findings in Cepik, and Sarandi’s (2012) study could be the amount of the targeted language spoken by the teacher (Pinter, 2006, p. 45). A difference could also be that the studies were conducted in different countries,
36
which may have different views on second language learning and may activate the students with a diverse amount of speaking activities during the lessons.
When looking at the results from Part B (Receptive skills) in this study, it is evident that there is a significant difference between the two groups. Corresponding to the results in Part A (Speaking), the early learners also have advantages in the receptive skills. This result is contradictory to the previous research found on the area
(Domínguez, & Pessoa, 2005. p. 478) (Cepik, & Sarandi, 2012. p. 3207) (Cardimona, Smith, & Roberts, 2015. p. 557). However, Domínguez, and Pessoa’s (2005. p. 478) study focused on both receptive skills – reading and listening – but divided the results in two, which is the opposite of how the National Exams are designed. Domínguez, and Pessoa (2005. p. 478) found a significant difference when listening was tested, but not when focusing on reading. None of the previous studies found a significant difference regarding reading. However, this study mixed the results, which may be the reason why the results from this study does not concur with the previous studies. Listening is the primary ability the students develop when learning a new language. Reading comes at a later stage. Listening is half of the results from the receptive skills from this study, which could have made the difference greater than if we were only looking at the results from the reading test. Listening is also the skill that is used all the time during the
lesson, which makes it beneficial to have been exposed to the language additional hours. Observing Figure 9, the average score from Y1 is higher than the average score from Y3. However, the two sample t-test on Part C: Writing resulted in a non-statistical difference between the two groups. Out of the three tested skills, writing is the only skill where a statistical difference could not be found. The reason behind this result may be that the students in year 1 have not yet developed the ability to write in their first language and are still learning how to form letters. Writing is not the primary ability focused on when first starting to learn a new language; instead, speaking and listening is of preference (Pinter, 2006. p. 45). The findings from Cepik and Sarandi’s (2012. p. 3207) and Navés, Torras, and Celaya’s (2003. p. 120) studies concur with the result from this study. As the last-mentioned study focused on difference in age and not input, Navés, Torras, and Celaya (2003) discuss reasons behind the results as “differences in cognitive maturity, linguistic development, and test-taking strategies” (p. 121).
However, since the age of the participants in this study is equivalent, the mentioned reasons cannot be directly connected to the results from this study. Doiz, and
37
Lasagabaster (2004. p. 536) found no significant difference regarding the areas of mechanics and content. They argue that the lack of difference in these two areas is a result of the students taking advantage of their previous knowledge in their first language (Doiz & Lasagabaster, 2004. p. 536). However, in the areas of language use, vocabulary, organization, and in the overall score, a significant difference was found. Furthermore, Domínguez, and Pessoa (2005. p. 478) also found a significant difference in the area of writing. The two latter studies were rather minor in comparison to the other mentioned studies, which could be the reason to the different results.
When focusing on the total score from the National Exams, a significant difference was found between the Y1 schools and Y3 schools. According to the results from this study, starting second language learning in year 1 is more beneficial than starting the introduction in year 3. Except for this study, the study conducted by Larson-Hall (2008) was the only study that resulted in a significant difference between the different groups. However, Muñoz’s (2011) study resulted in finding a difference between the groups when the amount of exposure was different, but not when focusing on the starting age. The other studies found on the area did not find a significant difference neither in starting age nor amount of exposure (Cepik, & Sarandi, 2012; Holmstrand, 1982; Griffin, 1993; Pfenninger, & Singleton, 2016). Why the results from this study differs from the majority of previous studies may be a result of differences in quality in the early years of English education.
This study can be seen as a sample study in order to conduct an even larger and more extensive study. Although, since the schools participating in the study are randomly selected, a generalisation can be made that compared to students that begin their English studies in year 3, the students starting English in year 1 have a better chance at a
successful result at the National Exam in year 6 in speaking, receptive skills, and the total score. Furthermore, this shows that as long as the starting age of learning English as a second language is a choice for the Swedish schools, English education in Sweden is not equivalent for all students.
38
7 Conclusion
The aim of this study was to unveil if starting English education at an earlier age results in higher student scores on the total score and the three different parts of the National Exam. The following research questions were asked: Is there a difference between those
students who have started English education in year one and those who have started in year three, comparing the results from the different parts of the National Exams in English in year six? If so, how significant is the difference? If not, how come? When
concluding the findings from this study, the students that began their English education in year 1 were more successful on all parts and on the total score of the National Exam for English. This study shows that there is a significant difference between the two year groups in Part A: Speaking, Part B: Receptive skills, and in the total scores of the National Exam. However, there is no significant difference between the scores at Part C: Writing. Since writing is the last skill to focus on when introducing a new language to young students, it would also be the skill of which the early learners are not
advantageous in when comparing the two year groups.
7.1 Limitations
The study had some limitations that may affect the outcome of the results. Firstly, the time limit of this degree project limited the volume of the quantitative study conducted on the schools’ scores on the National Exams. A larger sample size would be preferable to make the results as reliable as possible. Secondly, the schools included in the
quantitative study were limited to K-6 or 1-6 schools. The scores from the National Exam had to come from the same schools where the students started their English education which limited the random school selection.
39
7.2 Further research
Further research in the area is unquestionably needed. The quantitative study conducted in this degree project was of a rather limited scale, which encourages further and more extensive studies on the effects that starting age and amount of exposure have on second language learning. The area is of interest for all teachers and schools in Sweden, none to say the least to English teachers around the country who are passionate about their work. I would endorse the Swedish Board of Education to conduct a large and extensive study regarding how this area affects Swedish students’ English education, both short-term but also long-short-term. A problem with starting English education early could be the lack of competence amongst teachers. However, all teacher students graduating this year will be qualified to teach English in the primary years of school. This leaves the Department of Education and the Swedish Board of Education with a perfect
opportunity to change how schools can choose not to prioritize English education even though English is one of the core subject in the Swedish school system.
40
8 References
Cardimona, Kimberly, Smith, Pamela, & Roberts, Lauren Sones (2015). Lexical Organization in Second Language Acquisition: Does the Critical Period Matter?.
TESOL Journal. 7(3), 540–565.
Cepik, Saban, & Sarandi, Hedayat (2012). Early and Late Language Start at Private Schools in Turkey. Educational Sciences: Theory and Practice, 12(4), 3199-3209. Doiz, Aintzane, & Lasagabaster, David (2004). The effect of the early teaching of
English on writing proficiency. International Journal of Bilingualism, 8(4), 525-540. Domínguez, Rocio, & Pessoa, Silvia (2005). Early versus late start in foreign language
education: Documenting achievements. Foreign Language Annals, 38(4), 473-480. Griffin, Glenda Gillespie (1993). The Relationship between Starting Age and Second
Language Learning. Master's Thesis, Dominican College of San Raphael, California.
Holmstrand, Lars (1982). English in the elementary school. Stockholm/Uppsala: Almqvist & Wiksell International.
Larson-Hall, Jenifer (2008). Weighing the benefits of studying a foreign language at a younger starting age in a minimal input situation. Second language research, 24(1), 35-63.
Lundberg, Gun (2007). Teachers in action: att förändra och utveckla undervisning och
lärande i engelska i de tidigare skolåren. Licentiatavhandling Umeå : Umeå
universitet
Muñoz, Carmen (2008). Age-related differences in foreign language learning.
Revisiting the empirical evidence. IRAL-International Review of Applied Linguistics
in Language Teaching, 46(3), 197-220.
Muñoz, Carmen (2011). Input and long-term effects of starting age in foreign language learning. IRAL-International Review of Applied Linguistics in Language
41
Navés, Teresa, Torras, M. Rosa, & Celaya, M. Luz (2003). Long-term effects of an earlier start: An analysis of EFL written production. Eurosla yearbook, 3(1), 103-129.
Pfenninger, Simone E., & Singleton, David (2016). Affect trumps age: A person-in-context relational view of age and motivation in SLA. Second Language Research,
32(3), 311–345.
Pinter, Annamaria. (2006). Teaching Young Language Learners. Oxford University Press.
Skolverket (2011). Curriculum for the compulsory school, preschool class and the
leisure-time centre 2011. Stockholm: Skolverket.
Skolverket (2013). Behörighetskrav för gymnasieskolan. Received from
http://www.skolverket.se/skolformer/gymnasieutbildning/gymnasieskola/behorighets krav-1.201081
Skolverket (2016a). The National Exam. Retrieved from http://www.skolverket.se/bedomning/nationella-prov
Skolverket (2016b). The construction of the National Exams. Retrieved from
http://www.skolverket.se/bedomning/nationella-prov/hur-konstrueras-de-nationella-proven
Skolverket (2016c). National Exams for English in year 6. Retrieved from http://www.skolverket.se/bedomning/nationella-prov/alla-nationella-prov-i-skolan/arskurs-6/amnesprovet-i-engelska-1.197351
Trivat, Sandra (2015). Different schools’ choices of when to start English instruction in