Full Terms & Conditions of access and use can be found at
https://www.tandfonline.com/action/journalInformation?journalCode=hmpe20
Measurement in Physical Education and Exercise Science
ISSN: 1091-367X (Print) 1532-7841 (Online) Journal homepage: https://www.tandfonline.com/loi/hmpe20
Assessing Students’ Perceived Learning and
Contentment in Physical Education: A Scale
Development Study and Structural Equation
Modeling Analysis
Alexander Jansson, Gunilla Brun Sundblad, Suzanne Lundvall & Johan
Norberg
To cite this article: Alexander Jansson, Gunilla Brun Sundblad, Suzanne Lundvall & Johan Norberg (2019) Assessing Students’ Perceived Learning and Contentment in Physical Education: A Scale Development Study and Structural Equation Modeling Analysis, Measurement in Physical Education and Exercise Science, 23:3, 280-290, DOI: 10.1080/1091367X.2019.1617713
To link to this article: https://doi.org/10.1080/1091367X.2019.1617713
© 2019 The Author(s). Published with license by Taylor & Francis Group, LLC. Published online: 23 May 2019.
Submit your article to this journal
Article views: 127
View related articles
Assessing Students
’ Perceived Learning and Contentment in Physical Education:
A Scale Development Study and Structural Equation Modeling Analysis
Alexander Janssona, Gunilla Brun Sundbladb, Suzanne Lundvallb, and Johan Norberga
aDepartment of Sport Sciences, Malmö University, Malmo, Sweden;bDepartment of Sport and Health Science, The Swedish School of Sport
and Health Sciences, Stockholm, Sweden
ABSTRACT
Although students’ perceived learning is central in physical education (PE), few measurements are available. Furthermore, little is known about how students’ perceptions of PE effect students’ perceived learning in PE. Therefore, the aim was to develop a scale to assess students’ perceived learning and a measurement to assess students’ perceived contentment in PE, and furthermore, to analyze the interrelationship between students’ perceived learning and students’ perceived con-tentment in PE. A total of 1203 students in Sweden who were aged 12–16 years participated. The results from the exploratory (n = 601) and confirmatory (n = 602) factor analyses as well as the validity and reliability analyses showed that there was psychometric support for the one-dimensional model perceived learning in PE and for the three-one-dimensional model perceived contentment in PE. The structural equation modeling analyses showed that both competence and joyfulness were directly and positively related to students’ perceived learning.
KEYWORDS
Physical education; perceived learning; perceived contentment; factor analysis; structural equation modeling
Introduction
The importance of physical education (PE) and its positive effects on students are well documented (Archer & Garcia,
2014; Ekblom-Bak, Ekblom, Andersson, Wallin, & Ekblom,2018). PE has profound positive effects in several domains, such as the affective -, the cognitive -, the physi-cal– and the social domain as well as in lifestyle (Bailey,
2006). Students’ physical ability and perceptions of physical
activity (PA) are important, not only in PE, but also from a lifestyle perspective (Bailey, 2006). Students’ physical
competence, knowledge related to lifestyle and students’ physical abilities– are central in relation to future partici-pation in PA (Organisation for Economic Co-operation and Development [OECD],2017).
An emphasized focus on students’ learning and knowl-edge in PE are evident in curriculums in several countries, including Sweden (Hardman,2008; Hardman & Marshall,
2009; OECD,2017; Swedish Schools Inspectorate,2018). Students’ learning in PE has been discussed for decades. For example, Placek (1983) state that it is not enough for students to feel busy, happy, and good during PE– students are supposed to learn something. Recent research empha-size that students are supposed to learn about PA and health in PE (Ennis, 2014; Nyberg & Larsson, 2014). Nevertheless,“developing efficient, easy to use instruments to measure and compile data on students’ learning […] is
a challenge to be addressed” (López-Pastor, Kirk, Lorente-Catalán, MacPhail, & Macdonald,2013, p. 62). The devel-opment and validation of measurement to assess students’ learning in PE are an international challenge. This is parti-cularly evident within Swedish PE research where validated measurements are rare and the tradition to develop mea-surements is weak (Lindwall & Lundqvist, 2004). Furthermore, the lack of measurements is possibly related to the limited knowledge about how students’ perceived learning in PE is related to other aspects of PE, such as students’ perceptions of PE, students participation in PA and the long-term impacts of PE (Green, 2012; López-Pastor et al.,2013; Trudeau & Shephard,2008).
In this study, data from the Swedish project the School-Sport-Health (SSH) were used (see Thedin Jakobsson,
2015, for more information about the SSH-project). From the large item-pool in the project, items related to students’ learning and perceptions of PE were selected in line with the aim of the current study; to develop a scale to assess students’ perceived learning and a measurement to assess students’ perceived contentment in PE, and furthermore, to analyze the interrelationship between students’ per-ceived learning and students’ perper-ceived contentment in PE. Identifying how different aspects of students’ percep-tions affects students’ perceived learning is important to create meaningful PE experiences that can have meaning
CONTACTAlexander Jansson alexander.jansson@mau.se Department of Sport Sciences, Malmö University, Nordenskiöldsgatan 10, Orkanen, E436, Malmo, Sweden
2019, VOL. 23, NO. 3, 280–290
https://doi.org/10.1080/1091367X.2019.1617713
© 2019 The Author(s). Published with license by Taylor & Francis Group, LLC.
This is an Open Access article distributed under the terms of the Creative Commons Attribution-NonCommercial-NoDerivatives License ( http://creativecommons.org/licenses/by-nc-nd/4.0/), which permits non-commercial re-use, distribution, and reproduction in any medium, provided the original work is properly cited, and is not altered, transformed, or built upon in any way.
and relevance for all students. This study provide, in addi-tion to new measurements, also support for a significant association between students’ perceived learning and con-tentment in PE.
Students’ perceptions of physical education
Students’ perceptions of PE are a wide concept with several aspects (Taylor,2012). Several measurements are available to assess different aspects of students’ perceptions of PE. Phillips and Silverman (2012) developed an instrument to assess students’ attitudes toward PE which is based on attitude theory (Ajzen & Fishbein, 1980) with separate factors for affect and cognition. Additionally, Lyyra, Leskinen, and Heikinaro-Johansson (2015) designed an instrument to assess students’ perceptions of curricular goals in Finland based on how students ascribe to curricu-lar goals in PE. Furthermore, Mitchell (1996) developed a frequently used instrument to assess students’ percep-tions of learning environment in PE. Moreover, an instru-ment to assess perceived need support and need satisfaction in PE was developed by Sánchez-Oliva, Kinnafick, Smith, and Stenling (2018).
Instruments to assess enjoyment, fun, and PA during PE lessons have been developed by several researchers (Cunningham, 2007; Barr-Anderson et al., 2008; Kendzierski & DeCarlo,1991; McKenzie, Sallis, & Nader,
1992; see also Motl et al., 2001; Paxton et al., 2013). Furthermore, several instruments have also been developed to assess students’ perceived competence in PE (see Carroll & Loumidis,2001; Scrabis-Fletcher & Silverman,2010).
Students’ learning in physical education
Several ways to operationalize students’ learning in PE have been suggested including grade, students’ estima-tions of their grade, teachers’ assessment, and different fact-based tests (Chen, Chen, & Zhu, 2012). However, learning in PE can also be operationalized based on the students’ own understanding of PE, as in, perceived learning (O’Sullivan & MacPhail, 2011). Unlike grades or fact-based tests, perceived learning is based on a student-centered perspective. This means that stu-dents’ own understanding of learning in PE is in focus. From this perspective, it is possible that students with low grades experience high learning and that students with high grades experience low learning in PE (O’Sullivan & MacPhail,2011). As mentioned, there are few measurements developed to assess students’ perceived learning in PE (López-Pastor et al., 2013). The limited number of measurements to assess stu-dents’ perceived learning in PE could be a limitation in further research. It is possible that the lack of
measurements developed to assess students’ perceived learning in PE is related to the lack of knowledge about what, when, and how much students experience that they learn in PE (Rink,2013).
Students’ contentment in physical education
In this study, students’ contentment in PE – an aspect of students’ perceptions of PE was of particular focus. Students’ contentment in PE is an including term for several aspects of students’ perceptions of PE. In the pre-sent study, contentment in PE includes students’ percep-tion of their own capacity in PE (perceived competence), perceptions related to wellbeing in PE (perceived comfort) and perceptions related to engagement in PE (perceived joyfulness). Students’ contentment in PE has been exam-ined in a few earlier studies (Kristjánsson, Sigfúsdóttir, Allegrante, & Helgason, 2009; Metsämuuronen, Svedlin, & Ilic, 2012) and is closely related to one of the main aims in PE described by Hardman and Marshall (2000). However, there are few measurements developed to assess contentment in PE and little is known about how students’ contentment in PE is related to students learning in PE.
The importance of reliable measurements in physical education research
Reliable measurements developed to assess students’ per-ceptions of PE are a methodological contribution because they constitute a solid ground for further studies (Donovan, Mercier, & Phillips, 2015; Nunnally & Bernstain, 1994). Several researchers emphasize the importance of develop-ing, validatdevelop-ing, and using more reliable measurements in PE (Kougioumtzis & Patriksson, 2015; Lindwall & Lundqvist, 2004; Silverman & Subramaniam, 1999). Although there are several reliable and validated measure-ments developed to assess various aspects of students’ per-ceptions of PE, more measurements are warranted, mainly for three reasons. First, students’ perceptions of PE are a multifaceted area. In several aspects, reliable and validated measurements are lacking, for example, measurements to assess students’ perceived learning in PE (López-Pastor et al.,2013). Furthermore, even when there are available measurements developed to assess a particular aspect of students’ perception of PE, for example, enjoyment (Barr-Anderson et al.,2008; Cunningham,2007; Kendzierski & DeCarlo,1991; McKenzie et al.,1992). New measurements could contribute with the possibility to assess different aspects of enjoyment and also the possibility to assess the same construct from new or different theoretical perspectives. Second, the validity and reliability of measure-ments could differ depending on the composition of respondents. Several factors, such as the respondents’ age,
gender, and national background, could affect the measure-ments’ psychometric properties (Scrabis-Fletcher & Silverman,2010; Silverman & Subramaniam, 1999). New or modified measurements, developed for specific contexts or groups of respondents is therefore a methodological contribution. Third, even though there are several measure-ments developed to assess students’ perceptions of PE for specific aspects, new measurements, developed from exist-ing item-pools could be valuable. Not only, because reliable measurements are a methodological contribution for further studies, but also because it enable analyses to exam-ine how different constructs are related, for example, through structural equation modeling (SEM) analyses (Wang & Wang,2012). This is particularly relevant in the present study, because the development of measurements and the analyses to examine how the constructs (students’ perceived learning and students’ perceived contentment in PE) are related, is based on an existing item-pool.
The importance of studying students’ perceptions
of physical education
Students’ perceptions of PE have shown to be important from several perspectives (Kjønniksen, Fjørtoft, & Wold,
2009; O’Sullivan & MacPhail, 2011). From the student perspective, perceptions of PE are closely related to stu-dents’ personal feelings and thoughts about PE. It is an indicator of how PE is perceived based on individual students’ experiences of PE. From the student perspective, students’ perceptions of PE are important not due to future positive outcomes (e.g., high level of PA during leisure time), instead important in direct relation to PE– there and then (Groves & Laws, 2000; O’Sullivan &
MacPhail, 2011). Furthermore, students’ perceptions of
PE are also important from an outcome perspective (Archer & Garcia,2014; Kjønniksen et al.,2009), because it could be used to develop PE and improve students’ outcomes in PE (e.g., grade) (Archer & Garcia, 2014). Several researches describe the value of studying students’ perceptions of PE from an outcome perspective and describe that students’ perceptions of PE are a prerequisite for both participation and student learning in PE. In addition, positive perceptions of PE contribute to a lifelong interest in PA (Kjønniksen et al., 2009; Sollerhed, Ejlertsson, & Apitzsch,2005; Subramaniam & Silverman,2007; Swedish National Agency for Education [SNAE],2018). In this study, both perspectives was com-bined. This means, that the scales in the study were developed with an ambition to capture students’ own experiences of PE, thus, to reflect students’ perceived learning in PE and contentment in PE– from a student perspective. Thereafter, in the construction of the SEM-model, to analyze the interrelationship between students’
perceived learning and students’ perceived contentment in PE, the scale perceived learning in PE was set as the main outcome. From an outcome perspective, this is theoretically justified since students’ learning is, accord-ing to several researches, the main objective in PE (Chen & Ennis, 2004; Ennis, 2014; Larsson & Redelius, 2008). The hypothesized model is presented inFigure 1.
The aims of physical education
During the last decades, PE has evolved from a strong focus on hygiene and PA, to an emphasized focus on students’ learning, both related to physical movement as well as life-style and health (OECD,2017). There are some clear simi-larities between several countries regarding the aims of PE (Hardman, 2008; Hardman & Marshall, 2009; OECD,
2017). The aims of PE can be divided into three areas, 1) cognitive (knowledge/knowing), 2) affective (attitudes/ values) and 3) psycho-motor (skills/doing) (Hardman & Marshall,2000). These three areas are closely related to the aims of PE in Sweden (c.f. Hardman & Marshall,2000). The Swedish National Agency for Education (SNAE, 2018, p. 48) states that the aims of PE are that students can 1) move without restriction in different physical contexts, 2) plan, implement and evaluate sports and other physical activities based on different views of health, movement, and lifestyle, 3) carry out and adapt time recreational and outdoor life to different conditions and environments, and 4) prevent risks during physical activities, and manage emergency situations on land and in water. Furthermore, SNAE states that students should 5) develop their inter-personal skills and respect for others.
As a theoretical framework in this study, we use the (above) described aims in PE by Hardman and Marshall (2000) as well as SNAEs formulated aims in
Figure 1.Hypothesized model for the relationship between students perceived learning (Le) and perceived competence (Co), comfort (Cf) and joyfulness (Jo).
PE in Sweden, however, with a specific focus on two areas, namely 1) cognitive (knowledge/knowing) and 2) affective (attitudes/values). The third area, psycho-motor (skills/doing), is not included in this study. Mainly because other measurements have been devel-oped in this area in Sweden (Ericsson,2008) and from the same item-pool as the measurements in this study (e.g., Tidén, Lundqvist, & Nyberg, 2015). The two areas 1) cognitive (knowledge/knowing) and 2) affec-tive (attitudes/values) were initially used in the con-struction of the scales in the present study. The area, 1) cognitive (knowledge/knowing) was used as a theoretical frame in the construction of the one-dimensional scale in the present study (perceived learn-ing). Furthermore, the area 2) affective (attitudes/ values) was used as a theoretical frame in the construc-tion of the three-dimensional scale perceived content-ment in PE. Thereafter, the two areas (cognitive and affective) were used in the construction of the SEM-model in order to analyze the interrelationship between students’ perceived learning and students’ perceived contentment in PE. The SEM-model was developed based on the theoretical framework in the study; based on previous research (Chen & Ennis, 2004; Ennis, 2014; Larsson & Redelius, 2008; Subramaniam & Silverman, 2007), we hypothesized that students’
positive perceptions of PE has a positive effect on students’ perceived learning in PE – which was consid-ered the main outcome in PE (see Figure 1 for the hypothesized model).
Based on the fact that one primary aim in this study was to develop a scale to assess students’ perceived learning and a measurement to assess students’ per-ceived contentment in PE, this study is also grounded in psychometric/test theory (Nunnally & Bernstain,
1994). In psychometric theory, one fundamental idea is that the reliability and validity in measurements could be analyzed statistically (Thompson, 2004). Furthermore, the development of reliable measure-ments is based on psychometric information, which, when simplified, could be described as statistical infor-mation about the accuracy, reliability, and stability of the measurements. Psychometric/test theory offers sup-port for several statistical analyses that provide the researcher with psychometric data which may be used to develop reliable measurements in PE (Nunnally & Bernstain, 1994). For example, factor analysis is fre-quently used to develop measurements. The analyses can provide the researcher with information, for exam-ple, about how well items measure the (same) under-lying construct(s) (Field, 2016; Nunnally & Bernstain,
1994). Furthermore, several analyses are available to examine the validity and reliability of the instrument
(Foster & Cone, 1995). One of the most widely used tests to analyze internal consistency is Cronbach’s alpha (α) (Cronbach, 1951; Tavakol & Dennick, 2011). To analyze construct validity, Fornell and Larcker (1981) provide support for the use of convergent and discri-minant validity analyses by calculating composite relia-bility (CR), average variance extracted (AVE), and the square root of average variance extracted (√AVE). There are also procedures to analyze measurement invariance, which refer to ”the extent to which a measuring instrument is equivalent across two or more independent samples” (Byrne, 2008, p. 872). Several procedures to analyze measurement invariance have been suggested, which include configural, metric and scalar invariance (Byrne, 2008; Muthén & Asparouhov, 2018).
Method
Since 2001, the School-Sport-Health (SSH) study has been an interdisciplinary and longitudinal Swedish pro-ject with a focus on PA, health, and sports among children and adolescents. The SSH study consists of a large item-pool with single items/question measures in several areas including PE, PA, psycho-motor skills and medicine. Through the years (2004, 2007, and 2010), data have been collected from the same students at ages 9, 12, and 15 until they were 18, 21, and 24 years old. In this study, only data on students’ perceptions of PE collected in 2016 was used.
Participants
The study participants consisted of 1203 students (girls n = 598, boys n = 594, and 11 students who did not report gender) from grade 6 (n = 562) and grade 9 (n = 641). Students from grade 6 and 9 were selected to capture the variety of experiences students from different age groups could have about PE. The students came from the same schools (N = 24) or the same geographical areas as the randomly selected schools in the first SSH study (see Sundblad, Saartok, Engström, & Renström, 2005, for more details about the process of randomly selecting schools for the first SSH study). The students in grade 6 were aged 12 to 13 years, and the students in grade 9 were aged 15 to 16 years.
Procedure
Before the data were collected, students received writ-ten and oral information in accordance with the rules and prevailing ethical practice. The confidentiality of answers was emphasized when informing the students.
Throughout all the stages of the analysis, the identity of the students was coded to ensure anonymity. The data were collected by co-authors in accordance with the approved application by the ethical review board at Karolinska Institute, Sweden (ref. no. 00–416).
Questionnaire and coding
The questionnaire developed in the SSH study has remained unchanged to enable comparisons over time, and it has been used both in longitudinal and cross-sectional studies since 2001 (e.g., Tidén et al.,2015). The SSH-questionnaire consists of single items/question mea-sures in several areas including PE, PA, psycho-motor skills and medicine. In this study, only items on students’ perceptions of PE collected in 2016 was used. The items (seeTable 1) were developed in order to capture several aspects of students’ perceptions of PE and include stu-dents’ perceptions of their own capacity in PE, percep-tions related to wellbeing in PE and perceppercep-tions related to engagement and learning in PE. The questionnaire was developed in a series of steps that included revising ques-tions after discussions with students and experts (researchers and university teachers in PE teacher educa-tion). The questionnaire has demonstrated its validity in construction and high reliability in a test–retest proce-dure,“when a class (28 students) in grade 9 answered the questionnaire on two occasions with one week in between” (Thedin Jakobsson,2015, p. 52). In the present
study, students answered 24 items based on the question, “How well do these statements describe your idea of PE and how do you feel when you have PE?” The response alternatives were: certainly true (score 3), somewhat true (score 2), not true (score 1) or often/always (score 3), sometimes (score 2), almost never/never (score 1). When negative and positive items were included in the same factor, the negative items were reversely coded.
Data analysis
The analyses include exploratory factor analysis (EFA), confirmatory factor analysis (CFA), analyses to examine construct and convergent validity, analyses to examine measurement invariance and finally structural equation modeling analyses (SEM). Of the total number of students in the study (N = 1203), half of the students (n = 601) were used in the EFA and the remaining part (n = 602) in the CFA and SEM-model. The chi-square analysis showed that there were no significant differences between the datasets for gender distribution (χ2(1) = .410, p = .524), grade distribution (χ2(1) = .610, p = .434) or national origin distribution (χ2(1) = .801, p = .372).
Exploratory factor analysis
The EFA was conducted in SPSS (version 24) by an extraction from maximum likelihood (ML) and promax rotation, as we expected a correlation between the factors. No fixed factor assumptions were used, and items with a factor loading < .50 and with communal-ities (h2) < .30 were excluded from the analysis.
Confirmatory factor analysis
The CFA was conducted in Mplus version 7.4 (Muthén & Muthén,1998–2017). All available data were used, and the maximum likelihood robust (MLR) estimation method was used in the analysis. Model fit was evaluated from χ2
-test and χ2-test divided by degrees of freedom (χ2/df), where the value 2.0 indicates a good fit and 2.0 to 5.0 an acceptable fit (Hair, Black, Babin, & Anderson,2010). For the comparative fit index (CFI), the value .90 was accep-table and .95 was good. Furthermore, a good model fit for the root-mean-square error of approximation (RMSEA) was < .06, and for standardized root-mean-square residual (SRMR) < .08 (Hu & Bentler,1999).
Reliability and validity
The reliability of items and scales was evaluated based on reliability coefficients (R2), Cronbach’s alpha (α) (≥ .70) and factor loadings (≥ .50) (Cronbach,1951; Hair et al.,
Table 1.Scales, items, and abbreviations in brackets.
Scale Items Abbreviations
Perceived learning
I get stronger and fitter I am getting better at sports I get to learn such that I can benefit from
I learn to work together with others I learn about how the body works I learn how different sports are done
(Le1) (Le2) (Le3) (Le4) (Le5) (Le6) Perceived competence
I can show others that I am good at sports
(Co1)
Bad (Co2)
Good (Co3)
I often feel that I am bad at sports (Co4) Perceived comfort Scared (Cf1) Worried (Cf2) Stressed (Cf3) Excluded (Cf4)
I feel bad about changing and showering at school
(Cf5) (Cf6) I do not like when we split into teams
Safe
(Cf7) Perceived
joyfulness
I think physical education in school should be voluntary
(Jo1)
Happy (Jo2)
I would not like to participate (Jo3) I think it is fun (Jo4)
Bored (Jo5)
I get relaxation from the usual school work
(Jo6) Physically tired (sweaty) (Jo7)
2010; Nunnally & Bernstain,1994). Construct validity was evaluated through convergent and discriminant validity. The convergent validity was examined by calculating the average variance extracted (AVE) and composite reliabil-ity (CR). The average variance extracted (AVE)“measures the amount of variance that is captured by the construct in relation to the amount of variance due to measurement error” (Fornell & Larcker,1981, p. 45), and≥ .50 was used as a guideline value. Regarding CR, the value ≥ .70 indicates an adequate reliability of individual factors (Fornell & Larcker,1981). To evaluate discriminant valid-ity, which refers to the extent to which the factors differ from other factors, the correlation between factors should preferably be smaller than the square root of AVE (√AVE) (Fornell & Larcker, 1981; see also Hair, Hult, Ringle, & Sarstedt,2017; Teo, Lee, Chai, & Wong,2009).
Group invariance
Measurement invariance refers to the consistency of factor structure across different groups, in this study between girls and boys. Analyses to evaluate measure-ment invariance was conducted in several steps. First, separate models for girls and boys were estimated. Thereafter, measurement invariance was analyzed in three steps, as suggested in earlier research (Byrne,
2008; Muthén & Asparouhov, 2018). The three steps included analyses for configural, metric and scalar invariance. In the first step, the configural invariance model had no restrictions for any of the parameters, thus, not for factor loadings or measurement intercepts. The second step, the metric invariance, holds the factor loadings equal across girls and boys, and is therefore more restrictive. The final step, scalar invariance, holds both measurements intercepts (of items) and factor loadings equal across girls and boys. Therefore, it is also the most restrictive analysis for measurement invariance (Muthén & Asparouhov,2018).
Structural equation modeling
The SEM analysis was conducted in Mplus version 7.4 (Muthén & Muthén,1998–2017). The SEM analysis was used to examine the interrelationship between students’ contentment in PE and students’ perceived learning in PE in line with the hypothesized model (see Figure 1). Based on theoretical reasons, students’ perceived learning was the main outcome latent variable and the other latent variables were considered as predictors. In the analysis, the MLR estimation method and all available data were used. Model fit was evaluated based on predetermined criteria. That is,χ2-test andχ2-test divided by degrees of freedom (χ2/df). For the latter, the value 2.0 indicates
a good fit and 2.0 to 5.0 an acceptable fit (Hair et al.,
2010). A good model fit was indicated by a RMSEA value < .06 and a SRMR value < .08. Furthermore, by a CFI value of .90 (acceptable) and .95 (good).
Results
EFA, dataset 1
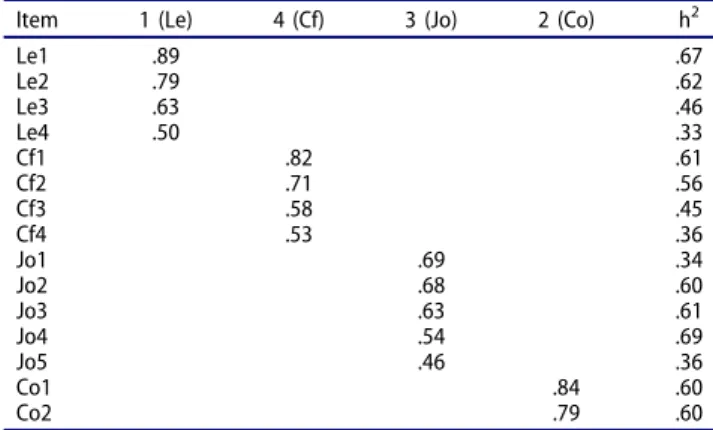
The results from Bartlett’s Test of Sphericity (p = < .001) and Kaiser-Meyer-Olkin Measure of Sampling Adequacy (.900) indicate that the data were suitable for EFA. The EFA was conducted with extraction from the maximum likelihood method (ML) and promax rotation. The results showed a four-factor solution (see Table 2). Experts (researchers and university teachers in PE teacher educa-tion) discussed adequate names for the factors. The four factors were named learning, competence, comfort, and joyfulness.
CFA, dataset 2
Based on the theoretical framework in the study, the result from the EFA analysis was discussed by experts and two CFA models were estimated. Factor loadings for the first model, the one-dimensional model perceived learning showed there was psychometric support for the scale. Fit indices for the second model, students’ contentment in PE, a model with three factors, perceived competence, comfort, and joyfulness showed that the model fits the data well:χ2(32) = 105.299, p = < .001;χ2/df = 3.29; CFI = .96; RMSEA = .06; SRMR = .04.
The construct validity and the reliability of items and latent variables (learning, competence, comfort, and joy-fulness) were evaluated based on predetermined criteria (factor loadings,α, CR, AVE and √AVE).Table 3shows that the criteria for all latent variables were met for
Table 2.Factor loadings and communalities (h2) from EFA for four factors and 15 items.
Item 1 (Le) 4 (Cf) 3 (Jo) 2 (Co) h2
Le1 .89 .67 Le2 .79 .62 Le3 .63 .46 Le4 .50 .33 Cf1 .82 .61 Cf2 .71 .56 Cf3 .58 .45 Cf4 .53 .36 Jo1 .69 .34 Jo2 .68 .60 Jo3 .63 .61 Jo4 .54 .69 Jo5 .46 .36 Co1 .84 .60 Co2 .79 .60
Note: Le = Learning, Cf = comfort, Co = competence, Jo = joyfulness; All standardized factor loadings are significant (p < .01).
Cronbach’s alpha (≥ .70) and CR (≥ .70). The criteria for AVE (≥ .50) were fully met for competence and joyfulness but not fully met for comfort (.47) and learning (.49). However, the difference between the predetermined cri-teria for AVE≥ .50 and the results (.47 and .49) was small and considered less important. Therefore, the latent vari-ables (learning, competence, comfort, joyfulness) show an overall a good convergent validity. Finally, the criteria for discriminant validity (i.e., that the correlation between factors, preferably should be smaller than the square root of AVE) were fully met for competence and comfort, but not for learning and joyfulness. However, for both learning and joyfulness, the difference between the actual value (learning = .70; joyfulness = .73) and the correlation with the other latent variables were small (≤ .02). Therefore, the latent variables indicate overall a good discriminant validity.
Gender invariance, dataset 2
Measurement invariance was analyzed through several steps. First, the analyses were conducted separately for girls and boys. The results from the separate, girls/boys, models– students’ perceived learning and contentment in PE– indicate a good model fit (seeTable 4). Thereafter, invariance analyses were conducted in three steps by lyzing configural, metric and scalar invariance. The ana-lyses were conducted both for the model students’ perceived learning and the model contentment in PE.
The results, presented inTable 4, indicate a reasonable fit for all models. Furthermore, based on Satorra and Bentler (2001) Chi-squared difference test, the configural, metric and scalar models were compared. The results indicated that the models remained measurement invariant when 1) the model is unconstrained (configural), 2) factor loadings are held equal across groups (metric) and 3) both factor loadings and measurement intercepts are equal. Overall, the CFA model for the scale perceived learning in PE as well as the CFA model for students’ contentment in PE – were gender invariant based on a high degree of measure-ment invariance (Meredith & Teresi, 2006; Muthén & Asparouhov,2018).
The interrelationship between students’ contentment
in PE and perceived learning in PE, dataset 2
In the SEM-model, students’ perceived learning was the main outcome and the three aspects (perceived compe-tence, comfort and joyfulness) of students’ contentment in PE were considered interrelated latent variables and predictors. The first model (presented inFigure 1) showed somewhat low model fit,χ2(72) = 302.204, p = < .001;χ2/df = 4.20; CFI = .91; RMSEA = .07; SRMR = .07. Based on theoretical reasons a relationship between competence and joyfulness was added (presented inFigure 2). The result showed a good model fit,χ2(71) = 180.271, p = < .001;χ2/df = 2.54; CFI = .96; RMSEA = .05; SRMR = .04. Modification index showed that cross loading between some of the
Table 3.Confirmatory factor analysis for latent variables with convergent,– and discriminant validity measures.
Construct Factor loadings S.E. Error variances R2 α AVE CR
Construct perceived learning
Factor (Le) .79 .49 .79
Le2 .79* .03 .37 .63
Le1 .78* .03 .39 .61
Le3 .62* .04 .62 .38
Le4 .59* .04 .65 .35
Construct perceived contentment
Factor (Co) .82 .69 .82 Co2 .83* .03 .31 .69 Co1 .83* .03 .31 .69 Factor (Cf) .76 .47 .78 Cf1 .75* .04 .44 .56 Cf2 .69* .05 .52 .48 Cf3 .62* .04 .62 .38 Cf4 .66* .04 .57 .43 Factor (Jo) .81 .53 .81 Jo4 .81* .03 .35 .65 Jo3 .71* .04 .50 .50 Jo5 .58* .04 .67 .33 Jo2 .78* .03 .40 .60
Discriminant validity Factor Le Factor Co Factor Cf Factor Jo
Factor Le .70 ¤
Factor Co .60* .83 ¤
Factor Cf .32* .50* .69 ¤
Factor Jo .72* .73* .53* .73 ¤
Note. * = All standardized factor loadings are significant (p < .01); R2= 1-item error variance;α = Cronbach’s alpha (Cronbach,1951); AVE = average variance extracted
(Fornell & Larcker, 1981); CR = composite reliability (Fornell & Larcker, 1981); Discriminant validity = the extent to which constructs differ (Teo et al., 2009); vertical/ horizontal columns show the correlation between factors, which preferably should be smaller than square root of AVE (¤ =√AVE) (Fornell & Larcker, 1981); Le = learning, Co = competence, Cf = comfort, Jo = joyfulness.
manifest and latent variables would improve model fit significantly. The highest cross loading was between the manifest variable Jo3 and latent variable comfort (MImax = 21.62), however, no adjustments were made to preserve the simplicity of the model.
The predictors explained the variance in students’ perceived learning with 54%. The effect between stu-dents’ joyfulness and students’ perceived learning was positive (.64) as well as students’ competence and stu-dents’ perceived learning (.20). Nevertheless, the direct effect between students’ comfort and students’ per-ceived learning was negative (−.13). However, the indirect effect through the two other latent variables was still positive, students’ joyfulness (β = .14; SE = .04; p = < .001) and competence (β = .10; SE = .04; p = .013). This indicates, that students’ comfort is positively related to students’ perceived learning, through stu-dents’ perceived joyfulness (.22) and students’ compe-tence (.50). The result is illustrated inFigure 2.
Discussion
Compared to several other measurements developed to assess students’ perceptions of PE, this study includes a scale to assess students’ perceived learning in PE. Even though learning is described as the main objective in PE (Chen & Ennis, 2004; Ennis, 2014; Larsson & Redelius,
2008), there are few measurements developed to assess student learning in PE (López-Pastor et al.,2013). Several researchers describe that little is known about how students’ perceived learning in PE is related to other aspects of PE, such as students’ perceptions of PE, students participation in PA and the long-term impact of PE (Green,2012; López-Pastor et al.,2013; Trudeau & Shephard,2008). The lack of measurements may be due to several reasons. Among others, due to the difficulty of operationalizing learning in PE since the learning objectives are context-driven and vary
highly (Groves & Laws, 2000; O’Sullivan & MacPhail, 2011). Therefore, the aim of the current study was to develop a scale to assess students’ perceived learning and a measurement to assess students’ perceived contentment in PE, and furthermore, to analyze the interrelationship between students’ perceived learning and students’ per-ceived contentment in PE. The scales were developed in line with the theoretical framework in the study, based on the main aims of PE, which can be divided into two areas, 1) cognitive (knowledge/knowing) and 2) affective (attitudes/ values) (Hardman & Marshall, 2000). The scales were developed through exploratory and confirmatory factor analyses, thereafter, evaluated based on convergent and discriminant validity measures and finally analyses to assess measurement invariance. The results showed a one-dimensional model (perceived learning) and a three-dimensional model (perceived contentment in PE), with three factors, competence, comfort and joyfulness. Fit indices and factor structure show that the two CFA models fit the data well. With minor exceptions, all predetermined criteria were met for factor loadings, Cronbach’s alpha, and convergent and discriminant validity (Cronbach, 1951; Fornell & Larcker, 1981; Teo et al., 2009). Measurement invariance was analyzed in several steps as suggested in earlier research (Byrne, 2008; Muthén & Asparouhov,
2018). The results showed a high degree of measurement invariance (Meredith & Teresi,2006).
Although there was psychometric support for all scales in the study, the development of measurements is an ongoing process (Thompson,2004). This study was con-ducted in a Swedish context, and the items in the ques-tionnaire were in Swedish. Further development of the scales is important, especially if the instrument is used in countries other than Sweden. A limitation is that the scale perceived competence consists of only two items. However, this is understandable given that the criteria for factor inclusion in the factor analysis were set high.
Table 4.Result for measurement invariance based on separate models, configural, metric, and scalar invariance.
Model χ2(df) χ2/df p CFI SRMR ΔSBχ2(df) p Model Learning Separate models Boys χ2(2) = .751 .38 .687 Girls χ2(2) = 1.810 .91 .405 Model Contentment Separate models Boys χ2(32) = 66.218 2.07 <.001 .938 .06 Girls χ2(32) = 77.722 2.43 <.001 .957 .04 Model Learning Gender invariance Configural χ2(4) = 2.504 .63 .644 †χ2(3) = 6.276 .099 Metric χ2(7) = 8.665 1.24 .278 1 .06 ††χ2(6) = 11.179 .083 Scalar χ2(10) = 13.478 1.35 .198 .99 .07 †††χ2(3) = 4.871 .182 Model Contentment Gender invariance Configural χ2(64) = 143.436 2.24 <.001 .95 .05 †χ2(7) = 11.464 .120 Metric χ2(71) = 153.848 2.17 <.001 .95 .07 ††χ2(14) = 22.319 .072 Scalar χ2(78) = 165.125 2.12 <.001 .94 .07 †††χ2(7) = 10.720 .151 Note.†Metric compared to configural;††Scalar compared to configural;†††Scalar compared to metric.
Nevertheless, additional items should be added to improve the scale perceived competence.
The SEM-model was developed based on the theore-tical framework in the study; based on previous research (Chen & Ennis, 2004; Ennis, 2014; Larsson & Redelius,
2008; Subramaniam & Silverman, 2007), our hypothesis was that positive perceptions of PE has a positive effect on students’ perceived learning in PE – which was consid-ered the main outcome in PE (see Figure 1 for the hypothesized model). Based on this hypothesis, one latent variable (students’ perceived learning) was the main out-come. The result showed, as expected, that there was a strong positive relationship between perceived learning and perceived competence and joyfulness, however, that there was a direct (weak) negative relationship between comfort and perceived learning in PE. This indicate that, students’ perceived competence and especially students’ perceived joyfulness seems to be important aspects in relation to students’ perceived learning in PE. The impor-tance of enjoyment and fun in PE is established in several studies (Barr-Anderson et al., 2008; Cunningham,2007). In this study, we show that students’ perceived joyfulness in PE is an important factor in relation to students’ perceived learning in PE– when both students’ perceived competence and comfort in PE is taken into account.
This study offers psychometric support for a scale to assess students’ perceived learning in PE and
a measurement to assess perceived contentment in PE. Although that validated and reliable measurements are important, this study also shows that there is a positive relationship between students’ contentment in PE and stu-dents’ perceived learning in PE. This indicates that positive perceptions of PE could affect students’ perceived learning in PE. Students’ experiences from PE that strengthen stu-dents’ positive perceptions of PE could therefore also posi-tively affect students’ perceived learning in PE.
Funding
This study was financed by Malmö University in collabora-tion with the Swedish School of Sport and Health Sciences in Stockholm.
References
Ajzen, I., & Fishbein, M. (1980). Understanding attitudes and predicting social behavior. Englewood Cliffs, NJ: Prentice-Hall.
Archer, T., & Garcia, D. (2014). Physical exercise influences academic performance and well-being in children and adolescents. International Journal of School and Cognitive Psychology, 102(1), 1–3.
Bailey, R. (2006). Physical education and sport in schools: A review of benefits and outcomes. Journal of School Health, 76(8), 397–401. doi:10.1111/josh.2006.76.issue-8 Figure 2.Result from the structural equation modeling with standardized values for the interrelationship between students’ perceived learning (Le) and perceived competence (Co), comfort (Cf) and joyfulness (Jo). Explained variance (R2) and standard error in parenthesis.
Barr-Anderson, D. J., Neumark-Sztainer, D., Schmitz, K. H., Ward, D. S., Conway, T. L., Pratt, C.,… Pate, R. R. (2008). But I like PE: Factors associated with enjoyment of physi-cal education class in middle school girls. Research Quarterly for Exercise and Sport, 79(1), 18–27.
Byrne, B. M. (2008). Testing for multigroup equivalence of a measuring instrument: A walk through the process. Psicothema, 20(4), 872–882.
Carroll, B., & Loumidis, J. (2001). Children’s perceived com-petence and enjoyment in physical education and physical activity outside school. European Physical Education Review, 7(1), 24–43. doi:10.1177/1356336X010071005 Chen, A., & Ennis, C. D. (2004). Goals, interests, and learning
in physical education. The Journal of Educational Research, 97(6), 329–339. doi:10.3200/JOER.97.6.329-339
Chen, S., Chen, A., & Zhu, X. (2012). Are K-12 learners motivated in physical education? A meta-analysis. Research Quarterly for Exercise and Sport, 83(1), 36–48. doi:10.1080/02701367.2012.10599823
Cronbach, L. J. (1951). Coefficient alpha and the internal structure of tests. Psychometrika, 16(3), 297–334. doi:10.1007/BF02310555
Cunningham, G. B. (2007). Development of the physical activity class satisfaction questionnaire (PACSQ). Measurement in Physical Education and Exercise Science, 11(3), 161–176. doi:10.1080/10913670701326443
Donovan, C. B., Mercier, K., & Phillips, S. R. (2015). Investigating attitudes toward physical education: Validation across two instruments. Measurement in Physical Education and Exercise Science, 19(2), 91–98. doi:10.1080/1091367X.2015.1012511
Ekblom-Bak, E., Ekblom, Ö., Andersson, G., Wallin, P., & Ekblom., B. (2018). Physical education and leisure-time physical activity in youth are both important for adulthood activity, physical performance, and health. Journal of Physical Activity and Health, 15(9), 661–670. doi:10.1123/ jpah.2018-0539
Ennis, C. D. (2014). The role of students and content in teacher effectiveness. Research Quarterly for Exercise and Sport, 85(1), 6–13. doi:10.1080/02701367.2014.872979 Ericsson, I. (2008). To measure and improve motor skills in
practice. International Journal of Pediatric Obesity, 3(1), 21–27. doi:10.1080/17477160801896366
Field, A. P. (2016). An adventure in statistics: The reality enigma. London, UK: SAGE.
Fornell, C., & Larcker, D. F. (1981). Evaluating structural equation models with unobservable variables and measure-ment error. Journal of Marketing Research, 18(1), 39–50. doi:10.1177/002224378101800104
Foster, S. L., & Cone, J. D. (1995). Validity issues in clinical assessment. Psychological Assessment, 7(3), 248–260. doi:10.1037/1040-3590.7.3.248
Green, K. (2012). Mission impossible? Reflecting upon the relationship between physical education, youth sport and lifelong participation. Sport, Education and Society, 19(4), 1–19.
Groves, S., & Laws, C. (2000). Children’s experiences of physical education. European Journal of Physical Education, 5(1), 19–27. doi:10.1080/174089800050102 Hair, J. F., Black, W. C., Babin, B. J., & Anderson, R. E.
(2010). Multivariate data analysis: A global perspective (7th ed.). Upper Saddle River, NJ: Prentice Hall.
Hair, J. F., Hult, G. T. M., Ringle, C. M., & Sarstedt, M. (2017). A primer on partial least squares structural equa-tion modeling (PLS-SEM) (2nd ed.). Los Angeles, CA: Sage. Hardman, K. (2008). The situation of physical education in schools: A European perspective. Human Movement, 9(1), 5–18. doi:10.2478/v10038-008-0001-z
Hardman, K., & Marshall, J. (2000). World-wide survey of the state and status of school physical education: The final report to the International Olympic Committee. Manchester, UK: University of Manchester.
Hardman, K., & Marshall, J. (2009). Second world-wide survey of school physical education. Final Report. Berlin, Germany: ICSSPE.
Hu, L. T., & Bentler, P. M. (1999). Cutoff criteria for fit indexes in covariance structure analysis: Conventional cri-teria versus new alternatives. Structural Equation Modeling: A Multidisciplinary Journal, 6(1), 1–55. doi:10.1080/10705519909540118
Kendzierski, D., & DeCarlo, K. J. (1991). Physical activity enjoyment scale: Two validation studies. Journal of Sport & Exercise Psychology, 13(1), 50–64. doi:10.1123/ jsep.13.1.50
Kjønniksen, L., Fjørtoft, I., & Wold, B. (2009). Attitude to physical education and participation in organized youth sports during adolescence related to physical activity in young adulthood: A 10-year longitudinal study. European Physical Education Review, 15(2), 139–154. doi:10.1177/ 1356336X09345231
Kougioumtzis, K., & Patriksson, G. (2015). Ninth grade stu-dents’ beliefs about physical education and the impact of weekly lessons. Gothenburg, Sweden: University of Gothenburg.
Kristjánsson, Á. L., Sigfúsdóttir, I. D., Allegrante, J. P., & Helgason, Á. R. (2009). Adolescent health behavior, con-tentment in school, and academic achievement. American Journal of Health Behavior, 33(1), 69–79.
Larsson, H., & Redelius, K. (2008). Swedish physical edu-cation research questioned—Current situation and future directions. Physical Education & Sport Pedagogy, 13(4), 381–398. doi:10.1080/ 17408980802353354
Lindwall, M., & Lundqvist, C. (2004). Att mäta äpplen och tolka päron: Ett kritiskt förhållningssätt till mätning och psykometri inom idrottsforskning. Svensk Idrottsforskning, 13(3), 52–55.
López-Pastor, V. M., Kirk, D., Lorente-Catalán, E., MacPhail, A., & Macdonald, D. (2013). Alternative assess-ment in physical education: A review of international literature. Sport, Education and Society, 18(1), 57–76. doi:10.1080/13573322.2012.713860
Lyyra, N., Leskinen, E., & Heikinaro-Johansson, P. (2015). Factorial validity and reliability of the curricular goals in physical education questionnaire. Measurement in Physical Education and Exercise Science, 19(2), 69–79. doi:10.1080/ 1091367X.2015.1038822
McKenzie, T. L., Sallis, J. F., & Nader, P. R. (1992). SOFIT: System for observing fitness instruction time. Journal of Teaching in Physical Education, 11(2), 195–205. doi:10.1123/jtpe.11.2.195
Meredith, W., & Teresi, J. A. (2006). An essay on measure-ment and factorial invariance. Medical Care, 44(11), 69–77. doi:10.1097/01.mlr.0000245438.73837.89
Metsämuuronen, J., Svedlin, R., & Ilic, J. (2012). Change in Pupils’ and Students’ attitudes toward school as a function of age– A finnish perspective. Journal of Educational and Developmental Psychology, 2(2), 134–151. doi:10.5539/jedp. v2n2p134
Mitchell, S. A. (1996). Relationships between perceived learn-ing environment and intrinsic motivation in middle school physical education. Journal of Teaching in Physical Education, 15(3), 369–383. doi:10.1123/jtpe.15.3.369 Motl, R. W., Dishman, R. K., Saunders, R., Dowda, M.,
Felton, G., & Pate, R. R. (2001). Measuring enjoyment of physical activity in adolescent girls. American Journal of Preventive Medicine, 21(2), 110–117. doi: 10.1016/S0749-3797(01)00326-9
Muthén, B., & Asparouhov, T. (2018). Recent methods for the study of measurement invariance with many groups: Alignment and random effects. Sociological Methods & Research, 47(4), 637–664. doi:10.1177/0049124117701488 Muthén, L. K., & Muthén, B. O. (1998–2017). Mplus user’s
guide (8th ed.). Los Angeles, CA: Muthén & Muthén. Nunnally, J. C., & Bernstain, I. H. (1994). Psychometric theory
(3rd ed.). New York, NY: McGraw-Hill.
Nyberg, G., & Larsson., H. (2014). Exploring‘what’ to learn in physical education. Physical Education and Sport Pedagogy, 19(2), 123–135. doi:10.1080/17408989.2012.726982
O’Sullivan, M., & MacPhail, A. (2011). Young people’s voices in physical education and youth sport. London, UK: Routledge.
Organisation for Economic Co-operation and Development. (2017). PISA 2015 results. (Volume III), Students’ well-being. Paris, France: OECD.
Paxton, R. J., Nigg, C., Motl, R. W., Yamashita, M., Chung, R., Battista, J., & Chang, J. (2013). Physical activity enjoyment scale short form—Does it fit for children? Research Quarterly for Exercise and Sport, 79(3), 423–427. doi:10.1080/02701367.2008.10599508
Phillips, S. R., & Silverman, S. (2012). Development of an instrument to assess fourth and fifth grade students’ atti-tudes toward physical education. Measurement in Physical Education and Exercise Science, 16(4), 316–327. doi:10.1080/1091367X.2012.693359
Placek, J. (1983). Conceptions of success in teaching: Busy, happy and good? In T. Templin & J. Olson (Eds.), Teaching in physical education (pp. 46–56). Champaign, IL: Human Kinetics.
Rink, J. E. (2013). Measuring teacher effectiveness in physical education. Research Quarterly for Exercise and Sport, 84(4), 407–418. doi:10.1080/02701367.2013.844018
Sánchez-Oliva, D., Kinnafick, F., Smith, N., & Stenling, A. (2018). Assessing perceived need support and need satis-faction in physical education: Adaptation and validation with english students. Measurement in Physical Education and Exercise Science, 22(4), 332–342. doi:10.1080/ 1091367X.2018.1461627
Satorra, A., & Bentler, P. M. (2001). A scaled difference Chi-square test statistic for moment structure analysis. Psychometrika, 66(4), 507–514. doi:10.1007/BF02296192 Scrabis-Fletcher, K., & Silverman, S. (2010). Perception of
competence in middle school physical education.
Research Quarterly for Exercise and Sport, 8(1), 52–61. doi:10.1080/02701367.2010.10599627
Silverman, S., & Subramaniam, P. R. (1999). Student attitude toward physical education and physical activity: A review of measurement issues and outcomes. Journal of Teaching in Physical Education, 19(1), 97–125. doi:10.1123/ jtpe.19.1.97
Sollerhed, A.-C., Ejlertsson, G., & Apitzsch, E. (2005). Predictors of strong sense of coherence and positive atti-tudes to physical education in adolescents. Scandinavian Journal of Public Health, 33(5), 334–342. doi:10.1080/ 14034940510005851
Subramaniam, P. R., & Silverman, S. (2007). Middle school students’ attitudes toward physical education. Teaching and Teacher Education, 23(5), 602–611. doi:10.1016/j. tate.2007.02.003
Sundblad, G., Saartok, T., Engström, L.-M., & Renström, P. (2005). Injuries during physical activity in school children. Scandinavian Journal of Medicine & Science in Sports, 15(5), 313–323. doi: 10.1111/j.1600-0838.2004.00419.x
Swedish National Agency for Education. (2018). Curriculum for the compulsory school, preschool class and school-age educare 2011: Revised 2018. Stockholm, Sweden: Skolverket.
Swedish Schools Inspectorate. (2018). Kvalitetsgranskning av ämnet idrott och hälsa i årskurs 7–9. Author.
Tavakol, M., & Dennick, R. (2011). Making sense of Cronbach’s alpha. International Journal of Medical Education, 2, 53–55. doi:10.5116/ijme.4dfb.8dfd
Taylor, J. (2012). Students’ and Teachers’ perceptions of phy-sical education (Doctoral dissertation). Retrieved from https://research.avondale.edu.au/theses_bachelor_hon ours/10
Teo, T., Lee, C. B., Chai, C. S., & Wong, S. L. (2009). Assessing the intention to use technology among pre-service teachers in Singapore and Malaysia: A multigroup invariance analysis of the technology accep-tance model (TAM). Computers & Education, 53(3), 1000–1009. doi:10.1016/j.compedu.2009.05.017
Thedin Jakobsson, B. (2015). Vilka stannar kvar och varför?: En studie om ungas föreningsidrottande under uppväxtåren (Doctoral dissertation). Retrieved from http://urn.kb.se/ resolve?urn=urn:nbn:se:gih:diva-3631
Thompson, J. K. (2004). The (mis)measurement of body image: Ten strategies to improve assessment for applied and research purposes. Body Image, 1(1), 7–14. doi:10.1016/S1740-1445(03)00004-4
Tidén, A., Lundqvist, C., & Nyberg, M. (2015). Development and initial validation of the NyTid Test: A movement assessment tool for compulsory school pupils. Measurement in Physical Education and Exercise Science, 19(1), 34–43. doi:10.1080/1091367X.2014.975228
Trudeau, F., & Shephard, R. J. (2008). Is there a long-term health legacy of required physical education? Sports Medicine, 38(4), 265–270. doi: 10.2165/00007256-200838040-00001
Wang, J., & Wang, X. (2012). Structural equation modeling applications using Mplus. Chichester, West Sussex: Wiley.