New ultrasonographic approaches to
monitoring cardiac and vascular function
Anna Bjällmark Doctoral Thesis TRITA‐STH Report 2009:7 Division of Medical Engineering, School of Technology and Health, KTH (Royal Institute of Technology)Academic dissertation which with permission from Kungliga Tekniska Högskolan (Royal Institute of Technology) in Stockholm is presented for public review for passing the doctoral examination on Friday January 22, 2010, at 13.00. In lecture hall 3‐221, Alfred Nobels allé 10, Huddinge, Sweden. TRITA‐STH Report 2009:7 ISSN: 1653‐3836 ISRN: KTH /STH/‐‐09:7‐SE ISBN: 978‐91‐7415‐525‐9 © Anna Bjällmark, Stockholm 2009
i
Summary
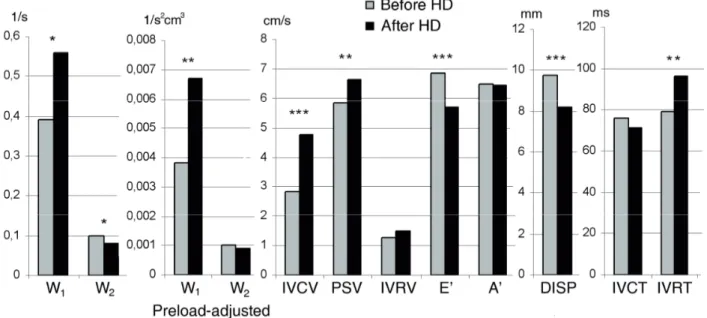
Atherosclerotic cardiovascular disease is the leading cause of death worldwide. To decrease mortality and morbidity in cardiovascular disease, the development of accurate, non‐invasive methods for early diagnosis of atherosclerotic cardiac and vascular engagement is of considerable clinical interest. Cardiovascular ultrasound imaging is today the cornerstone in the routine evaluation of cardiovascular function and recent development has resulted in two new techniques, tissue velocity imaging (TVI) and speckle tracking, which allow objective quantification of cardiovascular function. TVI and speckle tracking are the basis for three new approaches to cardiac and vascular monitoring presented in this thesis: wave intensity wall analysis (WIWA), two‐ dimensional strain imaging in the common carotid artery, and the state diagram of the heart.WIWA uses longitudinal and radial strain rate as input for calculations of wave intensity in the arterial wall. In this thesis, WIWA was validated against a commercially available wave intensity system, showing that speckle tracking‐derived strain variables can be useful in wave intensity analysis. WIWA was further tested in patients with end stage renal disease and documented high mortality in cardiovascular disease. The latter study evaluated the effects of a single session of hemodialysis using WIWA and TVI variables and showed improved systolic function after hemodialysis. The results also indicated that preload‐adjusted early systolic wave intensity obtained by the WIWA system may contribute in the assessment of left ventricular contractility in this patient category. Two‐dimensional strain imaging in the common carotid artery is a new approach showing great potential to detect age‐dependent differences in mechanical properties of the common carotid artery. Among the measured strain variables, global circumferential strain had the best discriminating performance and appeared to be superior to conventional measures of arterial stiffness such as elastic modulus and β stiffness index. The state diagram is a visualisation tool that provides a quantitative overview of the temporal interrelationship of mechanical events in the left and right ventricles. Case examples and a small clinical study showed that state diagrams clearly visualize cardiac function and can be useful in the detection of non ST‐elevation myocardial infarction (NSTEMI).
Even though WIWA, two‐dimensional strain imaging in the common carotid artery and the state diagram show potential to be useful in the evaluation of cardiovascular function, there still remains a considerable amount of work to be done before they can be used in the daily clinical practice.
ii
iii
List of publications
The thesis is based on the following papers: I. Wave intensity wall analysis: a novel noninvasive method to measure wave intensity.Matilda Larsson, Anna Bjällmark, Britta Lind, Rita Balzano, Michael Peolsson, Reidar Winter, Lars‐Åke Brodin. Heart and Vessels. 2009;24(5):357‐65. II. Effects of hemodialysis on the cardiovascular system: Quantitative analysis using wave intensity wall analysis and tissue velocity imaging. Anna Bjällmark, Matilda Larsson, Jacek Nowak, Britta Lind, Shirley Yumi Hayashi, Marcelo Mazza do Nascimento, Miguel Riella, Astrid Seeberger, Lars‐Åke Brodin. Submitted to Heart and Vessels. III. Ultrasonographic strain imaging is superior to conventional non‐invasive measures of vascular stiffness in the detection of age‐dependent differences in the mechanical properties of the common carotid artery. Anna Bjällmark, Britta Lind, Michael Peolsson, Kambiz Shahgaldi, Lars‐Åke Brodin, Jacek Nowak. Submitted to European Journal of Echocardiography. IV. State diagrams of the heart ‐ a new approach to describing cardiac mechanics. Matilda Larsson, Anna Bjällmark, Jonas Johnson, Reidar Winter, Lars‐Åke Brodin, Stig Lundbäck. Cardiovascular Ultrasound. 2009;7:22.
iv
v
Division of work between authors
I. Bjällmark, Larsson and Brodin made the outline of the study. The image acquisition was performed by Bjällmark, Larsson, Balzano and Lind. Bjällmark and Larsson performed the software development and the analysis of the patient data. Bjällmark and Larsson wrote the manuscript, and Winter critically reviewed and contributed with his clinical experience to the preparation of the manuscript. Peolsson and Brodin supervised the study.
II. Bjällmark, Larsson, Lind, Hayashi, Seeberger and Brodin designed the study. Riella and Mazza do Nascimento organized the study setup. Bjällmark, Larsson and Brodin participated in the interpretation of the results and prepared the manuscript. Lind and Hayashi performed the ultrasound examinations and Bjällmark and Larsson performed the offline analysis. Bjällmark and Larsson wrote the manuscript, reviewed by Seeberger, Hayashi, Mazza do Nascimento, Brodin and Nowak.
III. Bjällmark and Nowak designed the study, participated in the interpretation of the results and prepared the manuscript. Shahgaldi and Lind performed the ultrasound examinations. Bjällmark and Shahgaldi analyzed the vascular and cardiac data respectively. Bjällmark and Lind performed the intra‐ and inter‐observer variability study and Peolsson performed the principal component analysis. Bjällmark wrote the manuscript, critically reviewed by Nowak. Brodin contributed to the interpretation of the data and reviewed the manuscript.
IV. Bjällmark, Larsson, Johnson, Lundbäck and Brodin participated in contributions to conception, analysis and interpretation of data. Software development and analysis of patient data was performed by Bjällmark and Larsson. Bjällmark and Larsson wrote the manuscript, critically reviewed by Johnson and Lundbäck. Winter was the supervisor of echo examinations and carefully reviewed the manuscript.
vii
Scientific contributions not included
Patent: Global and local detection of blood vessel elasticity (WO/2008/002257). Lars‐Åke Brodin, Håkan Elmqvist, Anna Bjällmark, Matilda Larsson. Scientific publications: I. Differences in myocardial velocities during supine and upright exercise stress echocardiography in healthy adults. Anna Bjällmark, Matilda Larsson, Kambiz Shahgaldi, Britta Lind, Reidar Winter, Lars‐Åke Brodin. Clinical Physiology and Functional Imaging. 2009;29(3):216‐23.II. Velocity tracking, a new and user independent method for detecting regional function of the left ventricle. Carl Westholm, Anna Bjällmark, Matilda Larsson, Per Jacobsen, Lars‐Åke Brodin, Reidar Winter. Clinical Physiology and Functional Imaging. 2009;29(1):24‐31. III. Fixation identification in centroid versus start‐point modes using eye‐tracking data. Torbjörn Falkmer, Joakim Dahlman, Tanja Dukic, Anna Bjällmark, Matilda Larsson. Perceptual and Motor Skills. 2008;106(3):710‐24. IV. Velocity tracking ‐ a novel method for quantitative analysis of longitudinal myocardial function. Anna Bjällmark, Matilda Larsson, Reidar Winter, Carl Westholm, Per Jacobsen, Britta Lind, Lars‐ Åke Brodin. Journal of the American Society of Echocardiography. 2007;20(7):847‐56. Conference abstracts: I. The prevalence of right ventricular dysfunction and the acute effect of HD on right ventricular function in CKD. Shirley Yumi Hayashi, Marcelo Mazza do Nascimento, Britta Lind, Miguel Riella, Matilda Larsson, Anna Bjällmark, Astrid Seeberger, Jacek Nowak, Bengt Lindholm, Lars‐Åke Brodin. International society of blood purification, Stockholm 2009.
viii II. The prevalence of intraventricular dyssynchrony, detected by tissue synchronization imaging, in hemodialysis, peritoneal dialysis and chronic kidney disease stages 3 and 4. Shirley Yumi Hayashi, Marcelo Mazza do Nascimento, Britta Lind, Miguel Riella, Matilda Larsson, Anna Bjällmark, Astrid Seeberger, Jacek Nowak, Bengt Lindholm, Lars‐Åke Brodin. American Society of Nephrology ‐ Renal week, San Diego 2009. III. Improvement of left ventricular synchronicity, assessed by tissue synchronization imaging, after a single hemodialysis session in chronic hemodialysis patients. Shirley Yumi Hayashi, Marcelo Mazza do Nascimento, Britta Lind, Miguel Riella, Matilda Larsson, Anna Bjällmark, Astrid Seeberger, Jacek Nowak, Bengt Lindholm, Lars‐Åke Brodin. American Society of Nephrology ‐ Renal week, San Diego 2009.
IV. Velocity tracking – a new user independent method for bedside detection of myocardial ischemia.
Carl Westholm, Matilda Larsson, Anna Bjällmark, Reidar Winter, Per Jacobsen, Lars‐Åke Brodin. EuroEcho, Lisbon 2007.
V. Color coded tissue Doppler is more accurate and less sensitive to filtering and gain settings compared to spectral tissue Doppler ‐ A comparison of two commonly used tissue doppler techniques in the clinical setting. Aristomenis Manouras, Anna Bjällmark, Reidar Winter, Lars‐Åke Brodin. EuroEcho, Lisbon 2007. VI. Wave Intensity Wall Analysis ‐ A novel noninvasive method for early detection of cardiovascular disease. Matilda Larsson, Anna Bjällmark, Britta Lind, Rita Balzano, Mikael Peolsson, Reidar Winter, Lars‐ Åke Brodin. EuroEcho, Lisbon 2007. VII. A new graphical user interface module generating state diagrams of the heart. Anna Bjällmark, Matilda Larsson, Stig Lundbäck, Jonas Johnsson, Reidar Winter, Lars‐Åke Brodin. EuroEcho, Prague 2006.
VIII. Bull’s eye presentation of speckle tracking data; a simple and user independent method for detection of regional myocardial ischemia. Per Jacobsen, Reidar Winter, Anna Bjällmark, Matilda Larsson, Magnus Nygren, Carl Westholm, Lars‐Åke Brodin. EuroEcho, Prague 2006. IX. To recognize faces and expressions ‐ what is the nature of the problem for people with Asperger Syndrome? Matilda Larsson, Anna Bjällmark, Marita Falkmer, Torbjörn Falkmer. Autism Safari, 2nd World Autism Congress & Exhibition, Cape Town 2006. X. Velocity Tracking ‐ a novel method for quantitative analysis of longitudinal myocardial function. Matilda Larsson, Anna Bjällmark, Reidar Winter, Carl Westholm, Per Jacobsen, Britta Lind, Lars‐ Åke Brodin. World Congress of Biomechanics, Munich 2006.
ix
Abbreviations
2D Two‐dimensional 3D Three‐dimensional A’ Late diastolic wave AV Atrioventricular BP Blood pressure CCA Common carotid artery DDP Dynamic displacement pump DISP Displacement E’ Early diastolic wave ECG Electrocardiogram Ep Elastic modulus ESRD End stage renal disease FR Frame rate HD Hemodialysis IMT Intima media thickness IVCT Isovolumic contraction time IVCV Isovolumic contraction velocity IVRT Isovolumic relaxation time IVRV Isovolumic relaxation velocity LV Left ventricle LVEF Left ventricular ejection‐fraction NA Negative area NSTEMI Non ST‐elevation myocardial infarction PCA Principal component analysis PSV Peak systolic velocity PWV Pulse wave velocity ROI Region of interest RV Right ventricle TVI Tissue velocity imaging W1 Wave intensity forward compression wave W2 Wave intensity forward decompression wave WI Wave intensity WIWA Wave intensity wall analysisx
xi
Acknowledgements
The work presented in this thesis has been performed at the Division of Medical Engineering, School of Technology and Health, KTH (Royal Institute of Technology). The work has been performed in cooperation with the Department of Clinical Physiology, Karolinska University Hospital, the Division of Baxter Novum and Renal Medicine, Department of Clinical Science, Intervention and Technology, Karolinska Institute and Evangelical Medical School, Curitiba, Brazil.First of all I would like to thank Matilda Larsson, with whom I worked closely during these years. Thank you for being the most excellent co‐worker, and also for being the sweetest friend and a terrific travelling partner. Many thanks also to my supervisor Lars‐Åke Brodin for all your ideas, enthusiasm and for believing in every project.
I would further like to express my gratitude to Jacek Nowak for valuable input, interesting discussions and for carefully reviewing my writing, Reidar Winter for teaching me cardiology and scientific writing, to Britta Lind for helping with the image acquisition and for answering my millions of questions about clinical ultrasound, to Shirley Yumi Hayashi and Marcelo Mazza do Nascimento for taking such good care of us when working in Brazil, to Aristomenis Manouras and Kambiz Shahgaldi for always smiling and for helping out with the image acquisition even at very short notice, to “the Professor” and “the Docent” for statistical advices and for introducing me to the lovely world of Knob Creek, to Gunilla Langvall, Monika Armuand and Karl‐Erik Jönsson for providing the best support for the employees, to Staffan Larsson for great help with Photoshop and my aching shoulder, to Michael Peolsson for pleasant research meetings with scones and tea in the city centre, and to Peta Sjölander for correcting the English. Many thanks to Stig Lundbäck and Jonas Johnson for teaching me about the dynamic displacement pump, and also for the many laughs during the long discussions about the deltaV‐function.
I would like to thank my dear colleagues in the Imaging Group (Dennis, Frida, Nina and Mattias) and the Neuronics Group (Maria, Mats, Johnson, Sofia, Axel, Elin, Rickard, Daniel, Xiaogai, Madelen, Kim, Tobias, Svein and Peter) for creating a friendly and inspiring atmosphere, making the working days a pleasure. A special thanks to my friends for always being supportive and for enriching my life with late nights at Karlssons bar in Jönköping or at Harrys in Falkenberg, fika at Åbacka Café, Graz 2003/2004‐trips, long telephone conversations, fantastic time on and around the basketball court (which has since changed to more relaxed environment in the sand) and for interesting discussions about everything
xii
and nothing. Many thanks also to Britt‐Marie for being the loveliest aunt. Finally, the greatest thanks to my parents Peter and Eva, and to my brothers Per and Anders and their families for love, encouragement and for giving me the best support.
xiii
Table of contents
Summary ...i List of publications ...iii Division of work between authors...v Scientific contributions not included ...vii Abbreviations ...ix Acknowledgements...xi Introduction ... 1 1.1. The heart... 1 1.2. The cardiovascular system... 3 1.2.1. The movement of the artery... 4 1.3. Methods for evaluation of cardiac function ... 5 1.3.1. Tissue velocity imaging (TVI)... 5 1.3.2. Speckle tracking ... 7 1.4. Methods for evaluation of vascular function ... 8 1.4.1. Arterial stiffness ... 8 1.4.2. Assessment of subclinical atherosclerosis... 9 1.4.3. Wave intensity analysis... 10 Aims... 13 Methods and materials... 15 3.1. Wave intensity wall analysis ... 15 3.2. Two‐dimensional strain imaging in the common carotid artery ... 17 3.3. State diagram... 17 3.4. Studied populations ... 19 3.5. Vascular imaging ... 20
xiv
3.5.1. Ultrasonographic equipment and image acquisition ... 20
3.5.2. Wave intensity variables (Studies 1 and 2)... 21
3.5.3. Short‐axis speckle tracking variables and established measures of arterial stiffness (Study 3)... 21 3.6. Echocardiography ... 22 3.6.1. Echocardiography equipment and image acquisition ... 22 3.6.2. Tissue Doppler variables (Studies 2‐4)... 23 3.7. Statistical analysis ... 23 3.8. Summary of the methodology for each study ... 24 Results... 27 Discussion... 31 5.1. Wave intensity wall analysis ... 31 5.2. Two‐dimensional strain imaging... 33 5.3. Limitations of arterial measurements ... 34 5.4. State diagram... 35 Conclusions ... 39 References ... 41
‐ 1 ‐
Introduction
Atherosclerotic cardiovascular disease has become the leading cause of death worldwide [1]. In view of the rapid increase in incidence and prevalence of this disease, its human and economic impact can be expected to become even more significant. One way to minimize the mortality and the morbidity of cardiovascular disease is to increase the awareness of the population about important risk factors such as tobacco [2] and obesity [3]. However, a significant number of cardiovascular events occur in individuals without any presence of risk factors [4]. Therefore, the development of accurate, non‐invasive methods for early diagnosis and treatment is of considerable clinical interest.
Ultrasound is a well‐established technique for imaging of the cardiac and vascular system. Its non‐ invasiveness, high temporal and spatial resolution and mobility make the technique very useful in the daily clinical practice. Ultrasound in cardiac imaging was applied for the first time in 1953 by Edler and Hertz [5], who showed that anatomy and motions of the heart were detectable using a pulse‐echo system. Since then, a remarkable development of clinical ultrasound has taken place and today it is possible to obtain detailed anatomic images in 3D and parametric images showing myocardial tissue movements and deformation. Tissue velocity imaging (TVI) and speckle tracking are two relatively new ultrasound‐based techniques, primarily used for quantification of myocardial function.
1.1. The heart
The human heart is approximately the size of a fist and is located in the frontal part of the chest behind the sternum. In a normal person, the heart weighs between 250g and 300g. The heart is divided into four cardiac chambers, the left and right atrium and the left and right ventricle. The left ventricle pumps the oxygenated blood through the aortic valve into the systemic circulation to supply all the organs of the body with blood. When ejected from the heart, the blood flows into the aorta and is directed further into the arteries. The blood returns from the periphery via the low pressure venous system to the right atrium. The blood is moved forward through the tricuspid valve to the right ventricle and is then pumped through the pulmonary valve into the pulmonary arteries to be oxygenized in the lungs. Back from the lungs, the oxygenated blood re‐enters the heart through the left atrium. Through the mitral valve, the blood reaches the left ventricle and the pump cycle continues. Figure 1 illustrates the anatomy of the heart.‐ 2 ‐ Figure 1. The anatomy of the heart [6].
The right ventricle of the heart only needs to generate the pressure required to pump the blood through the lungs. The left ventricle on the other hand is required to generate enough pressure to pump the blood to every other part of the body. This is why the left ventricle has more cardiac muscle tissue (myocardium) in its walls. The left ventricle has an approximately parabolic shape and its walls are referred to as the anteroseptal, the anterior, the lateral (antero‐lateral), the posterior (infero‐lateral), the inferior, and the septal (infero‐septal) walls. The part of the ventricle that is located closest to the atrium is known as the base of the ventricle. The lowest end of the heart is called the apex. The ventricular wall itself consists of three layers, the epicardium (external), the myocardium (middle) and the endocardium (internal). The myocardium is the cardiac muscle tissue, responsible for the pumping function of the heart, while the other two layers serve as slippery and smooth connecting tissue to the surroundings. The myocardial fibres have a helical arrangement with subepicardial fibres directed in an anti‐clockwise spiral and subendocardial fibres in a clockwise spiral from apex to base. The subepicardial fibres are predominately longitudinally oriented, transitioning to a horizontal fibre direction in the midwall, and becoming again longitudinally oriented in the subendocardial region although in the opposite direction from the subepicardial fibres. Because of the geometry of the muscle fibres the lengthening and shortening of the myocardium result in rotational movements [7, 8]. The pumping and regulating function of the heart has been differently described over the years [9‐ 13]. In 1986, Lundbäck refined a model of cardiac mechanics [12] described already by Leonardo da Vinci [14] implying that the heart pumps with forward and backward movements in the longitudinal direction of a piston‐like unit, referred to as the AV‐piston or the spherical AV‐plane. When the AV‐ plane is drawn towards the apex of the heart, forcing the blood in the ventricles into the pulmonary and systemic circulation, this will at the same time create an inflow to the atria and its auricles. During the cardiac cycle, the outer contours of the heart are more or less unchanged, which is energy‐saving as there is no need for moving surrounding tissue. The regulating function is mostly performed by the forward and backward movements of the inter‐ventricular septum. This movement is determined by the pressure differences between the left and right ventricles [12].
‐ 3 ‐
The pumping function of the heart is electrically activated. The electrical activation starts in the sinus node located in the right atrium, and spreads in the atria. The impulse also reaches the atrioventricular (AV) node located in the septum between the atria. The cells of the AV node slow down the conduction before the impulse is transmitted to the ventricles giving the atria time to finish their contraction. The impulse passes along the bundle of His and through conduction system fascicles terminating in a set of branching Purkinje fibres which penetrate into the myocardium. These fibres allow for an almost instantaneous transmission of the cardiac impulse throughout the ventricular muscle tissue resulting in a more or less synchronous depolarization of the myocardium and subsequent contraction of the ventricle. The cardiac cycle is traditionally divided into a systolic phase and a diastolic phase. During systole, blood is ejected from the ventricles into the pulmonary and systemic circulation and during diastole the ventricles are refilled with blood. The systolic phase can be further subdivided into isovolumic contraction and ejection, whereas the diastolic phase can be subdivided into isovolumic relaxation, early diastolic filling, diastase and late diastolic filling (atrial contraction). Preload, afterload and contractility determine cardiac performance. Preload can be defined as the initial stretching of the myocardium prior to contraction. A greater preload on the cardiac muscle increases its force of contraction. According to the Frank‐Starling law, the more the heart fills with blood during diastole (within limits), the stronger is the power of the ventricular work during systole. For a healthy heart, preload may be defined as the ventricular end‐diastolic volume, since increased volume stretches the myocardium [15]. Afterload is the force that the ventricle must overcome, in order to eject the blood into the aorta. If the afterload is increased, then the heart has to generate higher intra‐ventricular pressure to be able to open the aortic valve and to maintain the blood flow during ventricular ejection [16]. Contractility is the intrinsic ability of the myocardium to contract, independent of changes in preload, afterload and heart rate. Increased contractility is associated with increased velocity of the myocardial fibre shortening and a steeper pressure rise when preload, afterload and heart rate are constant [17].
1.2. The cardiovascular system
The systemic circulation supplies the organs of the body with oxygenated blood and nutrients. The systemic circulation is composed of distribution vessels (arteries) with elastic properties and low resistance to blood flow, resistance vessels (arterioles) with less elasticity and high resistance, exchange vessels (capillary bed) and capacitance vessels (veins and venules) with high distensibility. The distribution vessels convert the pulsating flow generated by the heart into a more continuous flow. The resistance vessels regulate the blood pressure and distribute the blood flow to the organs, while the exchange of gases and metabolites takes place in the exchange vessels. The capacitance vessels contain about two thirds of the total blood volume, and have the ability to constrict, thus increasing the inflow to the heart. The blood vessels, with the exception of the exchange vessels, consist of three layers. The most inner layer is the tunica intima, followed by tunica media and the tunica adventitia. Tunica media constitutes the smooth muscle layer of the vessel wall and has the ability to contract and relax resulting in vascular constriction or dilation.
‐ 4 ‐ The blood flow is regulated according to the following equation: R P Q=Δ , Q = blood flow, ∆P= difference in pressure, R = peripheral resistance. The peripheral resistance is calculated from: 4 r l R= η× , η = viscosity of blood, l = length of lumen segment, r = lumen radius.
1.2.1. The movement of the artery
The longitudinal direction of the artery is defined as the direction of the mean blood flow and the radial direction is orthogonal to the longitudinal direction. Most methods used for characterization of artery properties are based upon measurements in the radial direction and relate to simultaneous assessment of diameter and pressure waveforms. The diameter and pressure waveforms can be obtained using invasive measurements, but such measurements have limited clinical usage. Non‐invasively, the diameter waveform can be accurately obtained using ultrasound [18]. However, the instantaneous measurement of the pressure waveform suffers from accuracy problems. Several methods for non‐invasive assessment of the pressure waveform have been developed. The pressure wave form can be obtained from the arterial diameter wave form by using an exponential relationship between the arterial cross‐section and the pressure [19]. It has also been claimed that the arterial diameter waveform is similar to the pressure waveform and a direct transformation between the two could be made with calibration of the peak and bottom values against systolic and diastolic blood pressure [20]. Radial forces induce a circumferential tension in the arterial wall. The circumferential movement is further dependent on the radius and on the thickness of the wall. Figure 2 illustrates how the different directions are defined in ultrasound images of the artery. Figure 2. Definition of radial, longitudinal and circumferential direction in the long‐axis (left) and short‐axis views (right) of the common carotid artery. Compared with radial function, the longitudinal movement of the artery has gained little attention hitherto. The general belief has been that the longitudinal movement of the aortic wall is negligible and mainly due to respiratory movements of the diaphragm [21]. Limitations of imaging techniques with too low temporal and spatial resolution were probably one of the reasons for this belief. With the use of different speckle tracking techniques, a distinct longitudinal movement of the inner layer
‐ 5 ‐
of the arterial wall has been observed during the heart cycle [22, 23]. The longitudinal movement has been shown to correlate with the blood flow next to the wall [24] and has approximately the same magnitude as the radial movement [25]. There is also a shear strain in the arterial wall occurring due to the larger movements of the intima‐media compared with those of the adventitia [26].
When considering movements of the artery, it should be kept in mind that arteries are not homogenous, cylindrical tubes and the mechanical behaviour can vary in different parts of the artery.
1.3. Methods for evaluation of cardiac function
Within ultrasound imaging, tissue velocity imaging (TVI) and speckle tracking are the most recent developments with the ability to quantify myocardial motion and deformation patterns in the myocardium.
1.3.1. Tissue velocity imaging (TVI)
The Doppler principle states that if an object moves away from a sound source, the reflected frequency will be lower than the transmitted frequency. Conversely, if the object is moving towards the sound source the reflected frequency will be higher than the transmitted frequency. The difference in frequency is known as the Doppler shift and is used in clinical ultrasound for estimating the velocity of moving tissue or blood cells. The Doppler equation has the following formula: f c ) cos( v 2 f = α Δ
where ∆f is the Doppler shift, f is frequency of the transmitted ultrasound (1‐15MHz), v is the velocity of the moving object, α is the angle between the moving object and the ultrasound beam and c is the speed of sound.
Both tissue and blood are moving in the heart, and motion of the highly reflective slow‐moving myocardium is differentiated from low reflective blood moving with high velocity by application of amplitude and frequency filters. Thus, the Doppler technique facilitates a quantitative assessment of wall motion and velocities from an ultrasound investigation. The first attempt to assess wall motion dynamics was performed in 1989 using pulsed Doppler acquisition at a single measurement site [27], and further development resulted in two‐dimensional imaging of myocardial velocities presented as colour‐coded maps [28]. The development continued with the introduction of the TVI‐ technique [29, 30], which allowed for extraction of velocity profiles in multiple selectable positions in the heart muscle. The TVI‐derived velocity information could be extracted with high temporal resolution (> 200 Hz), which was achieved by using a limited number of scan lines (8‐16 scan lines).
The velocity curve is the cornerstone for all further analysis and post‐processing. Displacement is obtained by integration of the velocity curve. By relating myocardial velocities in two different locations to the distance between them, a curve reflecting the velocity of myocardial deformation (strain rate) is generated. When integrating the strain rate curve, information describing the
‐ 6 ‐
magnitude of myocardial deformation (strain) is obtained. All these variables can be colour‐coded and overlaid on 2D and 3D images (Figure 3), or presented as a function of time from specified regions in the images.
Figure 3. TVI images with different colour maps. From left: velocity (cm/s), displacement
(mm), strain (%), strain rate (1/s).
The advantage of TVI compared with conventional echocardiography is the possibility to quantify cardiac function by providing detailed regional information about myocardial velocity, displacement and strain pattern. The TVI concept has been used for evaluation of cardiac function and reported in a large number of publications, where quantitative stress‐echocardiography was one of the first clinically useful applications [31]. Amplitude values of different peaks in tissue Doppler curves have been studied in various patient populations and reference values have been established [31‐34].
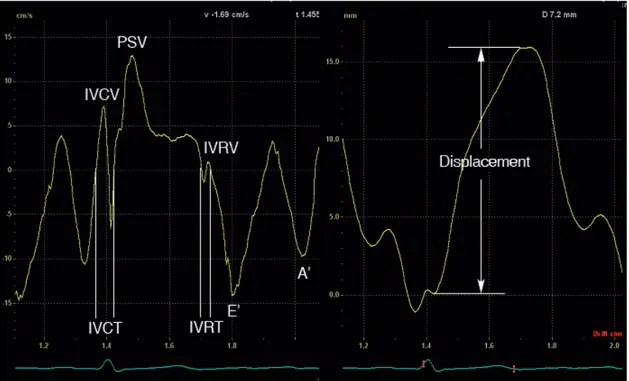
The clinically most useful information in a myocardial velocity curve is the peak systolic velocity (PSV) and the two diastolic velocities, the first (E’) occuring during early diastolic filling and the second (A’) during atrial contraction. Beside the main systolic and diastolic events, there are rapid movements of short duration associated with the pre‐ and postsystolic reshaping of the ventricles that occurs during the transition between filling and ejection of the ventricles. The isovolumic contraction velocity (IVCV) is the maximal velocity during the isovolumic contraction period and the isovolumic relaxation velocity (IVRV) is the maximal velocity during the isovolumic relaxation period. In the clinical routine, ventricular displacement is most often used for evaluation of the atrioventricular plane (AV‐plane) movement during ventricular ejection. Movements that occur during the isovolumic contraction and isovolumic relaxation periods are subsequently excluded. From the myocardial velocity curve or displacement curve, different time intervals can be defined. Two commonly used time intervals are the isovolumic contraction time (IVCT) and the isovolumic relaxation time (IVRT). Prolongation of these time intervals is associated with cardiac dysfunction [35‐37]. Figure 4 illustrates commonly measured tissue velocity and displacement variables and isovolumic time intervals obtained in the tissue velocity curve.
‐ 7 ‐
Figure 4. Typical tissue velocity echocardiographically derived velocity and displacement
profiles from the basal lateral wall during one cardiac cycle. IVCT = isovolumic contraction time, IVCV = isovolumic contraction velocity, PSV = peak systolic velocity, IVRT = isovolumic relaxation time, IVRV = isovolumic relaxation velocity, E’ = maximal tissue velocity during early diastolic filling, A’ = maximal tissue velocity during atrial contraction.
TVI‐derived strain and strain rate have been shown to be useful in the detection of cardiac dysfunction. However, these variables will not be considered in this thesis.
1.3.2. Speckle tracking
The most recent development in ultrasonographic imaging is called speckle tracking. Every ultrasound image has a characteristic black and white speckle pattern, which is the basis for this new diagnostic approach. The pattern is a result of interference occurring from the reflected ultrasound. Constructive interference (waves in phase) is seen as white spots, while destructive interference (waves out of phase) is seen as black spots. The speckle pattern is relatively stable over the cardiac cycle and the randomness of the speckle pattern ensures that each region of the myocardium has a unique speckle pattern, which can be used to differentiate one region from another (Figure 5).
‐ 8 ‐ Figure 5. Grey‐scale image of the left ventricle. The two enlarged areas from different parts of the ventricle each show unique speckle patterns, which can be tracked from frame to frame [38]. By comparing amplitude patterns of speckles in a small region (kernel) with the most similar speckle pattern within a search region in the succeeding frame, motion and deformation of the myocardial wall can be obtained in two directions without any angle dependency. Due to rotation, torsion and deformation, the speckle pattern is not perfectly repeated. This requires a high frame rate to capture small frame‐to‐frame changes. However, line density needs to be maintained in order to have a good spatial resolution and therefore the frame rate obtained with speckle tracking is lower compared with TVI acquisitions.
Several speckle tracking algorithms have been developed and a number of validation studies have been performed [39‐44]. The technique has successfully been applied in different cardiac applications [43, 45, 46] and has been shown to be particularly useful in the assessment of regional short axis rotation patterns [47‐49]. A commercially available technique is the 2D‐strain software package from GE Vingmed (GE Healthcare, Horten, Norway) [39, 50].
1.4. Methods for evaluation of vascular function
There are several methods available for the assessment of vascular function. The aim of all these methods is to quantify the degree of arterial stiffness in the systemic circulation.1.4.1. Arterial stiffness
Arterial stiffness is one of the most important determinants of increased blood and pulse pressure (systolic blood pressure‐diastolic blood pressure) and thus the cause of cardiovascular events, including myocardial infarction and left ventricular hyperthrophy [51‐53]. Arterial stiffness influences the ability to accommodate the blood ejected from the heart. During systole, the blood pressure rises and the diameter of the arteries increases which, during diastole, decreases again. The blood volume stored during systole is released during diastole, creating a continuous flow‐ 9 ‐ towards the periphery of the vascular system. The ability of the arteries to distend in response to a given pressure is given by the compliance (C): ΔP ΔV C = , ∆V = change in volume, ∆P = change in pressure The elastic properties of the arteries have a large impact on the blood pressure and the afterload, where increased stiffness causes a reduction in distensibility and thereby elevates the systolic blood pressure and the pulse pressure, and increases the mechanical load on the heart. Additionally, arterial stiffening increases the speed of the pulse travelling along the arteries and consequently the return of the wave reflections from the peripheral parts of the vascular system occurs prematurely. The premature return causes changes in the pressure wave contours and may further disturb ventricular ejection and coronary perfusion.
Ageing is accompanied by changes in arterial structure and function. Several studies, using various assessment techniques, have verified an age‐dependent increase of arterial stiffness in proximal, elastic arteries [54‐56]. The increase in arterial stiffness is considered to be largely a result of progressive degeneration of elastin fibres in the arterial media layer [57]. The same factors that underlie age‐associated structural and functional changes in the arteries have shown to be present in the pathogenesis of cardiovascular disease [58] and, interestingly, several studies published in recent years have shown that decreased elasticity of the arterial wall may be present even before the appearance of any clinical symptoms or atherosclerotic plaques [59‐61].
1.4.2. Assessment of subclinical atherosclerosis
There are several techniques available for the detection of subclinical changes of the mechanical properties of the artery. As mentioned earlier, non‐invasive methods are mainly based upon pulse transit time, analysis of arterial pressure pulse and its wave form or stiffness estimation from distending pressure and diameter measurements. Pulse wave velocity (PWV) [62] is a measure of the speed of which the pulse pressure wave travels along the arteries. The pulse pressure wave travels faster in proportion to the stiffness of the artery. Measurements of PWV can be done by measuring the pressure at two locations in the arterial system. By relating the delay between the two wave forms to the measured distance, a value of PWV is obtained. Intima media thickness (IMT) is defined as the distance between the lumen‐media interface and the media‐adventitia interface [63], and increased IMT is considered to be a valuable marker of early atherosclerosis. However, IMT is influenced by sex, age and race, which makes cut‐off values difficult to define. Local measurements of arterial stiffness can be expressed as distensibility, compliance, elastic modulus (Ep) or β stiffness index and are based upon measurements of radial movements. Even
though these measurements are widely used, the validity and reproducibility procedures of the measurements show large differences, and there is, in fact, no golden standard for evaluating arterial stiffness locally [64, 65]. Much of the recent research has focused on development of methods to quantify deviations from normality, but there is still no method free of limitations available today.
‐ 10 ‐
1.4.3. Wave intensity analysis
Wave intensity analysis was introduced as an alternative method in the study of cardiovascular dynamics [66]. Ventricular ejection generates a wave that propagates throughout the circulation. The characteristics of the wave are highly dependent on the performance of the ventricle, but also of the mechanical properties of the arteries as it travels distally. Wave intensity (WI) is defined as the product of blood pressure (dP) and mean blood velocity (dU) changes (WI = dP * dU). It is a measure of the energy flux per area unit [W/m2] transported by the waves and provides information about the ventricular mechanical performance and ventricular‐arterial interaction [66]. A positive value of the wave intensity indicates that the waves travelling towards the periphery of the vascular bed are dominant, while a negative value of the wave intensity indicates that the waves originated from the peripheral site are dominant. One advantage of wave intensity analysis compared with traditional Fourier analysis, is that no assumptions of linearity or periodicity are made. Further, the results are easy to relate to particular events in the cardiac cycle since all calculations are performed in the time domain.
Originally, the concept demanded invasive measurement of blood pressure and velocity but further development resulted in an ultrasound based non‐invasive wave intensity system (the Aloka system) [67]. The pressure waveform was obtained by measuring the diameter changes of the artery using an echo‐tracking technique. The maximal and minimal values of the diameter wave form were then calibrated by systolic and diastolic blood pressure measured with a cuff‐type manometer applied to the upper arm. The velocity component was obtained from Doppler measurements, and was corrected for the angle between the ultrasound beam and the flow velocity vector. The new non‐invasive wave intensity system used a time‐normalized wave intensity value (WI = dP/dt *dU/dt), which allowed data acquired at different sampling rates to be compared directly, but resulted in a complex unit [W/s2m2]. The wave intensity curve In the wave intensity curve, two distinct positive peaks are detectable. The first peak (W1) occurs in early systole as a result of ventricular contraction. It is a forward compression wave with positive pressure and velocity changes. Forward in this context means that the wave propagates in the direction of the mean blood flow, i.e., it is generated from the proximal site. The second positive peak occurs in late systole as a result of the deceleration of the ventricular contraction. This is a forward travelling decompression wave with negative pressure and velocity changes. The magnitude of W1 has been shown to correlate with the maximal LV pressure rise (dP/dtmax) and to
increase with cardiac contractility [68, 69], while the magnitude of W2 correlates with the LV
pressure decay (dP/dtmin) and with the time constant τ of LV pressure decay during isovolumic
relaxation [68, 70]. There are also other peaks visible in the wave intensity curve. However, they are highly dependent on measuring position and clinical diagnosis [71]. One peak often mentioned in the literature is the so called negative area (NA), defined as the integrated wave intensity curve (when it goes below zero) between W1 and W2. NA has been proposed to represent a reflected
wave coming from the periphery [72]. Figure 6 shows an example of a wave intensity curve.
‐ 11 ‐
Figure 6. An example of a wave intensity
curve. The first positive peak corresponds to W1 and the second positive peak to W2. NA is the integrated wave intensity curve (when it goes below zero) between W1 and W2 (the yellow area).
The input variables in wave intensity calculations, the pressure and velocity changes, are closely related and a change in pressure must be accompanied by a change in velocity. The water hammer equations explain the relationship between the pressure changes (dP) and the velocity changes (dU): For forward travelling (+) waves originating from the proximal site dP+ = ρcdU+, c = local wave speed, ρ = density of the blood and for backward travelling (‐) waves originating from the distal site − − = ρcdU− dP
The wave intensity curve shows the sum of forward and backward travelling waves. Their relationship is displayed in Table 1.
Table 1. Relationship between forward and backward travelling waves.
WI dP dU
Forward travelling waves > 0 positive > 0 compression > 0 acceleration
< 0 decompression < 0 deceleration
Backward travelling waves < 0 negative > 0 compression < 0 deceleration
< 0 decompression > 0 acceleration
Separation of the wave intensity curve into forward and backward travelling waves can be useful in cases when forward and backward waves have approximately the same magnitude resulting in zero net wave intensity or when the arrival time of waves are important. The local wave speed c is required in order to separate forward and backward waves in the arteries. Several ways to determine the local wave speed have been reported in the literature [73‐75]. However, the importance of separating the wave intensity into forward and backward components is debatable.
‐ 12 ‐
During the time period when W1 and W2 occur, the backward components are practically zero. On
the other hand, the local wave speed c is inversely related to the local distensibility and has therefore a direct clinical value. Stiffer arteries have lower distensibility and higher wave speed.
Clinical applications of wave intensity
Today, wave intensity analysis has a limited usage in the daily clinical practice. The method is primarily used in different research areas, in order to better understand normal physiology and pathology. Wave intensity has partly contributed to a better understanding of ventricular relaxation by enabling the analysis of how the pressure and velocity waves change in end‐systole [66, 70, 76]. When the mechanisms behind these waves were studied, it was concluded that a well‐functioning heart has the ability to maintain aortic flow in end‐systole, causing a rapid decrease of left ventricular pressure before the start of isovolumic relaxation, which enhances the cardiac function [70]. Further, the aortic and microcirculatoric effects on coronary hemodynamics have been investigated using wave intensity [77]. The latest contribution to the wave intensity research area is the reservoir‐wave approach [78], which should add incremental value to the quantification of forward and backward travelling waves. By separating the pressure component into changes caused purely by waves and changes caused by the compliant structure of the artery, it has been shown that the wave intensity analysis yields different results when the volume‐related changes have been accounted for [78].
Wave intensity has also been applied in patients with various cardiovascular diseases. Dilated cardiomyopathy demonstrates a pronounced impaired systolic function and W1 has been shown to
be decreased in this patient group compared with matched controls. Hypertrophic cardiomyopathy is, on the other hand, primarily detectable when evaluating diastolic function and the values of W2
have been shown to be decreased in patients suffering from hypertrophic cardiomyopathy [69]. Hypertensive patients (systolic pressure > 135 mmHg or diastolic pressure > 85mmHg) showed no significant differences in W1 or W2 compared with normal subjects, however, NA was increased in
the hypertension group [69]. The magnitudes of W1 and W2 have been shown to be reduced by
decreased preload [79]. This was not verified when the hemodynamic effects of nitroglycerin were studied and it was concluded that changes in W1 were not caused by preload changes [80].
Clinical manifestations of cardiac disease are frequently present in patients with end stage renal disease (ESRD), and cardiovascular disease is the leading cause of mortality in this patient group [81]. The wave intensity concept has never been applied in this patient group, but would potentially increase the understanding of ventricular‐arterial interaction and cardiovascular dynamics in a patient group with high mortality in cardiovascular disease.
‐ 13 ‐
Aims
Ultrasound imaging is today the cornerstone in the routine evaluation of cardiovascular function. TVI and speckle tracking have the ability to quantify cardiovascular function with high reproducibility [82, 83] and have positively contributed to the interpretation of ultrasound data, especially for non‐experienced sonographers [84]. Even though there are several techniques available for the evaluation of cardiovascular function, there is still much to be done within this field in order to make early detection of cardiovascular dysfunction easier, faster and more reliable. The general aim of this thesis was therefore to develop and validate new approaches to monitoring cardiac and vascular function based on TVI and speckle tracking. In more detail, the specific aims were:
To test whether speckle tracking‐derived strain data obtained in the vascular wall could be used as input for wave intensity calculations.
To evaluate the changes in cardiovascular function induced by a single session of hemodialysis (HD) in patients with end stage renal disease, with its documented high mortality in cardiovascular disease, by a combined approach employing speckle tracking‐derived wave intensity and TVI measurements.
To apply speckle tracking‐derived vascular two‐dimensional strain measurements to the evaluation of vascular elasticity. To compare the capacity of speckle tracking‐derived two‐dimensional strain measurements in the detection of age‐dependent differences in vascular elasticity with that of conventionally used elasticity variables. To find a new approach to describe the timing of global and regional mechanical myocardial events during the cardiac cycle, and to test the capacity of the resulting state diagrams of the heart to discriminate between healthy and diseased subjects.
‐ 14 ‐
‐ 15 ‐
Methods and materials
This thesis is based upon three new non‐invasive approaches to cardiac and vascular monitoring, wave intensity wall analysis (WIWA), two‐dimensional strain imaging in the common carotid artery and the state diagram of the heart. Their clinical usefulness has been tested in different patient groups. This chapter starts with an introduction of the approaches used, followed by the methodology which has been common for all investigations in this thesis.3.1. Wave intensity wall analysis
The new wave intensity concept, WIWA, is a modification of the original invasive wave intensity analysis method [66] and the further developed non‐invasive ultrasound based wave intensity system [67]. The novelty of WIWA is that the measurements of the input variables to the wave intensity calculations are obtained in the vascular wall using a speckle tracking‐based ultrasound system. Within wave intensity analysis, arterial waves are defined as sequential infinitesimal changes of blood pressure and velocity. WIWA approximates these changes by measurements of strain rate in the radial and the longitudinal direction; the pressure component (dP/dt) is approximated by strain rate in the radial direction and the flow velocity changes (dU/dt) by strain rate in the longitudinal direction. Positive strain corresponds to lengthening or stretching, and negative strain to shortening or compression relative to the original length. Thus, the radial component is sign‐reversed in the WIWA calculations. Wave intensity measured in the arterial wall is defined as: al longitudin radial
WIWA strainrate strainrate
WI =− ×
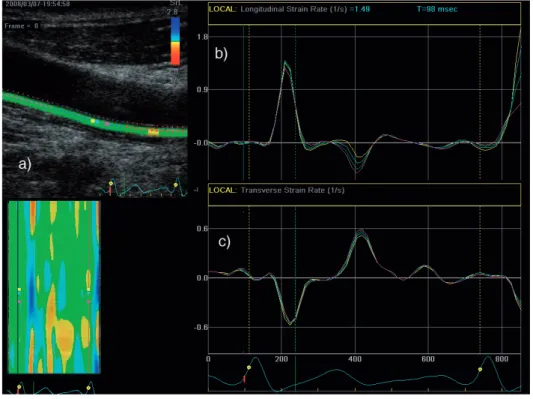
Figure 7 shows the ROI placed in the far wall of the common carotid artery (CCA) and the input variables, longitudinal and radial strain rate, to the WIWA system.
‐ 16 ‐ Figure 7. Measurements of the input variables to WIWA. a) An ROI placed in the far wall of the artery. The ROI was placed to cover the whole wall to obtain better tracking. However, the “true” ROI consists of a considerably smaller area, i.e. the four coloured dots (yellow, blue, green, pink) seen in the middle of the image of the artery. b) Longitudinal strain rate. c) Radial strain rate (not sign‐reversed).
As in other wave intensity measurements, the result of the WIWA is presented as a curve containing the two positive peaks, W1 and W2, and, in some patients, a small NA. Figure 8 illustrates
an example of a wave intensity curve generated using WIWA.
Figure 8. Wave intensity curve from WIWA. W1 is the first peak occurring in early systole and W2 is the second peak occurring in late systole. NA is not visible in this example.
‐ 17 ‐
3.2. Two‐dimensional strain imaging in the common carotid artery
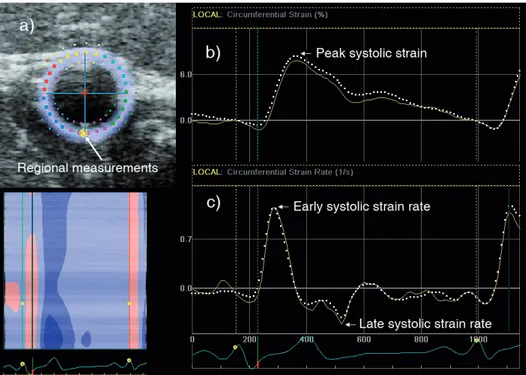
Two‐dimensional strain imaging in the common carotid artery has a close relationship with WIWA by also using speckle tracking for quantification of cardiovascular function. The idea is to create a tool for the characterization of arterial stiffness with high accuracy, which can be easily applied in the clinical setting. From short‐axis images of the CCA, strain variables are extracted as surrogate variables of pressure (diameter) waveforms. The strain variables (strain and strain rate) can be assessed in radial or circumferential direction, both globally and regionally. Figure 9 illustrates circumferential strain and strain rate curves, where the dotted line corresponds to global values (mean of whole circular ROI) and the yellow line to the yellow dot placed in the far wall of the CCA. Figure 9. a) ROI corresponding to the cross‐sectional area of the CCA short‐axis image. The large, yellow dot in the far wall corresponds to the position of the regional measurements. b‐c) Typical circumferential strain and strain rate curves from CCA. Global measurements are represented by white, dotted curves, whereas regional measurements by yellow curves.3.3. State diagram
The state diagram of the heart has been proposed as a new visualization tool for cardiac time intervals. The basic idea is to present comparative data of systolic and diastolic performance giving a more complete overview of the timing of cardiac events. The state diagram is generated from time intervals identified in tissue velocity curves at six positions in the left ventricle and one position in the right ventricle. ROIs are placed at basal segments in apical images of the heart, in order to represent the longitudinal movements of the AV‐plane. From each tissue velocity, regional information can be extracted and by calculating mean time intervals for the left and right ventricles, a fairly good indication of the global cardiac function is obtained.
The cardiac cycle is divided into six main phases: Pre‐Ejection, Ventricular Ejection, Post‐Ejection, Rapid Filling, Slow Filling and Atrial Contraction. Ventricular Ejection is subdivided into an early, a
‐ 18 ‐ mid and a late phase whereas Atrial Contraction and Rapid Filling are subdivided into two phases: an early phase and a late phase. Figure 10 displays the division of phases in the typical myocardial velocity curve. Figure 10. Definition of cardiac phases in the myocardial velocity curve.
The visual interpretation of the state diagram (Figure 11) can be rather complicated for an untrained eye, and should not be confused with the bull’s eye plot, which in contrast provides a two‐dimensional map of the entire surface of the left ventricle. One heartbeat corresponds to all 360° in the state diagram, starting with Pre‐Ejection and ending with Atrial Contraction. The outermost circular segment in the state diagram corresponds to the antero‐septal wall, followed by the anterior, the antero‐lateral, the infero‐lateral, the inferior, the infero‐septum (LV) and the medial (RV) walls. The aim of the colour coding is to clearly visualize when one state of the heart’s cycle goes into the next one. If there is any time delay between the walls, the phases are shifted clockwise or anti‐clockwise in the state diagram, relative to the antero‐septal wall. The calculation of the time shift between the walls is derived from the time between the R‐wave in the ECG‐curve and the start of Pre‐Ejection.
‐ 19 ‐ Figure 11. Visual interpretation of the state diagram.
3.4. Studied populations
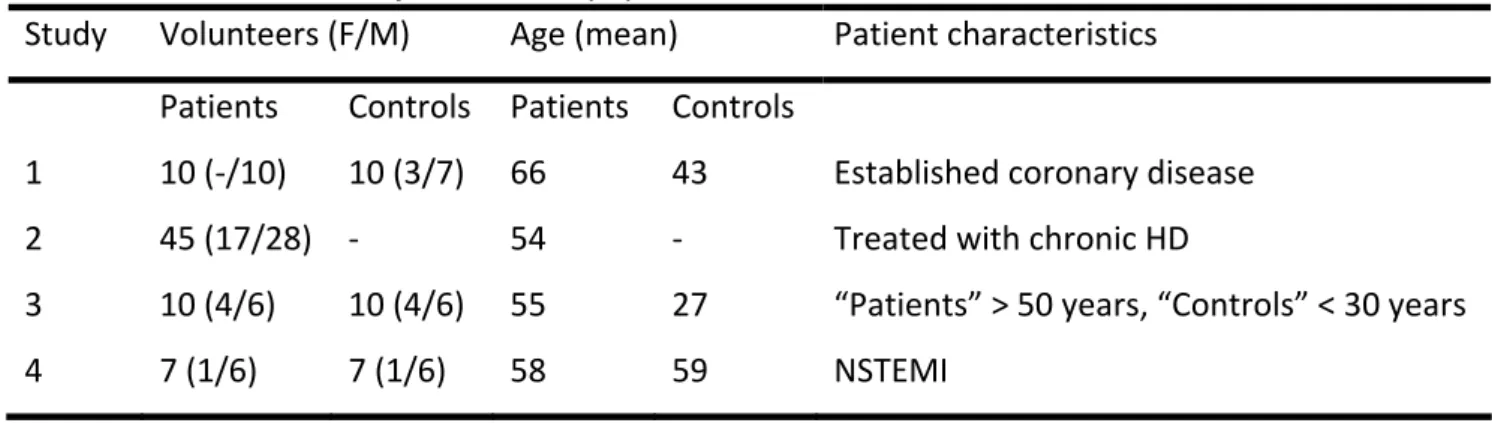
In total, 99 patients have been studied. The studied population in Study 1 consisted of 10 apparently healthy individuals and 10 patients with established coronary disease with significant stenosis (> 50%) in at least one major epicardial artery. In Study 2, 45 patients treated with chronic HD were studied before and after HD. None of the patients showed signs of severe vascular heart disease, congestive heart failure, pericardial disease or acute myocardial ischaemia. The causes of renal disease were diabetes (11 patients), chronic glomerulonephritis (7 patients), focal segmental glomeruloscleros (1 patient), obstructive nephropathy (6 patients), nephrolithiasis (4 patients), chronic pyelonephritis (3 patients), nephrosclerosis (9 patients), polycystic kidney disease (3 patients) and SLE (1 patient). Antihypertensive medications were being used by 37 patients (82 %) and angiotensin‐converting enzyme inhibitors and angiotensin receptor antagonists, alone or in combination, were being used by 25 patients (56 %). Thirteen patients (29 %) were being treated with beta‐adrenergic blockers, 9 patients (20 %) with calcium antagonists and 24 patients (53 %) with furosemide. On the day of the study, no medication was taken until after all investigations were finished.
In Study 3, the studied subjects consisted of 10 younger and 10 older apparently healthy individuals. Inclusion criterion for the younger group was an age of < 30 years (the “Controls” in Table 2) and for the older group age > 50 years (the “Patients” in Table 2). The two age groups did not differ in BMI and arterial blood pressure, and had normal cardiac function with the exception of a slightly reduced E/A ratio reflecting an age‐dependent diastolic disturbance in the older group. The studied subjects in Study 4 were 7 patients with non ST‐elevation myocardial infarction