Nightlife and Regional
Development
Evidence from Greece
Master Thesis within Economics and Management of Entertainment and Arts Master‟s program
Author: Eleftherios Moutsinas
Tutors: Charlotta Mellander, Pia Nilsson, Özge Öner Jönköping June 2011
Master‟s Thesis in Economics
Title: Nightlife and Regional Development: Evidence from Greece Author: Eleftherios Moutsinas
Tutor: Charlotta Mellander, Pia Nilsson, Özge Öner
Date: 2011- 06 - 05
Subject terms: Nightlife, regional development, human capital, creative class, buzz, talent, amenities, cultural consumption
Abstract
Post-industrial economic restructuring in developed countries has downgraded the role of blue-collar labour in regional growth, giving way, conversely, to occupations that demand high concentrations of human capital. Human capital has been documented to positively affect regional growth and income, signifying an urban planning shift towards amenities provision, as a human capital attraction tool. An emerging, highly-valued amenity in the post-industrial society is nightlife. Following Florida‟s reasoning on the rising salience of the creative class, this paper investigates the hypothesis that nightlife attracts high human capital or skilled individuals. It focuses on the paradigm of Greece, using data acquired by the Greek statistics agency and, to a lesser extent, the Greek yellow pages. It employs two measures, the human capital one –calculated as the percentage of the population holding a bachelor degree and above- and an approximation of Florida‟s creative class measure –occupational categorization according to job complexity. Bivariate correlations are applied to account for human capital attracting factors and structural equation modelling to assess nightlife‟s impact on the two measures and respectively, on regional growth.
Table of Contents
1
Introduction ... 1
1.1
Purpose ... 2
2
Historical Background ... 3
2.1
The City in the Centre ... 3
2.2
The New Force ... 5
3
Theoretical Framework ... 7
3.1
Nightlife: An Experience Good ... 7
3.2
Human Capital ... 9
3.3
Human Capital Attraction and Amenities ... 10
3.4
Amenities and Consumption ... 11
3.5
Consumption and Production of Nightlife ... 11
3.6
Buzz and Clusters ... 12
4
Methodology ... 14
4.1
Hypotheses ... 14
4.2
Data Collection ... 14
4.3
Dependent Variables... 16
4.4
Explanatory Variables ... 16
4.5
The New Explanatory Variables ... 21
4.6
The Model ... 22
5
Findings ... 24
5.1
Model Results ... 24
5.2
Controlling for Regional Population ... 26
6
Conclusions ... 31
Figures
Figure 1: Global distribution of economic activity (LPR)...4
Figure 2: Generic Model...23
Figure 3: Human Capital...24
Figure 4: Creative Class...24
Figure 5: Human Capital, controlling for regional population...27
Figure 6: Creative Class, controlling for regional population...27
Tables
Table 1: Final Consumption Expenditure of Households for Recreation and Cultures in Europe...8Table 2: Variables Description...14
Table 3: Descriptive Statistics...18
Table 4: Correlation matrix...19
Table 5: Explanatory Variables correlation matrix...20
Table 6: Component Matrix...21
Table 7: SEM Results...25
Table 8: SEM Results, regional population added...28
Table 9: Top-10 Creative Prefectures...28
1
1. Introduction
“The Hacienda1 must be built”2
(Hook, 2009)
By the year 2050, 68.7 % of the global population will reside in urban areas (United Nations, 2009). Different forces during different time periods have induced to the increasing importance of the city as a structural unit.
This trend emerged and became solidified particularly during the 20th century. The sweeping tides of industrialization led to two consecutive residential trends,
urbanization and suburbanization (Mieszkowski, 1993; Massey, 1998), both closely connected to the city. In the former case, the centre was the core unit, whereas, in the latter, it lost its predominance to an extended, peripheral version of the city. The prevalence of the city is tightly connected to the fact that metropolitan areas provide city dwellers with productivity and amenity premiums (Glaeser, Kolko, & Saiz, 2001) that translate into higher wages and more provision-related benefits, like accessibility to urban attributes and arts institutions.
At the same time, the recent globalization developments that have restructured advanced economies from production to consumption-oriented (Glaeser, 2001), have brought in the forefront the consumption possibilities of urban structure. The
economies of scale that exist in large, metropolitan areas facilitate the provision of a large variety of both public and private amenities (Andersson & Andersson, 2006): cultural, public infrastructure like operas, theatre halls and concert houses, combined with more efficient transportation systems on the public side and more consumption opportunities like ethnic restaurants, shopping malls, dance clubs, cafeterias, theatres, cinemas, on the private side constitute a diversified consumption milieu. Conversely, a different set of environment-related amenities, such as open spaces and outdoor recreation possibilities is being equally valued by a part of the
population. This trend is visible in the existence of reverse residential trends, from urban to rural areas (Irwin & Bockstael, 1999; Summers, Chesire & Senn, 1999). An ever-increasing side of amenities consumption is the one that takes place during night hours and is tightly connected to entertainment, leisure and experience. The rising added value provided by night time experience industries such as concerts and dance clubs is authenticated by the documented increasing spending on experience goods (Beyers, 2004) and the rising interest on the use of night life for regeneration and gentrification of formerly industrial areas (Montgomery, 2003) (Currid, 2007). Increasing average income and leisure time in developed countries (Andersson & Andersson, 2006) considered in conjunction with the ritualization of nightlife and its rise to a self-identification,cultural consumption tool (Chatterton & Hollands, 2003)
1
Hacienda= 1. A large landed estate, especially one used for farming or ranching. 2. The main house on such an estate. 3. A stock raising, mining or manufacturing establishment in the country.
2On Ivan Chtcheglov‟s context (Chtcheglov, 1953) the hacienda was the utopian goal of a new
“psychogeography”, a new way through which urban architecture would affect social life. Factory Records and New Order manager, Tony Wilson used the phrase to signal the need for a new, holistic nightlife premise.
2 has rendered consumption on recreation and entertainment during night-time as an important factor of regional growth.
1.1 Purpose
The purpose of this paper is to investigate the impact of nightlife amenities on attracting human capital and thus, on regional economic growth. Furthermore, it will attempt to identify the magnitude of the effect of different forms of nightlife
entertainment on human capital distribution and the role of a number of diverse factors on regional income.
3
2. Historical Background
The past 40 years have witnessed a gradual decline and then the spectacular comeback of the city centre in the developed world as a force of economic growth. The fordist period of the economy that was founded on mass production and product standardization (Thompson, 2001) intensified and solidified what became known as urban “blue-collar communities” (Kornblum, 1974): large parts of working class neighbourhoods within the city that were employed in close-by factories.
The emergence of neo-liberalism at the beginning of the 1970‟s and the gradual deregulation of national markets (Dicken, 2007) accommodated major corporations, in their quest for lower labour costs, looser regulation and new markets, to outsource and offshore their activities (Dicken, 2007). This trend led to a steady decline of labour in the manufacturing sector that once was the backbone of growth (Clark & Lloyd, 2004) and resulted in chronic unemployment and a steady shift towards the ever flourishing services sector which was nonetheless, often described as “dead-end” activity (Wilson, 1987; Florida, 2002b) or “subsistence occupation” (Clark, Lloyd, Wong, & Jain, 2002). Large parts of the previously flourishing working class
neighbourhoods that were employed in close-by factories, were relatively quickly turned into “spaces of devastation” (Zukin, 1991) or “nightmare landscapes of poverty” (Clark & Lloyd, 2004).During the 1970‟s and 1980‟s the urban landscape was gradually losing its appeal as a residential destination, while mainly medium and high class families were moving to the suburbs (Mieszkowski, 1993; Massey, 1998). Considered in conjunction with the advances in communication technologies that were minimizing the importance of distance (Clark, et al., 2004; Atkinson, 1998) and led to the emergence of the theory of an equal opportunities, digitally-connected “flat world” (Friedman, 2005), the future of city centres seemed bleak. If you could live anywhere, having the same opportunities, why would you choose to live in the dirty, traffic-ridden, overpriced and crime-driven city centre (Glaeser, 1998)?
However, the advance of the 1990‟s brought renewed interest on the importance of city centres, both from an administrative and an economic perspective. The ideas of Jacobs (1961,1969) became extremely current as major ex-industrial cities saw large parts of their deteriorated ex-industrial downtown zones being regenerated
(Montgomery, 1995; Alexandri, 2006; Lavanga, 2006; Romein, et al., 2009) and downtown housing prices soaring (Currid, 2007; Florida, 2007).
2.1 The City in the centre
The literature on the value and the importance of the city as an economic unit initially focused its interest on postulating that the city is an important growth factor. Jane Jacobs (1961, 1969) stressed the crucial role cities played in economic development “through the generation and mobilization of new knowledge” (Florida, 2002b), arguing also that the city acts as a force that reinforces economic activities of “exporting, import substitution and the circulation of income earned through local products and services” (Montgomery, 2003, p. 298). Later, Molotch (1976) viewed the city from a sociological perspective, identifying it as a growth machine based on the
4 increasing intensification of land use” and where “conditions of community life are largely a consequence of the social, economic and political forces embodied in this growth machine”. Storper (1997) considered it as a structural unit for coordinating human actions, departing from the traditional economic approaches of that just the sum of factors of production lead to growth, stressing that “that one can see the same goods and services in so many places does not mean that those same „anywheres‟ can innovate, initiate and distribute these increasingly omnipresent things”. Later, Molotch (2001) built on Storper‟s ideas to stipulate the growing
importance of place in the production process, as a means of product differentiation, stressing that “even if everything being consumed is the same across the earth, the local production systems that yield them would not be made the same by that fact”. Finally, Porter (1993) tracks the competitive advantage of nations in highly localized processes: “difference in national values, culture, economic structure, institutions and histories”.
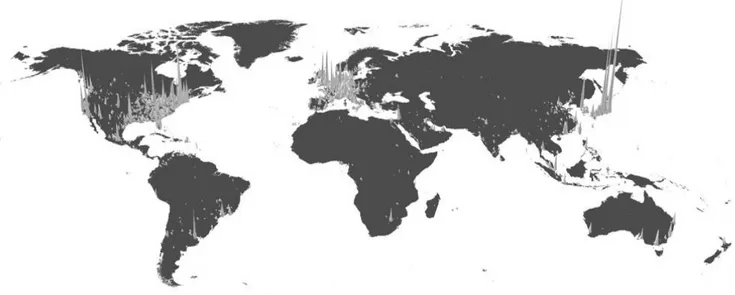
As mentioned above, the advance of the 1990‟s saw a massive re-emergence of the city core, as economic activities, from Silicon Valley‟s high-tech to Hollywood‟s film industries and to banking and financing in London, kept on clustering in urban areas, despite the contrary predictions of the “flat world” theory adherents. Florida (2008) describes this with his notion of a “spiky world”, as it is illustrated at Figure 1 below, driven by ever growing mega-regions that will become even denser the next
decades.
Source: Florida, Gulden & Mellander (2008)
Figure 1: Global distribution of economic activity (LPR)
Having begun consolidating the fact that the resurgence of the city is not accidental, after the late 1980‟s, the literature moves from the standpoint of proving that city is important to identifying the reasons for its predominance. Molotch‟s (1976) theory of a city/growth machine based on intensification of land use and higher rents is being criticized (Clark & Lloyd, 2004) and surpassed by the work of modern city
5 researchers. Different factors have been used to explain concentration of economic activity in urban areas, such as internal or external economies of scale in production (Mills, 1967), expenditure on public goods (Arnott & Stiglitz, 1979), business
externalities among firms, also known as localization economies (Fujita and Ogawa, 1982) as well as positive localization externalities which increase the marginal product of labour and overcome the heterogeneity in labourer‟s tastes for location (Anas, 1992). Krugman (1991) pointed towards the effect of pecuniary externalities, positive feedback, increasing returns and initial conditions‟ importance. Finally, Alonso, Mills and Muth (Lemoy,Raux & Jensen,2010) developed their monocentric model to study the location of agents in a city, where they compete for land use and have daily monetary and time costs to access their workplace.
2.2 The new force
Contrary to the first tide of urbanization, the resurgence of the city is driven by a different category of workers. While for the largest part of the 20th century the driving force was the working class, now a different kind of social class is driving the change. Data from the US (Florida, 2002c) depict a major decline of the traditionally important occupations of agriculture and blue-collar employment as a percentage of the total workforce between 1900 and 1999. While in 1900 blue-collar and agriculture employment accounted for more than 70% of total workforce, in 1999 their share dropped to less than 30%. Instead, a different class of workers has taken over the working scene, one that its core competencies lay at its mental capabilities rather than its physical ones. This shift was partially captured by the concept of the “new economy” (Alexander, 1983) that emerged in the mid 1980‟s, even though the term was quite general and was mainly used to describe “the transition from heavy
industry to a new technology based economy”. Clark identified that the “displacement of manufacturing from central city space changed” not only the economical
foundations, but also “the class structure of large cities, with political and cultural consequence” (Clark, Lloyd, Wong, & Jain, 2002).
This new class is not a uniform one and has no concept of group identity (Markusen, 2006), but has a common feature: it deals with the immaterial world. As early as 1961, Peter Drucker (1973) and Fritz Machlup (1962) described a new group of workers by coining the term “knowledge workers”. Erik Olin Wright (1979) writes about a new “professional-managerial class”. Paul Fussell (1992) provides us with a theory for his “x-class”. Reich (1992) talks about “symbolic analysts”, describing the part of the working force that manipulates ideas and symbols. Finally, Florida (2002c) describes and unifies previous theories into what he calls the “creative class”: “a class of workers whose job is to create meaningful new forms”.
Using data from the U.S. Bureau of Labour Statistics, Florida (2002c) identifies the types of occupations that have seen vast increases in absolute and relative numbers. On one hand, these are the ones related to services provision: food-service workers, janitors, secretaries, security guards etc. On the other hand, he identifies and unifies occupations, such as scientists and engineers, university professors, artists, actors, designers and architects, analysts and opinion makers. In order to describe the latter group of occupations, he comes up with a new social class: “the creative class”. These two categories amount to almost 75% of the working force in 1999, a
6 percentage slightly higher than the one the blue-collar and the agriculture class occupied in 1900.
Such a profound shift points towards the emergence of a different economic structure that has taken place in post-industrial societies: the basic core of the labour force and the economy as a whole has shifted from being labour-intensive to being knowledge-intensive. Thus, a grand part of recent literature deals with a new growth-driving factor: human capital.
7
3. Theoretical Framework 3.1 Nightlife: an experience good
Night-time economies have risen in salience the past years. In the UK, 80 % of young adults visited clubs and bars in 1999, a 12 % increase from 1994 (Chatterton & Hollands, 2003). The anthropologically archetypical fear of darkness and the understanding of the nightlife zone as a site of transgression and heavy regulation are giving way to a rising terrain of social activity and personal identity (Lovatt & O'Connor, 1995). Going out has been transformed to a permanent socializing ritual, aided by economic restructuring and growing experience of modern life through cultural consumption in the city (Hollands, 1995).
Chatterton & Hollands (2003) approach an understanding of nightlife, or what they term “nightscapes”, as “an integrated „circuit of culture‟ which comprise the three processes of production, regulation and consumption”.
Nightlife could be viewed, from an economic perspective, as a dual terrain for art and entertainment. It can embrace cultural activities, such as music concerts, theatre shows, art galleries, dance shows and video installations, culinary premises, such as restaurants, cantines, fast food chains and entertainment spaces, such as bars, pubs and clubs. Essentially, nightlife encompasses all the cultural and entertainment activities, and their subsequent consumption, that take place during night-time. Hence, we can view night-time economies as an economic time zone where culture and entertainment interact and overlap.
Oldenburg (1989) stressed the importance of what he calls the “third place”, signifying a “core setting for informal public life”, different from the first -home- and the second –work- place. He identified the significance of the experience value provided by hanging out in “third places” through the “primacy of conversation, certainty of meeting friends, looseness of structure, and eternal reign of the importance of fun”.
Prior to Oldenburg, the Situationist International Revolutionary Group, one of the ideological protagonists of the May ‟68 events in Paris, advocated the importance of constructing situations as life experiences, as opposed to the passive experience of life promoted by the growing “Society of the Spectacle” (Debord, 2002 (1967)). Pine and Gilmore (1999) documented the economic value of experience by using the example of Café Florian in St. Mark‟s Square in Venice, where a single espresso costs 15 dollars (actually, it costs 12 Euros in August,2009). They reason that an economy goes through successive stages from commodities, to goods, to services and then, to experiences. The added value provided by the experience of drinking a coffee at the historical San Marco square constitutes the largest part of the final cost, documenting the immense value than an experience product can create. In the UK in 1995 “the contribution of creative industries to the economy, net of inputs (value added) was about £25 million or nearly 4 per cent of gross domestic product” (Hall, 2000).
8 The growing importance of experience goods is closely connected to structural changes in developed economies of the past 100 years. Andersson & Andersson (2006) provide us with a number of reasons for that development. Being a luxury good, with income elasticity greater than unity, art and entertainment goods are highly susceptible to income fluctuations. For the past 100 years, GDP per capita in developed countries has been steadily rising, while annual hours of work have dropped immensely, numbers devoted to education quadrupled and life expectancy rose to more than 70 years old. Along with more disposable income, there is more time to consume. Therefore, the percentage of household budget allocated to arts, entertainment and leisure consumption has reached an average of 10% and is expected to rise even further. In the E.U. 15 it peaked at 9.7 % in 2001 to decrease slightly 3 years later and further more after the 2007 crisis, as we can see from Table 1 below.
Table 1: Final Consumption Expenditure of Households for Recreation and Cultures in Europe
Final Consumption
Expenditure of Households for Recreation and Culture (percentage) 1995 2001 2007 2009 E.U. 15 9.1 9.7 9.5 9.3 Denmark 10.2 10.9 11.7 10.7 Germany 9.3 9.9 9.5 9.3 Greece 6.3* 7.6 7.6 7.6 Spain 8.3 9.1 8.7 8.5 France 8.7 9.3 9.3 9.1 Italy 7.1 7.2 6.9 6.8 Netherlands 10.8 11 10.6 10.2 Austria 11.4 11.9 11.4 11.2 Finland 10.6 11.2 12.2 11.6 Sweden 10.5 11,8 11.7 11.5 U.K. 11 11,5 11.4 11.5 Norway 11.3 12,7 12.6
*2000 data Source: Eurostat
While the EU 15 average lies just below 10%, at the most advanced economies of the Union lay well beyond that at around 11-12 %.
Night-time economies are highly contingent to the added value offered by
experience. What is being offered in most of night-time premises in the world today is not just a beer, but a set of elements that constitute the experience around that beer. This is evident in the massive popular reach of modern music movements or music scenes: from Seattle‟s grunge scene (Beyers, 2004), to Philadelphia rave scene (Andersson, 2009) and “Madchester‟s” (a word produced by the synthesis of the words “mad” and “Manchester” that describes the spirit of that music scene) acid house era (Hook, 2009), music scenes have recruited vast numbers of supporters and have created large amounts of documented or undocumented wealth. These art and entertainment movements enclose a scene duality defined as forms of art that share the same structural values, but also as socially structured experiential forms of cultural consumption that transmit and spread specific values. Their products and
9 their currency co instantaneously is experience: the experience of consuming socially a cultural product, while sharing the same values framework. It is not just about a beer, but about the experience of consuming it within certain circumstances.
The time set of consumption in such scenes is, most commonly, the night. This is not to say that these activities will or have to take place during night time by default, but rather that they would most commonly occupy that time zone which is connected to leisure and recreation, as a non-work time slot.
Thus, nightlife can be ultimately viewed as an experience good, whose
characteristics and values are defined by the larger “scene” within which it resides and one that acts as a facilitator of fun and social interaction.
3.2 Human Capital
To understand why nightlife has become an important part of the post-modern economic foundation, it should be viewed through the magnifying glass of the upsurge of human capital.
Firstly, two ways for gauging human capital levels have been proposed:
1. By calculating educational attainment: the proportion of the population that holds a bachelor degree or above (Florida, 2002b; Lucas, 1988; Glaeser, et al., 2003).
2. By using occupational categories, rather than educational attainment: Florida‟s “creative class” (computer and math occupations, architecture and engineering, life, physical and social science, education, library and training positions and many more), defined as this group of occupations in which individuals “engage in complex problem solving that involves a great deal of independent judgment and requires high levels of education or human capital” (Florida, Mellander, & Stolarick, 2008).
The former method is justifiable, as education and training are the most important investments in human capital and easy to gauge, because relevant data are usually easily accessible. Nevertheless, it begets a number of disadvantages, such as leaving out college drop-outs who have contributed immensely to US and global economies, being such a broad measure that does not allow us to identify specific types of human capital and to capture factors that improve labour productivity, such as creativity, intelligence, on-the-job knowledge and accumulated experience (Florida, Mellander, & Stolarick, 2008).
Florida‟s creative class has been a controversial term and has been refuted by some researchers. Markusen (2006) decried Florida‟s measure, by criticising the lack of class self-consciousness. Pratt (2008) argues that Florida has “prioritized
consumption or/and idealised culture” and has failed to identify the importance of cultural production.
Using the first method, various researchers have acknowledged the magnitude of human capital as a regional growth factor. Glaeser proves that human capital
10 at the country level (Glaeser & Saiz, 2003; Glaeser, 1998). Lucas (1988) argues that in cases where human capital exerts spill over effects from one person to another, “the wage rate of labour at any given skill level will increase with the wealth of the country in which he is employed”. Porter (1993) acknowledges that the role of nation as a structural unit has risen, due to a shift on the basis of competition “to the
creation and assimilation of knowledge”. Florida (2008) identifies the different paths through which the two measures affect regional development. Finally, Mellander & Florida (2007) use the creative class method to account for regional development in Sweden, finding that the latter method strongly predicts growth. The human capital claim is documented also by national, large-scale studies in the U.S and U.K. (Simon & Nardinelli, 1996; Rauch, 1993).
3.3 Human Capital attraction and Amenities
While human capital is becoming more and more important for regional growth, its rising importance is transforming societies as a whole. The new class of knowledge workers that is being formed is changing urban growth dynamics.
Creativity, as the creation of useful new forms out of the post-industrial, knowledge-intensive economy, is now the key. Knowledge and information are the tools and materials for creativity and innovation is its product (Florida, 2002c). The creative class is the carrier of this value. The more our societies value creativity, the more this new class will rise in significance and the more its demands will grow to be central to urban growth.
The new class members share common characteristics such as high education, absence of children and higher disposable income (Gottlieb, 1994; Florida, 2002c) and common values: individuality, meritocracy, diversity and openness. Their increasing labour mobility, documented by their focus on work values, such as challenge and flexibility in contrast to high wages and bonuses and their horizontal labour concerns, instead of vertical “climbing-up-the-ladder” ones has affected their lifestyle demands (Florida, 2002c). When participants in Florida‟s creative class make location decisions, they look for thick labour markets, lifestyle choices, social
interaction opportunities, diverse social environments, authentic places with strong identity and a quality of place value, as opposed to quality of life. The places in which they choose to locate and that possess these kinds of qualities are places where also firms want to locate in order to gain access to their skills and innovation (Gottlieb, 1995 ). Thus, “places able to attract people are able to attract firms and are the likely centres of economic growth” (Currid, 2009).
In the process of trying to attract this highly mobile labour class, cities do or have to cater for their changing needs, ultimately influencing their policies.
One of the strongest theoretical theses in that part of literature is that amenities act as a magnet for human capital. Clark (2007) places increasing importance on amenities as a human capital attracting factor by portraying three models of urban development. Florida summarizes the three different, competing theories that shape the distribution of human capital into three categories: Universities, Amenities and Tolerance and Openness (Florida, Mellander, & Stolarick, 2008).
11 The exact content of the term “amenities” is, however, fluidic. Various researchers have applied and tested different definitions. The basic constituents were originally considered to be schools, environment, lack of crime and congestion (Gottlieb, 1994; Glaeser, 1998). Gottlieb (1995) broadened the spectre to include all kinds of
residential amenities, such as pollution, distance to cities, rush hour trains etc. Glaeser, Kolko and Saiz (2001) broadened the spectre even further, dividing urban amenities into four categories: Services and Consumer Goods, Aesthetics and Physical Setting, Good Public Services and Speed.
In general, we could argue that the term “amenities” is an open concept that encompasses all regional features that residents could value as such.
3.4 Amenities and consumption
While the rising creative class becomes more mobile, less strained to traditional values and higher-paid, it changes its consumption patterns. It no longer demands only for good schools and crimeless and clean neighbourhoods –which considers them as given-, but also for lively, authentic, buzzing places that can offer a diverse choice of lifestyle opportunities to interact with people from various backgrounds. Post-modern urban demands seem to become more participatory, recreational and experience-based. The old distinction between bohemians and bourgeois is said to be obsolete and the limits are blurring, giving rise to theories about the unification of the two into a new category: “bohemian-bourgeois” or Bobos (Florida, 2002a). Silver, Clark and Rothfield (2007) suggest by a schema of triple space functionality that post-modernity assigns a third role or a third view over urban space: that of a place of consumption. They claim that, not only do we experience space as residents (neighbourhood) and as producers (industrial district), but also as consumers (leisure and experience). And, even more interestingly, these different roles and views often occur simultaneously. Individuals increasingly define themselves through cultural consumption and behave as tourists in their own cities. They coin the term “scene” to account for a “conception of cultural consumption as a socially structured activity” that provides forms of social belonging in the post-modern society.
The most important implication of that post-modern development is that culture and tourism are gaining momentum as they become more significant not only during vacation time, but also in everyday life, in our everyday extended habitat. They are more and more used to define personal identities and, hence, are influencing the organization of urban space and impose its restructuring to more consumer-friendly environments.
3.5 Consumption and production of nightlife
Within this newly acquired context, nightlife‟s rising contribution to economy can be viewed by two different angles: consumption and production.
Consumption-wise, nightlife is an amenity highly-valued by the rising knowledge-focused working class. It is an urban asset that is valued when location decisions have to be taken. Coslor (2001) documents that reasoning in her exploratory work of
12 young students‟ nightlife and location decisions, connecting Pittsburgh‟s inability to sustain graduates in the city with the relative indigence of night-time choices. It is also an important activity when it comes to gentrification and rising housing rents. In areas, such as Soho and Lower East side in New York (Currid, 2007) and elsewhere (Alexandri, 2006) marginal and artistic communities regenerated former “spaces of devastation” and led to a total rise in housing rents. This advance was partially accomplished by the renowned livelihood of these neighbourhoods‟ nightlife. Gentrification through nightlife amenities provision has occurred also via central, governmental planning, as for example in Port Vel area in Barcelona, Spain (Chatterton & Hollands, 2003).
Finally, it is an economic terrain that can be used for “branding” a place: New York is “the city that never sleeps”, Paris is “the city of light”, London is the Theatre capital of the World and Ibiza in Spain and Mykonos in Greece are summer party islands. “Nightlife experiences emerge from specific localities that are unique to each urban centre” (Brabazon & Mallinder, 2007) and follow the same premise of importance of place in production.
Parallel to the rising consumption and production of nightlife, there comes a rising concern for the predominance of pre-structured “fast-food”-like experiences, a phenomenon described as corporatization. Chatterton and Hollands (2003) reason that mounting dominance of branding and market segmentation in the urban entertainment threatens to demolish the distinctive character of cities. Production-wise, nightlife is a generator of jobs and revenues. Documented
examples include New York‟s Lower East side post-punk, disco and hip-hop scenes (Currid, 2007), Seattle‟s grunge scene (Beyers, 2004), Dublin‟s Temple Bar
(Montgomery, 1995) and others. The Future Foundation, a market and consumer research group, detailed in a 2004 report that “by 2020 a quarter of the UK
population – thirteen million people - will be “economically active” between the hours of 6pm and 9am, compared with seven million at present” (Brabazon & Mallinder, 2007).
However, one of the most important contributions of nightlife in the production process is the reinforcement of face to face contact as a production method. It is what Storper & Venables (2004) describe as “buzz” and claim to be the economic force of the city.
3.6 Buzz and clusters
The notion of buzz is closely linked to the phenomenon of agglomeration and clusters. A cluster is “a grouping of industries linked together through customer, supplier and other relationships which enhance competitive advantage”
(Montgomery, 2003).
Industries have been agglomerating in the past as well, but now this process seems to be taking place in a different way. The growing importance of human capital exerts multiplying effects on the distribution of human capital its self. The more sector-related, knowledge-intensive occupations become concentrated, the more human
13 capital tends to cluster in the same geographical spaces. Evidence from the
entertainment (Florida, Mellander, & Stolarick, 2009b), music (Florida, Mellander, & Stolarick, 2009a) and arts and culture industries (Currid & Williams, 2010) support this argument. This postulates an important shift in the way agglomeration dynamics work today, in comparison to the past: “cities used to be centres of agglomeration of material production; now the motor force of agglomerations is the production and communication of ideas, knowledge and information” (Storper & Venables, 2004). What is astonishing is that despite the immense evolution of communication media, the declining importance of distance and the relative easiness of information
exchange today, information-based industries continue to cluster. With specialized immaterial producers owing “branch offices in major cities near the location of deployment of their ideas,” it seems quite likely “that the „shipping‟ of an intellectual product may be as costly as shipping a tire or an axle” (Storper & Venables, 2004). Storper & Venables (2004) claim that the missing key that is needed to explain this “stubborn”-looking clustering behaviour is the mechanism that lies at the heart of the agglomeration process: face to face contact, henceforth, F2F. They argue that “F2F contact is an especially rich and efficient technology of communication in many areas of today's economy". All in all, F2F contact is at the heart of a key advantage of the city today, its buzz”. In their remarkable paper, they identify the importance of F2F contact in coordination and they suggest that it is the ideal type of coordination and communication in environments with real uncertainty, where tacit knowledge needs to be communicated.
Currid (2007) documents the way in which local artists derive new combinations of production and business people accomplish new contracts in New York‟s night Clubs, as well as the fact that most of new start-ups and ventures in Silicon Valley are taking place in the close-by cafeterias.
Arvidsson (2007) provides a very interesting example of how the “underground” urban environment interacts and transmits its cultural production to the advertising industry in Copenhagen through F2F contact, functioning as an unpaid creativity pool that produces meaningful new forms, which thereafter are being appropriated by the managerial class.
Markusen & King (2003) explore the idea of the “artistic dividend”: the economic spillovers of artistic activity in regional economy, by gains in productivity and income, through the use of extended, “in the loop” networks. They use an occupational
approach to depict the way local artists in the Twin Cities of Minneapolis and St. Paul disperse their activities.
It is not argued here that all the artistic and cultural spillovers are mechanically caused by participation in nightlife, but rather that nightlife settings act as a loose and fun-oriented environment for F2F contact, which is the most important type of
coordination in environments of real uncertainty and tacit knowledge transmission. Such types of conditions rise in salience while economies enter the knowledge-intensive era of production. Hence, nightlife becomes a small, but important piece of the new puzzle.
14
4. Methodology 4.1 Hypotheses
The basic hypothesis of the study is that nightlife provision affects human capital concentration, thereby influencing positively regional income. In order to capture the notion of human capital, two measures are employed: the human capital one – calculated as the percentage of the population holding a post-secondary education degree and above- and an approximation of Florida‟s creative class measure – occupational categorization according to job complexity and specialization. Thus, two hypotheses will be tested:
1. The provision of nightlife effects positively human capital concentration and consequently, regional income.
2. The provision of nightlife effects positively creative class concentration and consequently, regional income.
In order to avoid misconceptions, the term talent will be used henceforth to describe the two human capital measures as a whole.
4.2 Data Collection
Greece was divided into 13 peripheries, 51 prefectures and 1033 municipalities and communities up until December 2010. The original intension was to use data on municipality and community level, so that the effect could be tested on a micro and more precise, regional level. Nevertheless, because all of them were not readily available at the Greek Statistics agency, data on prefecture level were used instead. Although data on prefecture level supply us with a wider framework and may not be so accurate on an urban level, they still endow us with important insights from the Greek paradigm. It must be stated that the relatively small size of the sample is a relative weakness of this paper, so it is suggested that for future research data on a municipality and community level could be used instead.
Nightlife in Greece is quite diverse and intense, ranging from bars and clubs to restaurants, fast food chains, theatres and live music venues. In this paper, the variables used will attempt to capture the entirety or the largest part possible of that night time activities.
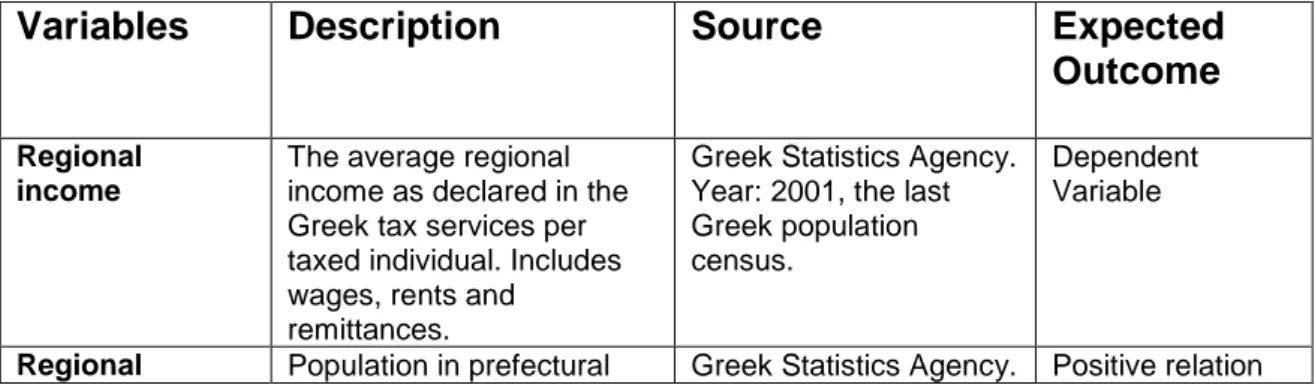
Fifteen variables were collected, which are depicted at Table 2 below. Table 2: Variables Description
Variables
Description
Source
Expected
Outcome
Regionalincome
The average regional income as declared in the Greek tax services per taxed individual. Includes wages, rents and
remittances.
Greek Statistics Agency. Year: 2001, the last Greek population census.
Dependent Variable
15
population level. Year: 2001, as before. to talent and
regional income.
Human capital Percentage of population with a post-secondary education degree and above.
Greek Statistics Agency and divided by the regional population. Year: 2001.
Positive relation to regional income.
Creative class Percentage of the regional working force that deals with more complex problem solving.
Greek Statistics Agency and divided by the regional population. Year: 2001. Positive relation to regional income. Theatres per capita
Theatre premises per capita.
Greek Yellow Pages and divided by the regional population. Year: 2010. Positive relation to talent, possibly positive regional income. Cinemas per capita
Cinema premises per capita.
Greek Yellow Pages and divided by the regional population. Year: 2010. Positive relation to talent, possibly positive to regional income. Entertainment centres per capita
Large-scale clubs with live
music and D.J.‟s per capita. Greek Statistics Agency and divided by the regional population. Year: 2010. Positive relation to talent, possibly positive to regional income. Hotels, restaurants and bars per capita
Number of hotels, restaurants and bars per capita.
Greek Statistics Agency and divided by the regional population. Year: 2002. Positive relation to talent, possibly positive to regional income. Turnover of hotels, restaurants and bars per capita
Aggregated turnover of the economic activities
mentioned per capita.
Greek Statistics Agency and divided by the regional population. Year: 2002. Positive relation to talent, possibly positive to regional income. Entertainment, cultural and athletic activities per capita Miscellaneous types of entertainment, cultural and athletic activities per capita.
Greek Statistics Agency and divided by the regional population. Year: 2002. Positive relation to talent, possibly positive to regional income. Turnover of Entertainment, cultural and athletic activities per capita
Aggregated turnover of the economic activities
mentioned per capita.
Greek Statistics Agency and divided by the regional population. Year: 2002. Positive relation to talent, possibly positive to regional income. Number of public universities per capita Number of public Universities per capita.
Greek Statistics Agency and divided by the regional population. Academic year: 2002/2003. Positive relation to talent, positive to regional income. Teaching staff per capita Number of Public
Universities‟ teaching staff per capita.
Greek Statistics Agency, summed and divided by the regional population. Academic year: 2002/2003. Positive relation to talent, possibly positive to regional income. Private and public colleges per capita
Number of private and public post-secondary education institutions per capita.
Greek Yellow Pages and divided by the regional population. Year: 2010. Positive relation to talent, possibly positive to regional income. Overnight stays per capita Aggregated number of overnight stays in hotels or other temporary
accommodation per capita
Greek Statistics Agency and divided by the regional population. Year: 2006 Unpredicted relation to talent, positive to regional income
16
4.3 Dependent Variables
Human Capital
It is gauged as the percentage of the regional population holding a post-secondary education degree and above. Five different categories of degree holders –Private and public post-secondary education, technical higher education, theoretical higher education, master degree and PhD holders- per prefecture were summed and divided by the regional population.
Creative Class
It is defined as the percentage of the regional working force that deals with more complex, knowledge-intensive problem solving, “that involves a great deal of independent judgment and requires high levels of education or human capital in its working life” (Florida, Mellander & Stolarick, 2008). Individual occupations at the Greek database were divided to 9 categories, according to specialization and complexion. The creative class measure is calculated by summing up the top three, “Members of the parliamentary bodies: Senior administrative and managerial executives of the public and private sector”, “Individuals practising scientific, artistic and relevant occupations” and “Technological and technical assistants and relevant occupations‟ practising individuals” respectively and dividing them by the regional population.
Regional Income
The average regional income per taxed individual, as declared in the Greek tax services. It includes wages, rents and remittances.
4.4 Explanatory Variables
Regional population (Reg. Pop.) Total population in prefecture level. Theatres per capita (Theatres)
Total number of theatre premises per prefecture, divided by the regional population. The final result is multiplied by 10000, so as to avoid dealing with an excessive number of decimals.
Cinemas per capita (Cinemas)
Total number of cinema premises per prefecture, divided by the regional population. The final result is also multiplied by 10000.
Entertainment Centres per Capita (Ent. Centres)
Entertainment centres are large scale clubs with live music and D.J. performances. They have been quite prevalent from the middle of the 1980‟s and onwards as nightlife consumption hotspots, so it would be interesting to see how they will
17 perform. The final result is divided by the regional population and multiplied by
10000.
Hotels, restaurants and bars per capita (HRB)
Total number of hotels, bars and restaurants, divided by the regional population. The final result is multiplied by 10000.
Turnover of hotels, restaurants and bars (Turn. HRB)
Turnover of the activities mentioned, divided by the regional population. The final result is also multiplied by 10000.
Entertainment, cultural and athletic activities (ECA)
This category contains diverse economic activities, such as movies production, distribution and screening, radio and television activities, outdoors entertainment activities, libraries, museum and zoological activities and many others. It is expected to correlate significantly with Cinemas and maybe Theatres per capita. The final result is multiplied by 10000.
Turnover of entertainment, cultural and athletic activities (Turn. ECA) Turnover of the activities mentioned. The final result is multiplied by 10000. Number of public universities per capita (Univ.)
Total number of public technical and theoretical Universities, divided by the regional population and multiplied by 10000.
Teaching staff per capita (Teach. Staff)
Total number of public universities‟ teaching staff, divided by the regional population and multiplied by 10000. This variable is employed in order to complement the previous variable and capture the size of different universities.
Private and public colleges per capita (Colleges)
Private and public colleges are post-secondary education institutions, offering mainly more specialized knowledge, closely connected to the labour market. Their output to the regional economy might be important , in terms of knowledge production. Their total number is divided by the regional population and multiplied by 10000.
Overnight stays per capita (Overn. Stays)
Overnight stays per capita is a measure for touristic regions. It sums the total number of stays in accommodation facilities, divided by the regional population.
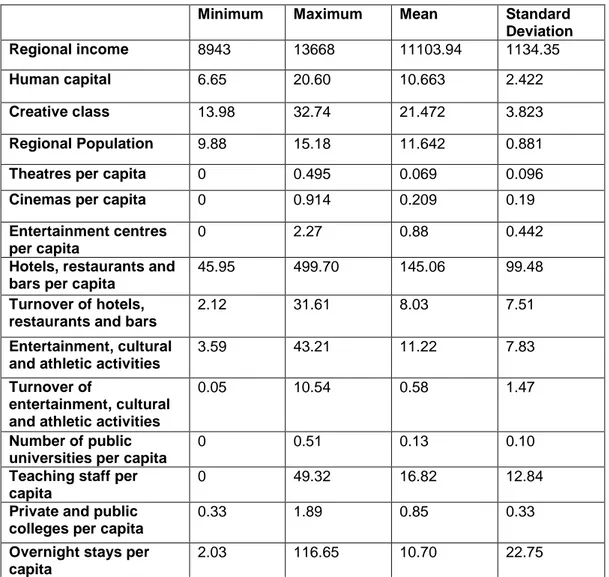
18 The descriptive statistics of the basic fifteen variables can be viewed at Table 3 below.
Table 3: Descriptive Statistics
Minimum Maximum Mean Standard
Deviation
Regional income 8943 13668 11103.94 1134.35
Human capital 6.65 20.60 10.663 2.422
Creative class 13.98 32.74 21.472 3.823
Regional Population 9.88 15.18 11.642 0.881
Theatres per capita 0 0.495 0.069 0.096
Cinemas per capita 0 0.914 0.209 0.19
Entertainment centres per capita
0 2.27 0.88 0.442
Hotels, restaurants and bars per capita
45.95 499.70 145.06 99.48
Turnover of hotels, restaurants and bars
2.12 31.61 8.03 7.51
Entertainment, cultural and athletic activities
3.59 43.21 11.22 7.83
Turnover of
entertainment, cultural and athletic activities
0.05 10.54 0.58 1.47
Number of public universities per capita
0 0.51 0.13 0.10
Teaching staff per capita
0 49.32 16.82 12.84
Private and public colleges per capita
0.33 1.89 0.85 0.33
Overnight stays per capita
2.03 116.65 10.70 22.75
It is visible by the above statistical results that human capital and creative class are two different measures. The difference between their share of the population shows that the creative class measure accounts for considerably more than educational attainment, even though it largely includes it. Moreover, the wide range of both measures shows that some regions are more effective at attracting human capital and creative class members.
The range of hotels, restaurants and bars, turnover of hotels, restaurants and bars, entertainment, cultural and athletic activities and turnover of entertainment, cultural and athletic activities provide us with evidence that consumption of nightlife varies considerably between regions.
The same stands for overnight stays per capita: certain regions are much more touristic than others.
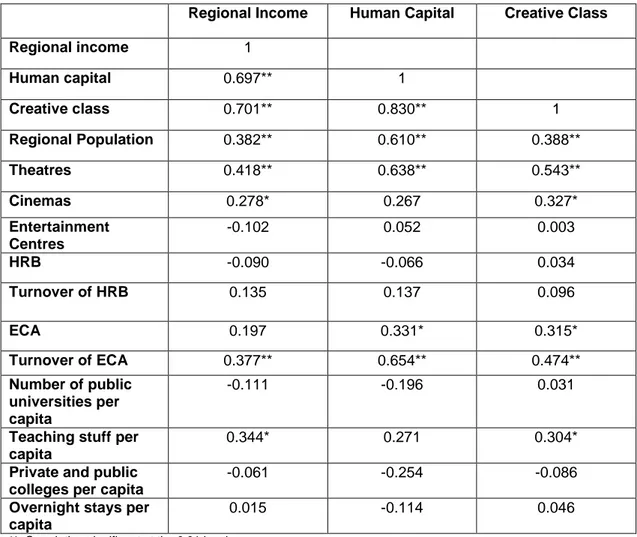
19 Correlations between all variables on one side and regional income, human capital and creative class on the other are depicted in Table 4 below.
Table 4: Correlation matrix
Regional Income Human Capital Creative Class
Regional income 1 Human capital 0.697** 1 Creative class 0.701** 0.830** 1 Regional Population 0.382** 0.610** 0.388** Theatres 0.418** 0.638** 0.543** Cinemas 0.278* 0.267 0.327* Entertainment Centres -0.102 0.052 0.003 HRB -0.090 -0.066 0.034 Turnover of HRB 0.135 0.137 0.096 ECA 0.197 0.331* 0.315* Turnover of ECA 0.377** 0.654** 0.474** Number of public universities per capita -0.111 -0.196 0.031
Teaching stuff per capita
0.344* 0.271 0.304*
Private and public colleges per capita
-0.061 -0.254 -0.086
Overnight stays per capita
0.015 -0.114 0.046
**. Correlation significant at the 0.01 level. *. Correlation significant at the 0.05 level.
From the above results we can infer a number of conclusions. First, the two talent measures are significantly related to regional income in Greece, creative class being slightly stronger. The two measures are also highly correlated, even though not quite the same, as it was shown before in table 3. The high degree of correlation does not come as a surprise, since education is an important, but not obligatory, prerequisite for entering the creative class. This conclusion comes in line with the existing findings presented at the first part of the paper and supports Florida‟s measure as a slightly more efficient one, when accounting for regional income in the Greek context. Problems created from the high correlation of the two measures will be avoided, because their effect will be tested separately.
Second, Theatres, entertainment, cultural and athletic activities and their turnover correlate significantly with human capital, while the same variables, plus cinemas, seem to be related to creative class preferences. On the contrary, entertainment centres, hotels, bars, restaurants and their turnover seem to have a relation with the two measures. On one hand, the significant nightlife variables were the ones
20 expected, as we have seen from previous literature that recreational amenities, such as cultural and athletic ones, have been proven to predict human capital
concentrations. On the other hand, the insignificant variables seem to be more consumption-oriented, even though the category hotels, bars and restaurants was expected to be significant. Nevertheless, the total effects will be tested on the final model.
Third, regional population is significant for both human capital and creative class measures and regional income, while it seems to correlate extensively with human capital, but not equally strong in relation to the creative class.
Fourth, some nightlife variables seem to correlate significantly with regional income. Theatres and turnover of entertainment, cultural and athletic activities per capita are significant at the 0.01 level, whereas cinemas per capita is significant at the 0.05 level. This conclusion seems to have important implications for regional planning, but it has to be tested in a regression along with the rest of the variables to get a definite result.
Finally, from the educational variables, only teaching stuff per capita is significant for regional income and creative class at a 0.05 level, but not for human capital.
Overnight stays per capita is quite surprisingly insignificant for all three variables. Since tourism is one of the major industries in Greece, it would be expected to have a significant relation with, at least, regional income.
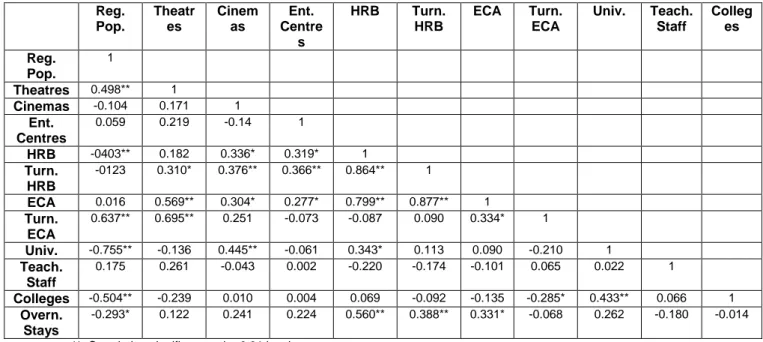
In the Table 5 below, the correlations between the explanatory variables are depicted.
Table 5: Explanatory Variables correlation matrix
Reg. Pop. Theatr es Cinem as Ent. Centre s HRB Turn. HRB ECA Turn. ECA Univ. Teach. Staff Colleg es Reg. Pop. 1 Theatres 0.498** 1 Cinemas -0.104 0.171 1 Ent. Centres 0.059 0.219 -0.14 1 HRB -0403** 0.182 0.336* 0.319* 1 Turn. HRB -0123 0.310* 0.376** 0.366** 0.864** 1 ECA 0.016 0.569** 0.304* 0.277* 0.799** 0.877** 1 Turn. ECA 0.637** 0.695** 0.251 -0.073 -0.087 0.090 0.334* 1 Univ. -0.755** -0.136 0.445** -0.061 0.343* 0.113 0.090 -0.210 1 Teach. Staff 0.175 0.261 -0.043 0.002 -0.220 -0.174 -0.101 0.065 0.022 1 Colleges -0.504** -0.239 0.010 0.004 0.069 -0.092 -0.135 -0.285* 0.433** 0.066 1 Overn. Stays -0.293* 0.122 0.241 0.224 0.560** 0.388** 0.331* -0.068 0.262 -0.180 -0.014
**. Correlation significant at the 0.01 level. *. Correlation significant at the 0.05 level.
The most important fact visible in the above table is that some of the nightlife variables seem to be significantly correlated with each other. Although, bivariate
21 correlation does not adequately assess the topic of multicollinearity, it provides us with evidence that this might be a possible problem. In order to tackle the lurking problem of multicollinearity, factor analysis is used. That way, variables that are correlated can be “bundled” together and their impact be tested in a more efficient way.
4.5 The New Explanatory Variables
Using factor analysis, collinear variables are allowed to cluster together, so as their effect as a new more compound variable becomes more clear and traceable. That way, four final independent variables were created. Variables that score 0.5 and above are contained in the new variables.
It should be noted here that although there is no consensus on what should be a safe sample to perform factor analysis, there are two categories of recommendations in terms of minimum sample size: sample size and subjects-to-variables (STV) ratio. Henson and Roberts (2006), by reviewing 60 factor analyses from 4 journals reported that the minimum sample size was 42 and the minimum STV ratio 3.25:1. In the present paper the sample size is 51 and the STV ratio is 4.63.
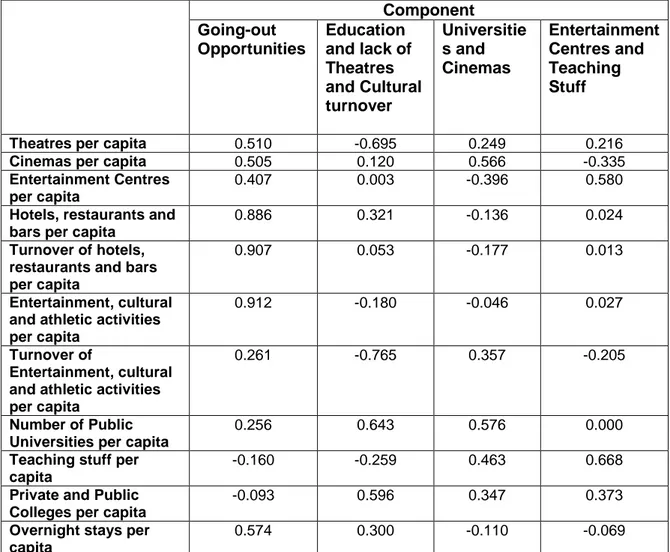
Table 6 below depicts the new variables that come out from the factor analysis. Table 6: Component Matrix
Component Going-out Opportunities Education and lack of Theatres and Cultural turnover Universitie s and Cinemas Entertainment Centres and Teaching Stuff
Theatres per capita 0.510 -0.695 0.249 0.216
Cinemas per capita 0.505 0.120 0.566 -0.335
Entertainment Centres per capita
0.407 0.003 -0.396 0.580
Hotels, restaurants and bars per capita
0.886 0.321 -0.136 0.024
Turnover of hotels, restaurants and bars per capita
0.907 0.053 -0.177 0.013
Entertainment, cultural and athletic activities per capita
0.912 -0.180 -0.046 0.027
Turnover of
Entertainment, cultural and athletic activities per capita
0.261 -0.765 0.357 -0.205
Number of Public Universities per capita
0.256 0.643 0.576 0.000
Teaching stuff per capita
-0.160 -0.259 0.463 0.668
Private and Public Colleges per capita
-0.093 0.596 0.347 0.373
Overnight stays per capita
22
Going-out Opportunities
The first variable contains the effects of theatres, cinemas, hotels, bars, and restaurants, their turnover, entertainment, cultural and athletic activities and finally overnight stays. It embodies 5 of the 7 nightlife variables, plus tourism, and is, thus, the most efficient of the 4 factors to measure the effect of nightlife provision. Since it comprises of the majority of nightlife variables, it is called Going-out Opportunities. Education and lack of Theatres and Cultural turnover
The second one contains 2 out of the 3 educational variables and the negative effects of theatres and turnover of entertainment, cultural and athletic activities. It is, thus, named Education and lack of Theatres and Cultural turnover.
Universities and Cinemas
The third variable comprises of two others, namely Number of public universities and Cinemas per capita, so it will be henceforth called Universities and Cinemas.
Entertainment Centres and Teaching Stuff
Last but not least, Entertainment centres and public universities‟ teaching stuff per capita are contained in the fourth, which is arguably called Entertainment Centres and Teaching Stuff.
4.6 The model
In order to model the way the four compound variables affect talent (human capital and creative class) concentration and then, how these concentrations influence regional income, Structural Equation Modelling (SEM) will be used. With SEM, two regressions are simultaneously run and tested. That way, we can separately test for nightlife‟s impact on talent concentration, talent‟s effect on regional income and the direct effect of nightlife on regional income.
23 Figure 2: Generic Model
Two variations, one testing for human capital and the other for creative class, will be created. In order to control for the effect of regional size, the regional population variable will be also used. Thus, four variations of the same model will be used: two for human capital and two for creative class, controlling for regional size.
The equations estimated at the generic model are:
Talent = (Going-out opportunities) + Education and lack of Theatres and Cultural turnover) + Universities and Cinemas) + (Entertainment Centres and Teaching Stuff) + (Regional Population) + (1) Regional Income = (Going-out opportunities) + (Education and lack of Theatres and Cultural turnover) + (Universities and Cinemas) + (Entertainment Centres and Teaching Stuff) + (Regional Population) + (Talent) + (2)
24
5. Findings
5.1 Model Results
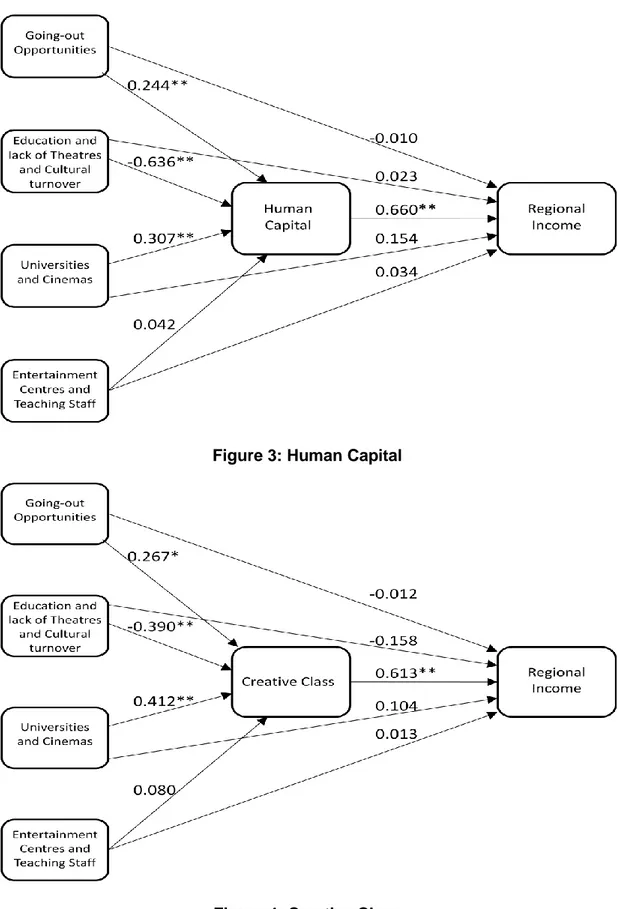
The results from the first two models, testing for human capital and creative class respectively, are depicted in Figure 3 and 4 below. The values are standardized.
Figure 3: Human Capital
25 Table 7: SEM results, unstandardized values
Human Capital Regional Income Creative Class Regional Income Going-out Opportunities 0.592** 0 1.021* -0.001 Education and lack of Theatres and Cultural turnover -1.542** 0.005 -1.492** -0.014 Universities and Cinemas 0.744** 0.015 1.575** 0.010 Entertainment Centres and Teaching staff 0.102 0.102 0.306 0.002 Human Capital 0.028** Creative Class 0.016** Observations 51 51 51 51 0.561 0.477 0.400 0.510
**. Correlation significant at the 0.01 level. *. Correlation significant at the 0.05 level.
Looking at Table 7 results, we can see that for human capital we get an of 0.561, while for creative class 0.400. Thus, human capital concentration is more efficiently explained by the model than creative class. There are probably other factors influencing creative class concentration that are not captured by the model, such as life quality demands (open spaces, proximity to work), industry structures, labour market possibilities, outdoor recreation possibilities, tolerance and diversity etc.
The for regional income is 0.477 for the case where human capital is included and 0.510 for when creative class is included. That indicates that creative class is a stronger explanatory variable than human capital in order to explain regional income. Two out of four variables are significant at the 0.01 level in both models, Going-out opportunities is significant at a 0.01 level in the first and at a 0.05 level in the second model, while Entertainment Centres and Teaching Staff is insignificant in both. This is an important conclusion for regional planning. Although entertainment centres have been quite prevalent during the past 30 years in Greece, it seems that they do not contribute to either human capital or creative class concentrations or regional income. This finding comes in contrast with what might have been intuitively expected. Judging by their popularity, it seems that there is a different part of the population that chooses these premises for its entertainment, one that does not effect regional income.
Going-out opportunities and Universities and Cinemas are positively significant for both human capital and the creative class. Going-out opportunities –with
unstandardized coefficients of 0.592 and 1.021 for human capital and creative class respectively- and Universities and Cinemas –with 0.744 and 1.575 for human capital and creative class respectively-are proving to be significant predictors of talent
concentrations, which supports the theory presented at the first part of this paper. An array of nightlife choices proves to be an important factor for urban allocation, while
26 Number of public universities holds, as in previous research (Florida, Mellander & Stolarick, 2008; Glaeser & Saiz, 2003), its prevalence as a human capital attraction tool. At this point it should be mentioned that higher education is and has been a state monopoly, apart from some technical specialities.
Education and lack of Theatres and Cultural turnover – unstandardized coefficients of -1.452 and -1.492 for human capital and creative class respectively-, on the other hand, are negative and significant. The findings show that there is a significant relation between places that have low levels of cultural turnover and number of theatres and low levels of human capital. The lower cultural turnover and the fewer theatre premises a region exhibits, the lower levels of human capital it will possess. Also, the compound effect of two educational variables, Number of public universities per capita and Private and public colleges per capita, prove to be negative and significant, providing evidence of a negative relation between private and public colleges per capita and talent.
Finally, both human capital, with an unstandardized coefficient of 0.028 and creative class, with 0.016, are significant for regional income, human capital being slightly stronger. This finding is interesting when compared to the opposite results provided by the correlations, where creative class proved to be slightly stronger than human capital. It seems that, when controlling for other variables, the creative class loses a part of its explanatory strength. The effect of the rest of the variables on regional income is not significant, implying that they affect regional income in an indirect way. It is through their salience as human attraction mechanisms that they contribute to regional growth, rendering their effect invisible at a first glance. Nevertheless, exactly as Higher Education is already considered a regional growth tool, so should be nightlife provision, at least in the Greek context.
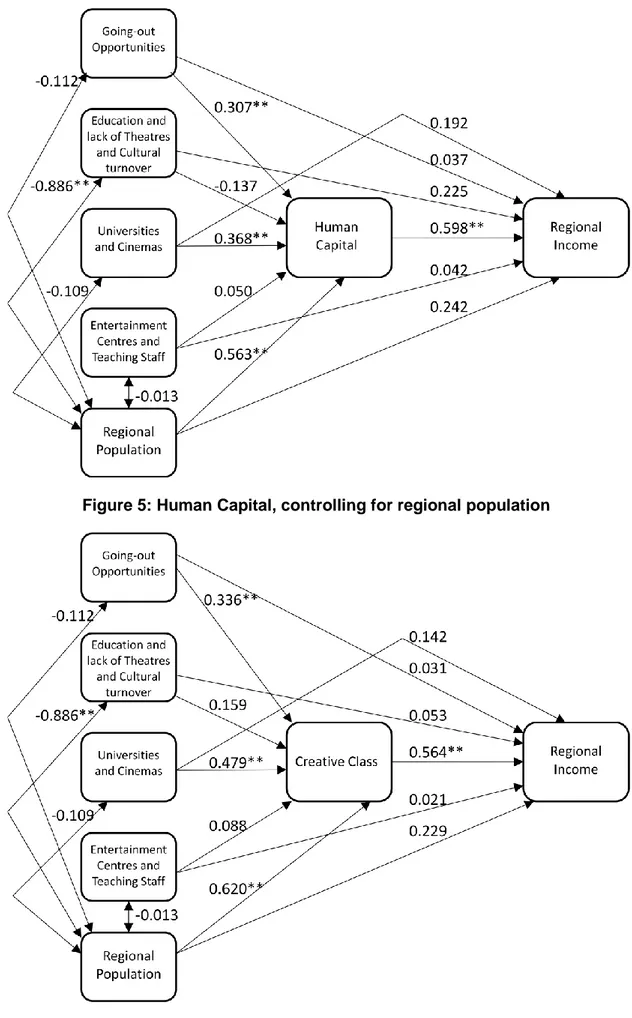
5.2 Controlling for regional population
Regional population can be an approximate estimate of market size, which
respectively affects amenities provision. In order to control for the effect of regional size, the regional population variable will be added to models three and four. The results from these two models, testing for human capital and creative class respectively, while controlling for regional population are depicted at Figures 5 and 6 below. The coefficients are again standardized:
27 Figure 5: Human Capital, controlling for regional population
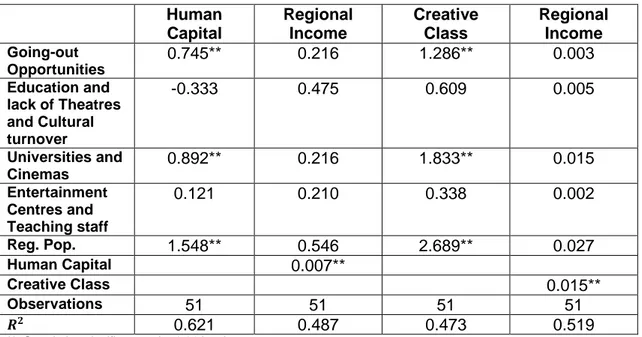
28 Table 8: SEM Results, regional population added, unstandardized values
Human Capital Regional Income Creative Class Regional Income Going-out Opportunities 0.745** 0.216 1.286** 0.003 Education and lack of Theatres and Cultural turnover -0.333 0.475 0.609 0.005 Universities and Cinemas 0.892** 0.216 1.833** 0.015 Entertainment Centres and Teaching staff 0.121 0.210 0.338 0.002 Reg. Pop. 1.548** 0.546 2.689** 0.027 Human Capital 0.007** Creative Class 0.015** Observations 51 51 51 51 0.621 0.487 0.473 0.519
**. Correlation significant at the 0.01 level. *. Correlation significant at the 0.05 level.
When the population control variable is added to the model, some interesting changes take place. First, we can see from Table 8 that the for both talent
measures increases, indicating that regional size is an important predictor for human capital concentrations. This can be also viewed by its direct, significant effect on human capital and creative class. At that point, it is interesting to see the top-10 creative and human capital prefectures in Greece, in relation to regional population at table 9 below.
Table 9: Top-10 Creative Prefectures
Prefectures Creative Class Population Rank
1. Attiki (Athens) 32.74 1 2. Thessaloniki 31.64 2 3. Hios 29.21 43 4. Ioannina 27.75 14 5. Lefkada 26.60 50 6. Ahaia 26.14 3 7. Kozani 25.33 15 8. Trikala 25.04 22 9. Magnesia 24.72 8 10. Kavala 24.22 21