Size and Performance of Swedish
Mutual Funds
Paper within: Master Thesis in Finance
Authors: Tom Johansson
Mattias Jacobsson
Tutors: Per-Olof Bjuggren
Louise Nordström
Master thesis in Finance
Title: Size and Performance of Swedish Mutual Funds: Does Size Matter? Authors: Tom Johansson & Mattias Jacobsson
Tutors: Per-Olof Bjuggren, Louise Nordström & Johan P. Larsson
Date: 2012-05-15
Key Words: Fund size, performance, persistence, management fees
Abstract
In this thesis we have studied the relationship between mutual fund size and performance by studying 91 Swedish mutual funds during a six year period (2006-2011). Furthermore, we investigated the relationship between fund size and management fees and fund size and persistence in performance. The fund sample has been divided into five subgroups in order to compare and analyze funds with different fund sizes for the whole six-year period as well as two three-year sub periods. Our results are based on regressions and significance tests and for all the five subgroups and over the whole time period our results indicate that there is no significant relationship between fund size and fund performance that is robust over time. Our findings also show that there is no persistence in performance for any of the size-based fund groups which helps us to draw the conclusion that past performance is not a good measure for predicting future performance regardless of the size of the funds. The results also indicate that mutual funds with a larger asset base tend to have lower management fees than smaller funds.
Acknowledgements
We would like to thank Morningstar for their contribution of financial data, which made it possible for us to conduct this thesis. We would also like to thank our tutors Johan P. Larsson, Per-Olof Bjuggren and Louise Nordström for their input and feedback during the process of developing this thesis.
Finally, we would also like to thank the other students in our seminar group for their valuable feedback during our meetings.
Jönköping International Business School May 2012
Table of Contents
Abstract ... i
Acknowledgements ... ii
1
Introduction ... 1
1.1 Background ... 2 1.2 Purpose ... 32
Theoretical Framework ... 4
2.1 Size and performance ... 4
2.2 Definition of mutual fund size ... 6
2.3 Definition of mutual fund performance ... 6
2.4 Different fund markets ... 7
2.5 Performance Persistence ... 8
2.6 Management fees ... 9
3
Method ... 10
3.1 Research design... 10
3.2 Collection of data ... 10
3.3 Dividing the data set ... 12
3.4 Survivorship bias ... 12
3.5 Selection of funds ... 13
3.6 Selection of index ... 14
3.7 Reliability ... 15
3.8 Fund size impact on performance ... 15
3.9 Performance persistence ... 17
3.10 Management fees ... 18
4
Results and Analysis ... 20
4.1 Fund size and performance ... 20
4.2 Performance persistence ... 27
4.3 Management fees ... 29
5
Conclusion ... 30
6
Suggestion for further research ... 32
References ... 33
Appendix ... 37
6.1 Appendix 1- Fund size and performance ... 37
6.2 Appendix 2 – Performance persistence ... 39
6.3 Appendix 3 – Management fees ... 41
Introduction
1 Introduction
Before investing in a mutual fund, is it lucrative to consider not only past returns and future prospects but also the asset size of the fund? In other words, is the relationship between mutual fund size and mutual fund performance significant? It is widely known that high performing funds grow in a rapid pace, since investors tend to react to positive earlier performance. But can the fund continue to deliver favorable returns as it grows larger?
In this thesis we want to investigate if there is a relationship between the size of mutual funds and the performance of the funds on the Swedish mutual fund market. There are certain fund specific attributes that are affected when mutual funds grow larger. These attributes are for instance management fees, performance and persistence in performance. The question and our main objective in this thesis is to see if there is a positive effect, a negative effect or any effect at all on these attributes as a fund grows larger.
A range of research papers have been conducted within this area, although without reaching any clear consensus about what the relationship looks like. On the one hand, Ciccotello and Grant (1996) suggest to individual investors that smaller funds tend to outperform larger funds regarding aggressive growth funds and long-term growth funds. On the other hand Otten and Bams (2002) argue that larger funds tend to outperform smaller funds. Droms and Walker (1994) and Dahlquist, Engström, and Söderlind (2000) find that no significant relationship between size and performance exists of international and Swedish mutual funds respectively. Numerous sophisticated academic articles written, and numerous contradictive results presented give an incentive to dig deeper into the subject.
With a Swedish market approach and up-to-date data, this research can potentially accept findings of Dahlquist et al. (2000) regarding regular equity funds which will give a clear incentive to disregard fund size before investing money into a fund or it can also find contradictive data results which suggests that the relationship between fund size and fund performance is vital to regard before making an investment.
By considering Swedish-based equity funds which invest mainly in Sweden, we contribute to a relatively unexplored area of research. Furthermore, as stated above this thesis emphasizes the importance of size and other relevant factors that are directly linked to size such as management fees and persistence in performance. Our research also adds to previous research by giving individual investors an insight to the importance of regarding size and other fund-specific attributes before investing money into a mutual fund.
The thesis proceeds as follows: Section II includes theoretical framework where theories and previous findings within the area of research are presented. Section III includes a method description. Section IV presents results and findings. Section V includes conclusion and summarizes findings of the paper.
Introduction
1.1 Background
Mutual funds have become popular for people to invest in and the aggregate amount of capital invested in mutual funds in Sweden alone is today about 5000 times as much as it was in the 1970’s (Sparekonomen.se, 2012). There are advantages with mutual funds such as the possibility of diversification and that they are managed by professional fund managers, but on the downside they are also subject to fees in order to compensate the fund managers for their work with managing the fund. Today about 98% of the Swedish population between 18 and 74 have money invested in mutual funds hence research about mutual funds interest a large part of the public. (Swedish investment fund association, 2009)
The popularity of investing in mutual funds attracts a great deal of media attention and the discussion whether it is worth investing in mutual funds compared to other means of saving is constantly brought up by the media. The vast coverage in newspapers, magazines and rating websites such as Morningstar indicates the great importance of trying to discover and predict successful performance.
Investors always search for the best investment options available and since there are many factors affecting performance it is difficult to predict future performance of funds. One of those factors is how size of funds affects the performance. Should individual investors in general invest in larger or smaller mutual funds in order to obtain higher returns? Or is there incentive to believe that investors do not have to regard fund size before investing on the Swedish mutual fund market?
Previous research has been conducted within this subject and the results and conclusions are varied and suggests that there is no clear evidence showing if performance is affected positively or negatively by the size of mutual funds, it should also be said that most research within this area is conducted on the American market whereas other markets are less explored (e.g. the Swedish market).
As stated above most previously conducted research papers within this area examine the US mutual fund market, whereas research with a Swedish fund market approach is rare. However, Dahlquist et al. (2000) present data from 124 Swedish-based equity funds over a 5 year period in an attempt to evaluate the relationship between performance and fund-specific attributes such as management fees, trading activities and size. Their findings for special funds (tax-benefited equity funds) are in accordance with the findings of Ciccotello and Grant (1996) for performance of aggressive growth funds and long-term growth funds and suggest that smaller equity funds tend to perform better than larger equity funds. Interestingly though, is that these findings are based on data which is older than the data Otten and Bams (2002) use in their research on equity funds which presents results that are contradictive from the findings of Dahlquist et al. (2000) and Ciccotello and Grant (1996). However, Dahlquist et al. (2000) also test for a potential relationship between fund size and regular equity funds. Their findings for these funds are in accordance with the findings of
Introduction
Droms and Walker (1994), namely no significant relationship exists between fund size and performance.
A successful mutual fund will attract more capital and grow into a larger fund because it is easier to promote the fund after a time of success whereas less successful funds do not get the same media attention and hence they stay small in size. This growth in size could have an impact on the future performance and the returns of funds (Ciccotello & Grant, 1996). Obviously new investors do not receive any of the past returns although investors seem to believe that historical returns affect future performance. The reason for a fund to be successful in the future based on past success is the idea that there is persistence in performance. Grinblatt and Titman (1992) argue that there is a positive persistence in performance on the American fund market and Capon, Fitzsimons and Prince (1995) draw the conclusion, based on their own survey about individual investors, that recent performance of mutual funds is essential for investors when selecting their investments. Mutual funds have operating costs such as management fees and other administrative expenses. If a mutual fund doubles in size it does not mean that the operating costs will double as well. If this is true the average cost for managing an investor’s account would decrease as the total fund size increases which is also known as economies of scale. This possibility to spread the costs and expenses is one of the advantages that large funds have compared to small funds. (Latzko, 1999) These advantages should be enough for large funds to perform better than small funds but there are not just advantages, there are also some challenges that managers of large funds have to face. According to Ciccotello and Grant (1996) large mutual funds reduce the ability to make quick moves on the market and go in or out of positions without catching attention. As the fund grows it becomes a proxy of the market which further impedes the possibility of beating the market.
1.2 Purpose
The purpose with this thesis is to analyze and investigate the performance of Swedish-based mutual funds that invest solely on the Swedish market, focusing mainly on the relationship between fund size and fund performance. Secondly this paper aims to examine and raise understanding about how fund size affects fund-specific attributes such as, management fees and persistence in performance.
Theoretical Framework
2 Theoretical Framework
In this section previous studies will be presented along with their results and findings on the relationship between size and performance. We will also review the impact from economies of scale, management fees and performance persistence. In section 2.1 previous studies about the relationship between size and performance will be presented. In section 2.2-2.4 we will present definitions of fund size, fund performance and information about Swedish mutual funds. In section 2.5 we will present previous studies on performance persistence in mutual fund returns. In section 2.6 management fees will be presented along with previous studies.
2.1 Size and performance
Various studies about the relationship between size and performance in mutual funds have been done but the results vary and different scholars arrive at different conclusions on how this relationship looks like. Some studies such as Ciccotello and Grant (1996); Chen, Hong, Huang and Kubik (2002) and Chen, Hong, Huang and Kubik (2004) argue that smaller funds perform better than larger funds on the American market because they can easily go in or out of positions without affecting the market price or attracting too much attention. Other studies suggest that larger funds display better performance due to different advantages that small funds do not display, such as the ability to spread expenses over a wider asset base. In this thesis we use a similar approach to define large and small funds as Ciccotello and Grant (1996), Indro, Jiang, Hu & Lee (1999) and Gorman (1991) where the fund sample is divided into subgroups. In this thesis we define large funds as funds with total assets larger than 5 billion SEK and small funds as funds with total assets smaller than 200 million SEK.
Some scholars argue that there is a negative relationship between the size of a mutual fund and its performance. Ciccotello and Grant (1996) find that large mutual funds have better historical returns for aggressive growth funds on the American market and that historical returns are the reason for them to be large. However they do not find a relationship between size and performance for growth and income funds. They test the fund data over both a five year period and a ten year period and in their research they divide the funds into three different categories to see if there is any difference in the relationship between size and performance for different categories of funds. They find that there are differences between the historical returns of small and large mutual funds especially in the ten-year time period. These long term superior returns make it easier to advertise the fund to attract new capital which will help the fund grow and become a large fund. They suggest that smaller funds tend to outperform large funds especially for the aggressive growth funds. However, they find no significant relationship for growth and income funds.
The different conclusions about the relationship between size and performance make it difficult for investors to know if a small or a large fund is the best investment objective, or if the size of the fund does not matter. Ciccotello and Grant (1996) argue that based on
Theoretical Framework
previous studies it is difficult to predict the future performance of mutual funds solely based on the size of the fund. It is more likely that there are a number of parameters that have to be taken into consideration, where size is one of them. They say that large funds are large for a reason. A well-performing fund will attract attention to itself and it will be easier marketing a successful fund. This will attract new investors and the fund will grow and eventually become a large fund with a large asset base. Past performance is an essential factor for investors when choosing what funds to invest in.
Droms and Walker (1994) analyzed international mutual funds where one of the parameters tested was size and how this affected performance, their findings suggest that there is no relationship between size of mutual funds and how well they perform. Chen et al. (2004) found that fund size matters and that there is a negative relationship between size and performance with the explanation that large funds have more expensive administration expenses and also because larger funds are more liquid than smaller funds, where a liquid fund is subject to larger trading costs.
Dahlquist et al. (2000) account for tax advantages, survivorship bias and management fees and they find a mixed result. Their study was conducted using Swedish-based mutual funds that could be purchased on the Swedish fund market. They find that there are different results for different categories of funds but for special funds they find that smaller mutual funds have a better performance than larger sized funds. They also argue that actively managed funds tend to perform better than passively managed funds. However, for regular equity funds they find no significant relationship between fund size and fund performance. In their study they were able to use all mutual funds available on the Swedish market and by doing so they could achieve a more accurate result and also avoid having a biased result. Most studies about mutual funds are conducted with American-based mutual funds. There are some interesting studies done on other markets as well, for example Otten and Bams (2002) conducted a study based on mutual funds from the five most important mutual fund countries in Europe during an eight year period. They say that the American market is ahead of the European market in importance and the average fund size is much larger in the US than in Europe. Contrary to some studies made on the American market they find different results such as a positive relationship between fund performance and size. They argue that it could be an advantage for the European funds to be on a smaller market and due to that create opportunities to improve their performance. Chan, Faff, Gallagher and Looi (2009) also found that large funds have better results than smaller funds in their study on Australian mutual funds.
In a study on the Chinese market by Tang, Wang and Xu (2010) another result was found. They focus on the impact from economies of scale and liquidity on the relationship between size and performance. The result of their study is that the relationship between size and performance follows an inverted U-shaped curve. This is explained with that smaller funds are more sensitive to the economies of scale and less sensitive to the liquidity factor and that it is the opposite for large funds. This combination creates the inverted
U-Theoretical Framework
and performance where national differences seem to be smaller than the international differences.
2.2 Definition of mutual fund size
It is important to define some concepts when performing a study about fund size and fund performance and in this case it is axiomatic to define mutual fund size and mutual fund performance. A mutual fund can be described as a portfolio that pools money from many individuals in order to be able to provide a good diversification. The size of a mutual fund is often measured as the total net asset value (TNA) of the portfolio. Dahlquist et al. (2000) use the TNA in their study about the relationship of mutual fund performance and other mutual fund specific attributes. Gorman (1991) also uses the TNA in her study of mutual fund size. She divided her funds in to quartiles then chose the top and bottom quartiles which contained the largest funds and the smallest funds. They were based on the dollar value of the total asset value in each fund portfolio.
Dahlquist et al. (2000), Indro, Jiang, Hu and Lee (1999) and Chen et al. (2002) suggest that mutual fund size is measured by taking the natural logarithm of the total net asset value. Chen et al. (2002) also use the TNA to measure size. The funds are divided into groups of large and small mutual funds.
The definition from the Morningstar website is that fund size is the net asset value of the mutual fund at the end of each month, where net assets are the total assets of a mutual fund net of fees and other expenses (Morningstar, 2012). Gorman (1991) and Dahlquist et al. (2000) define fund size like Morningstar and we will also use the TNA as a measure of mutual fund size. Furthermore, we will use quarterly data with TNA from each quarter for each year in the sample period. We will also assume that all new investments are done in the beginning of each quarter which means that the net flows of money are done in the beginning of each period; according to Dahlquist et al. (2000) this makes it possible to compute changes in fund size between different periods.
2.3 Definition of mutual fund performance
Early research such as Jensen (1968) and Sharpe (1966) used the capital asset pricing model to evaluate mutual fund performance and calculate risk-adjusted performance and compare it to a market portfolio. Different funds do not have the same amount of risk and therefore we need to adjust the risk-and-return relationship for different mutual funds.
The Sharpe ratio is a good measure to compute the risk-adjusted performance that makes it possible to compare funds with different levels of risk. The Sharpe ratio is the risk premium divided by the standard deviation which is the amount of return per unit of risk. A greater value of the Sharpe ratio means that the security has a better risk-adjusted performance (Sharpe, 1966).
Theoretical Framework
(1)
Where Rit is the actual return at time t, Rft is the risk free rate at time t and σ is the standard
deviation. The risk free rate that we use will be obtained from the Swedish five-year Treasury bond interest rates. The historical values are published on the website of the Swedish national debt office, Riksgälden.
According to Jensen (1968) the performance of mutual funds consists of the ability the fund manager has to increase the return but also the ability to diversify in a good way in order to decrease the risk. Grinblatt and Titman (1989) discuss the importance of taking transaction costs and other expenses into account when looking at performance. Another thing that we will take into consideration is that the data can be subject to survivorship bias.
In this thesis we define performance as the average return over the benchmark index which in our case meant the SIX Portfolio Index. This was done to better show the performance in the light of the performance of the whole market and not just the performance in relation to the risk free rate. Our definition of performance as excess return goes in line with the calculations of both Berk and Green (2004) and Heaney (2008), who also use the average return over a suitable benchmark index instead of the risk free rate. Furthermore, we will use the Sharpe ratio as our definition of risk-adjusted performance.
2.4 Different fund markets
The American market is older and larger than the European market and most research has been conducted based on American mutual funds. There are differences in for example legislation between the different markets and the American market is more developed than the European according to Otten and Bams (2002). They also describe a lag in size and importance of the market between the European markets and the American market. Studies about mutual funds in Europe are comparable due to the common laws and rules set by the European Union and we will be able to compare our results with other studies on the Swedish market or the European market.
The Swedish laws on the mutual fund market are based on the UCITS directive (Undertakings for Collective Investment in Transferable Securities). One of the intentions with the European Union based laws is to make it easier to compare mutual funds throughout Europe but it is also made to simplify the advertisement of national funds in other countries within the European Union (Swedish investment fund association, 2012a).
Theoretical Framework
2.5 Performance Persistence
Additionally we will see if mutual funds can outperform the market and it is interesting to investigate if they can keep outperforming the market in a few succeeding time periods. The concept of outperforming the market in consecutive time periods is called performance persistence. Positive performance persistence is when the fund manager can perform better than the market and the opposite is called negative performance persistence. The efficient market hypothesis suggests that it should be almost impossible to beat the market and certainly not in a few consecutive periods, however, for example Bodie, Kane and Marcus (2011) suggest that markets in general are efficient meaning that there is still room for fund managers to actually outperform the market. The past performance of mutual funds is essential for fund investors investing in new mutual funds (Ciccotello & Grant, 1996), but does it have any effect on future performance?
Sharpe (1966) describes that there is persistence in performance by measuring the difference in performance from one period to another. He shows that there was a one-period persistence in performance but added that historical performance still was not the best way of predicting future performance. Another of the earlier studies was done by Treynor (1966) and his findings do not show any persistence in performance.
Hendricks, Patel and Zeckhauser (1993) made a study about performance persistence and found something called hot hands, which is the fact that fund managers can perform better than the market index and continually do so for several time periods. However this phenomenon can only last in the short run and they also found that there is sometimes negative persistence in performance. They found that these funds usually have more negative performance than the amount of positive performance of the funds with positive performance persistence. Other studies also found that performance persistence actually exists, such as Grinblatt and Titman (1992), Otten and Bams (2002) and Elton, Gruber and Blake (1995). Carhart (1997) uses a Fama-French four factor model to explain the persistence in performance and he finds positive performance persistence from his study. Dahlquist et al. (2000) find a mixed result where most categories of funds do not show any sign of persistence in performance, most importantly they find no persistence in performance for regular equity funds which are the same type of funds that we are examining. Most studies about performance persistence are made on the American market and they argue that there are differences between well developed markets compared to smaller less evolved market such as the Swedish.
Theoretical Framework
2.6 Management fees
A study made on the Australian market by Heaney (2008) about the fund size effects on the fund return concluded that there is no impact on returns from fund size. He divided the data set into five subgroups by size for each month for the period 1995 to 2005 and the inference of the study is that there is no statistically significant evidence that any of the size-based groups would outperform the others. Berk and Green (2004) and Heaney (2008) both write about the effects management fees have on the growth of mutual funds. The inference is that funds with higher management fees will attract less cash and therefore the funds with lower fees will grow into the largest funds. Grinblatt and Titman (1989) found that small funds have larger transaction costs than large funds. Even though small funds have advantages that large funds do not have the higher fees will decrease performance for small funds.
Method
3 Method
In this section we describe and motivate the method used in order to conduct the research and we also define key parameters of interest, such as mutual fund size and performance. In section 3.1-3.7 we describe our approach to the research, how we collect data, how we divide the data set, our approach to survivorship bias, the selection of funds and suitable benchmark index and we also discuss the reliability of the thesis. In the proceeding sections 3.8-3.10 we describe in more depth our approach to investigating the main research questions of this thesis.
3.1 Research design
No clear consensus has been agreed upon among scholars within this field of research even though numerous studies have been conducted, our thesis will therefore be a descriptive research. A descriptive study aims to portray a precise profile of situations or events (Saunders, Lewis & Thornhill, 2007). In this case we gather mutual fund data, in order to portray the outcome of interest and give new accurate conclusions. The overall hypothesis in this thesis is that mutual fund performance is related to size, and since we have a clear hypothesis our approach to research will be deductive. According to Robson (2002) a deductive research approach starts with a clear hypothesis which involves a testable relationship between at least two variables and ends with a possible modification of the stated theory or acceptance of the hypothesis (cited in Saunders et al. 2007). The primary variable of interest is as mentioned before size, but also performance, persistence in performance and management fees. Having a deductive approach in this thesis meant on the one hand reviewing theories and findings of others in order to clearly identify problems and get an in depth introduction to the research area, and on the other hand it also meant collection of quantitative data with significant sample size.
3.2 Collection of data
We used a quantitative data collection technique since we believe that it is most suitable for the intentions of this thesis. Any data analysis procedure that uses or generates numerical data is referred to as a quantitative collection technique, whereas any data analysis procedure that uses or generates non-numerical data is referred to as a qualitative collection technique according to Saunders et al. (2007). We considered using a multi-method research approach, including more than one data collection technique but still focusing solely on having a quantitative approach to the research. However, in our opinion adding more collection techniques such as interviews with for example fund managers would only add value to the research if we dealt with parameters like for instance personal preferences of fund size or risk management within funds, which is not the case in this thesis. Tashakkori and Teddlie (2003) argue that multiple methods only are useful if they provide
Method
you with a better opportunity to answer your research questions (cited in Saunders et al. 2007).
Secondary data provided by Morningstar will be the basis for the research in this thesis. The data contains information about 130 Swedish-based equity funds during a ten year period, from January 2002 to December 2011. These equity funds are categorized by the fact that their main investment objectives is in Swedish equities, which allows a more accurate selection of fund index and hence a more reliable comparison. Furthermore, the data contain information about inception dates, management fees, Morningstar ratings, standard deviation values, monthly returns and quarterly total net asset values. However, there is data about historical asset values and return missing for a lot of the funds for the first four years of that time period. Therefore, the study is conducted for a six year period and the original 130 funds are reduced. This will be described in the section 3.3 dividing the data set.
Our other source of secondary data was retrieved from Swedish Financial Supervisory Authority, Finansinspektionen (FI). This information is collected as a complement to the information provided by Morningstar. It only covers a nine year period from January 2003 to December 2011 and merely contains quarterly information about TNA and net asset value (NAV) of Swedish equity funds. It is all Swedish security funds1 that are being
published on the FI website, the first quarter in 2003 present information about 557 security funds and the last quarter in 2011 present information about 483 security funds, hence we are dealing with a large data set that does not invest exclusively in Swedish securities.
Information about Special funds2 is available through the FI website, where information
about monthly risk measurements of the funds is found. The data from FI is a complement to the Morningstar data but still vital for this thesis since it consistently contain quarterly data about fund size for all funds whereas Morningstar’s data fail to cover this information for all funds and all periods, especially funds size information between 2002-2005 is poorly presented.
The information from FI will be used to separate the equity funds and the special funds. The data provided by Morningstar does not show any distinction between the different funds. The data from FI gives us the ability to create a fund sample where the funds are more similar to each other and hence it will be more reliable when the results are analyzed.
1 There are two types of funds in Sweden, namely security funds and special funds. They are both referred to as investment funds. Security funds go in line with the Swedish law (2004:46) about investment funds and by doing so they also go in line with the so called UCITS directive founded by the European Union’s directive within the field of interest. (Swedbank, 2011)
2 Special funds are funds that have FI’s permission to deviate from the law about investment funds, one well known type of special funds are hedge funds. They have a greater freedom when it comes to investing than security funds, but they have to adapt to the principal of risk diversification. (Swedbank, 2011)
Method
3.3 Dividing the data set
In previous research it has been common to divide funds into different groups sorted by size. We will choose a similar approach to the ones that are chosen by Gorman (1991), Ciccotello and Grant (1996) and Indro et al. (1999) who all use the approach of sorting their funds by TNA and then dividing them into groups. This approach is of advantage because we can compare the largest funds with the smallest funds and test if there is a significant relationship between fund size and performance.
Indro et al. (1999) have a large data set of funds which they then divide into ten different groups with an equal amount of funds in each group. Gorman (1991) decided to set a monetary limit to divide the funds into small or large funds. Large funds were defined as the funds with a TNA larger than a certain dollar value and small funds were funds in the bottom quartile and they all had a TNA below a pre-set value.
We will rank the mutual funds in our data set by fund size and divide them into five different groups with a sufficient number of funds in each group in order to make the results more valid in a statistical point of view. In each size-based group of funds the excess return will be calculated not only for the whole six year period but also for two three year periods. This is done to see how the performance varies during different time periods and how they vary for different size groups of the data set.
3.4 Survivorship bias
If some funds are excluded from the sample due to bad performance or due to failing in another way the average return will be affected. Only the performance of long-term surviving funds will be reflected in the results (Bodie et al., 2011).
Survivorship bias can make results and findings skewed and misleading. Funds can seize to exist due to bad historical performance and if only funds with good historical returns are taken into consideration, there is a risk that historical performance will be overestimated. (Brown, Goetzmann, Ibbotson and Ross, 1992).
Brown et al. (1992) argue that historical performance can predict future performance when not being subject to survivorship bias. Capon, Fitzsimmons and Prince (1995) argue that historical performance is one of the most important factors for investors investing in new mutual funds. A research subject to survivorship bias would distort reality because cancelled funds are not included, which could lead to bad decisions for the investors. Dahlquist et al. (2000) eliminated the problem with survivorship bias by using all mutual funds that existed in their time period. Because they used all the data available they could see how large the survivorship bias would have been if they would have excluded the non-surviving funds. They argue that the different reasons for funds not to survive are that funds merge with other funds, change investment objective or basically cease to exist.
Method
The inception dates of some funds are later than December 2005 and some seize to exist before December 2011, even so we will still include them in our study in order to avoid survivorship bias.
3.5 Selection of funds
Different types of funds operate under different types of rules but we still chose to only include equity funds in our research, this is simply done in order to avoid biased results that could occur when comparing funds that operate under different types of regulations. Our research includes solely Swedish-based equity funds that invest in Swedish equities, denoting for equity funds are that they invest at least 75% of the TNA in equities (Swedish Financial Supervisory Authority, 2012a).
It is popular to invest in equity funds focusing on emerging markets as its primary investment objective; however the largest aggregate TNA is still found in equity funds that invest in Swedish equities (Swedish investment fund association, 2012b).
Each period the funds are divided into five different groups depending on how large their total assets are in that specific period. For the historical TNA there is quarterly data and for the historical returns there is monthly data where the TNA’s are shown in Swedish kronor (SEK) and the returns are shown in percent. Since we have quarterly data for the TNA we assume that the funds stay in the same group for each quarter similar to the approach of Dahlquist et al. (2000). This is done since we have monthly data of returns for the funds, and by making this assumption about TNA we will get more observations and a more valid result which is more reliable to analyze.
We have divided our groups in a similar way to how Gorman (1991), Ciccotello and Grant (1996) and Indro et al. (1999) divided their data set. The groups are divided from a monetary limit for the total net asset value of the funds. Group 1 has the largest funds and group 5 has the smallest. The delimitations for the groups are as follows:
In group 1 the TNA’s are above 5 billion SEK.
In group 2 the TNA’s are between 2 billion and 5 billion SEK. In group 3 the TNA’s are between 700 million and 2 billion SEK In group 4 the TNA’s are between 200 million and 700 million SEK In group 5 the TNA’s are below 200 million SEK
We have made some adjustments to the original data set because we want the funds to be of the same kind and on the same market to be able to get a more comparable result. The original 130 funds decreased into 91 funds after removing special funds from the data set, which was done with the help of the FI data. The fund sample consists exclusively of Swedish-based equity funds and that funds with less than four quarters of TNA and return observations were excluded.
Method
The data set contains TNA values for 25 quarters and returns for 73 months which corresponds to 1995 TNA observations and 5879 observations of return. Some funds had data missing for some periods either for TNA or returns and some had data missing because they had an inception date later than December 2005. In order to avoid biased results we do not exclude these funds as long as they have a sufficient amount of observations.
3.6 Selection of index
In the performance evaluation, we will not only compare the performance between the funds but also with a benchmark in the form of an index. There are numerous indexes available and it is important to find an index that goes in line with the characteristics of the selected data in order to give the comparison value. The selection of index depend on the funds’ investment objectives, since our study involve Swedish-based equity funds investing mainly in Swedish equities it is appropriate to choose an index which is linked to the Swedish equity market.
We have chosen to work with the SIX Portfolio Index (SIXPX), this index main purpose is to reflect the development of companies listed on the Stockholm Stock Exchange. The major and most important reason for us to include the SIXPX is simply because it follows the rules and regulations stated in the UCITS by the European Union (Swedish investment fund association, 2012c). In other words this index obeys the same rules as the equity funds in our study and hence should work as an accurate benchmark which reflects the development on the Swedish equity market.
FIGURE 1- Development of SIXPX & risk free rate
This figure illustrates the percentage development of the SIXPX and the risk free rate between December 2005 and December 2011. The graph is based on data from Swedish investment fund association, (2012d).
- 20,00 - 15,00 - 10,00 - 5,00 0,00 5,00 10,00 15,00 20,00 25,00 2 -17 -2005 12 -14 -2005 10 -10 -2006 8 -6 -2007 6 -1 -2008 3 -28 -2009 1 -22 -2010 11 -18 -2010 9 -14 -2011 7 -10 -2012
Development of SIXPX & risk free rate
SIXPX RF
Method
3.7 Reliability
Secondary data from Morningstar and the Swedish Financial Supervisory Authority (FI) is included in this study. FI is a public authority which monitors and supervises companies in the financial market, they serve to promote efficiency and stability in the financial system and there is no reason to doubt the trustworthiness of this source. Furthermore there is no reason to question the reliability of Morningstar either, firstly since they are the world’s largest provider of financial data and is frequently used as a source by investors and scholars and secondly since they are under supervision by FI due to the fact that companies offering financial services in Sweden need permits issued by FI (Swedish Financial Supervisory Authority, 2012b).
We only consider published articles which imply that they have been controlled and hence give this study high reliability.
3.8 Fund size impact on performance
To investigate the impact of fund size on performance we chose an approach similar as Grinblatt and Titman (1989), Gorman (1991), Ciccotello and Grant (1996), Indro et al. (1999) and Heaney (2008). First of the funds were divided into five subgroups according to total net asset values, this was done in order to ease the investigation of the impact fund size has on performance. Average return was calculated monthly for the five subgroups over the whole period of interest, which enabled us to compare performance between the groups and over time. In equation 2 represent the average monthly excess return for
group i at time t, represent the average monthly return for group i at time t and
represent the average monthly SIX Portfolio Index at time t.
(2)
For the period 2006 to 2008, 2009 to 2011, and 2006 to 2011 we present accumulated excess return, standard deviation of excess return and average Sharpe ratio for the five groups. These financial analysis tools enable us to draw reasonable conclusions and see how and if the different groups differ from each other in terms of performance and degree of risk involvement during different periods in time. Furthermore, we will test if there is a relationship between performance and the different groups of funds using a two-tailed test. This is done in order to test the level of significance as to if average monthly excess return differs between the groups over the two sub periods separately and also over the whole sample period, these results are presented in table 1. We chose to use a two-tailed test because it was difficult for us to predict if small or large funds would be the best if there would be a significant result from the test. Small funds have certain advantages that large funds do not have such as the possibility to move in and out of positions and large funds have advantages such as the ability to spread expenses over a larger asset base. With a two-tailed test it is possible to first see if there is a significant difference and secondly examine
Method
throughout this thesis is excess return, we will also include one more two-tailed test which aims to test the level of significance as to if average monthly risk-adjusted return differs between the fund groups. The risk-adjusted return in this case will be represented by an average Sharpe ratio of excess return for each group separately and for each month separately in the sample period. The most recent study to our knowledge conducted on the Swedish market by Dahlquist et al. (2000) find no significant relationship between size of mutual funds and performance. Hence, we do not expect to find a relationship between size and performance for Swedish mutual funds which is reflected in hypothesis 1.
Hypothesis 1
There is no relationship between size of Swedish mutual funds and performance There is a relationship between size of Swedish mutual funds and performance
If we find a significantly low p-value we will reject the null hypothesis, either on a 10 %, 5 % or 1 % significance level. If we reject the null hypothesis on a 10 % significance level we can assume that a relationship exists, however the probability of a sampling error within the test is 10 % and thus we cannot rely strongly on the result. First at a 5 % and preferable 1 % significance level we can assume that a strong relationship exists (Aczel & Sounderpandian, 2009).
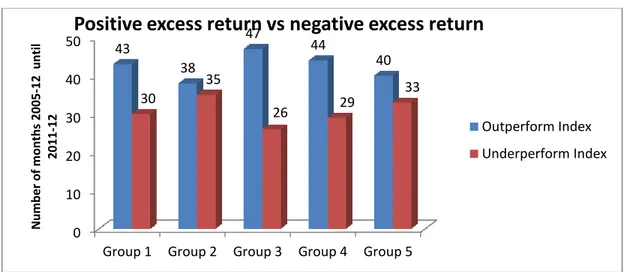
We will also present the monthly performance of each group in terms of if a group has successfully beaten the index or has failed to beat the index in figure 2. A group has outperformed the benchmark index when a positive excess return is obtained and reversely a group has failed to outperform the index when excess return is negative. This figure in combination with table 1 will give us a hint of whether or not accumulated excess return for each group comes as a result of high fluctuating returns over the index or as a result of less volatile and marginally higher returns over the index.
This first part of our research will mainly tell us whether or not there is significant evidence of larger funds performing different from smaller funds. The second part of the size-performance investigation will involve regressions in order to potentially capture patterns in the data; a regression aims to model the relationship between variables (Aczel & Sounderpandian, 2009). Our intention is to model the relationship between the dependent variable excess return and the independent variable size (TNA), for each group separately and also for all data over both the sub periods of three years and the whole sample period of six years. This is done in order to capture the impact fund size has on performance in the different fund groups and over different time intervals.
(3)
In the first regression represents the average monthly excess return for group i at time
t, represent the intercept of the equation which theoretically stands for the value of the average monthly return for group i when TNA is zero. is the slope coefficient of the
Method
regression and represent how sensitive the average monthly excess return for group i is to a change in TNA. TNA represents the average total net asset value for group i at time t, finally represent the error variable of the regression and is the only source of
randomness in the average monthly excess return (Bodie et al., 2011). The regression results will be presented in table 2 and contain square, coefficients and p-value. The R-square is a value between 0 and 1 and tells us how well the variance in the dependent variable can be explained by the independent variable, higher values of R-square means that we are dealing with a regression line that fits the data well. The coefficient represents the slope of the regression; in this case a positive coefficient means that when the size of a group of funds increases the excess return also increases whereas a negative coefficient implies the opposite relationship. The p-value helps us to determine whether we should reject or not reject the null hypothesis, the smaller the p-value indicates that the alternative hypothesis is closest to the right answer. (Aczel & Sounderpandian, 2009)
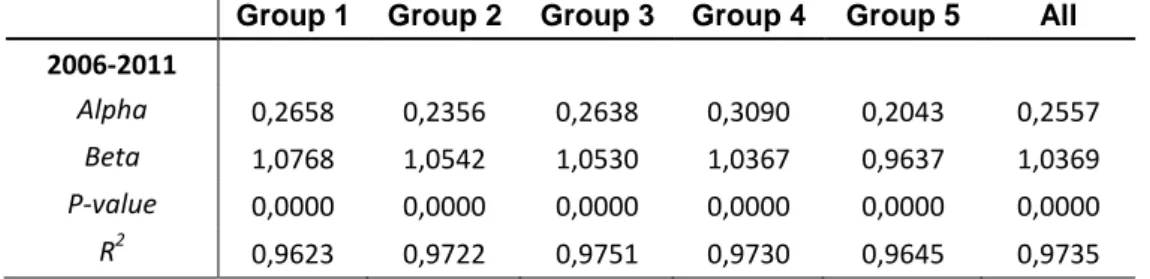
Additionally one more regression will be made in order to display the relationship between the average monthly return of group i at time t and the benchmark index at time t. The results of the second regression will be displayed in table 3. The most important variable of analysis in this regression will be the coefficients or beta for each group since this gives a good indication as to whether or not a fund group in terms of size follows the market movement and to what extent.
(4)
In the second regression , which represent the average monthly return for group i at
time t is regressed with which represent the average monthly SIX Portfolio Index at
time t.
3.9 Performance persistence
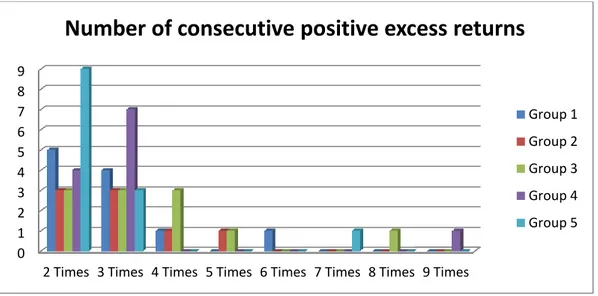
Performance persistence is an expression that describes if a fund has consistent performance for several consecutive periods either with positive or negative returns. Our funds are divided into five different groups where the funds are ranked by their fund size. Our intention is to investigate if Swedish mutual funds can keep consistent performance for several periods by looking at the relationship between return for one period and the return for the period before. In accordance with Heaney (2008) we use excess return when comparing the different periods and because our data set includes monthly return for the funds we can compare the excess return for month t with the excess return for the previous month, t-1. The excess returns are calculated for all funds and an average of the excess return for each period is used for the different groups. We test regression 3 for the whole six year period as well as for the two three year sub periods in order to test the existence of monthly persistence for each of the five groups.
Method
We construct our regression and define the variables similar to Bodie et al. (2011). Ri,t is the
excess return for period t for group i, Ri,t-1 shows the excess return for previous period t-1
for group i, αi is the intercept showing what Ri,t-1 is when Ri,t is equal to zero. βi is the slope
coefficient which shows the relationship between Ri,t and Ri,t-1 and ϵi,t is the error variable.
(5)
The third regression makes it possible for us to see if there is a significant persistence from one period to another and to see if fund managers can have what Hendricks et al. (1993) called hot hands and outperform index several consecutive periods. The study by Dahlquist et al. (2000) is to our knowledge the latest study done on performance persistence on the Swedish market. Their findings give us incentive to expect no persistence in performance which is reflected in our hypothesis below:
Hypothesis 2
H0: There is no persistence in performance of mutual fund group i H1: There is persistence in performance of mutual fund group i
If there is a significant coefficient it means that we can reject the null hypothesis and then we can see if there is positive or negative performance persistence depending on if the coefficient is positive or negative.
In addition to the regression a run test will also be conducted. A run test shows if the observations are randomly generated and each time the sign of the observations changes we have a new run (Aczel & Sounderpandian, 2009). When the excess return for each period is calculated all runs are added together and from that a p-value can be calculated. If we get a p-value with a significance level below 10%, 5% or 1% we can reject the null hypothesis which means that the fund returns would not be randomly distributed. This hypothesis will be based on the same assumption as hypothesis 2, that we will not find persistence in performance for Swedish mutual funds.
Hypothesis 3
H0: The excess returns are generated randomly H1: The excess returns are not generated randomly
3.10 Management fees
In our data the current management fees for all funds are included. The funds that have grown large are funds that have attracted new cash from investors due to positive historical excess returns or due to lower management fees since funds with higher fees tend to discourage rational investors. (Heaney, 2008)
Method
Because only the most recent management fees are available we will use the assumption that management fees do not vary during our six year period which is argued by Berk and Green (2004) and Heaney (2008). This assumption implies that the relationship between how large funds are and what management fees they are subject to should not vary much over time and hence we can examine the last period in our study and use it as a proxy for the stated relationship.
We will conduct a regression with the management fees and the total net asset values of the funds to see if there is relationship between fund size and their management fees. In the regression we use the management fees as the dependent variable, MFi and the fund size as the independent variable, TNAi, where αi is the intercept and ϵi is the error variable.
(6)
The hypothesis for the relationship between fund size and management fees is stated below:
Hypothesis 4
H0: There is no relationship between size of Swedish mutual funds and management fees H1: There is a relationship between size of Swedish mutual funds and management fees
Results and Analysis
4 Results and Analysis
In this section we present our empirical findings along with analyses of the results. In the sections 4.1-4.3 we present our empirical findings of how fund size affects performance, persistence in performance and management fees. These results are presented in connection with analysis and our own reflections.
4.1 Fund size and performance
The overall purpose with this thesis was to test whether or not fund size has a significant impact on the performance of a fund. Since no clear consensus has been agreed upon in earlier research regarding this part of mutual fund characteristics, it is vital to compare our findings with the findings of Dahlquist et al. (2000) due to the fact that they also investigate the Swedish market focusing on mutual funds. As mentioned in section 3.8 our null hypothesis and alternative hypothesis were tested using a two tailed test in order to determine differences in performance between groups and over time, hypothesis 1 is stated below and is directly followed by the empirical findings of these tests in table 1.
Hypothesis 1
There is no relationship between size of Swedish mutual funds and performance There is a relationship between size of Swedish mutual funds and performance
Results and Analysis
TABLE 1-Two tailed test results assuming unequal variances
Group 1 Group 2 Group 3 Group 4 Group 5
Comparisons of Excess Return Significance P-value Unadjusted performance P-value risk-adjusted performance 2006-2008 3-Year Accumulated Excess Return 8,7528 8,7423 11,5481 11,0571 9,4812 G1 vs G2 0,9989 0,2592 Standard Deviation excess return 0,9377 0,8608 0,8424 0,7699 0,9944 G1 vs G3 0,7165 0,2581 Average Sharpe Ratio -3,14 -4,16 -4,58 -2,99 -2,58 G1 vs G4 0,7558 0,8926 G1 vs G5 0,9304 0,5214 G2 vs G3 0,7029 0,8706 G2 vs G4 0,7427 0,3299 G2 vs G5 0,9267 0,0868* G3 vs G4 0,9438 0,3147 G3 vs G5 0,7951 0,1103 G4 vs G5 0,8374 0,4553 2009-2011 3-Year Accumulated Excess Return 12,22 9,57 8,80 12,25 4,69 G1 vs G2 0,8296 0,7524 Standard Deviation excess return 1,6079 1,2674 1,1795 1,2296 1,1796 G1 vs G3 0,7754 0,6355 Average Sharpe Ratio -1,35 -0,98 -0,85 -1,03 -1,04 G1 vs G4 0,9983 0,1499 G1 vs G5 0,5311 0,7622 G2 vs G3 0,9408 0,9049 G2 vs G4 0,8011 0,9637 G2 vs G5 0,6399 0,9514 G3 vs G4 0,7364 0,8589 G3 vs G5 0,6828 0,8295 G4 vs G5 0,4620 0,9909 2006-2011 6-Year Accumulated Excess Return 20,98 18,31 20,34 23,31 14,17 G1 vs G2 0,8537 0,5393 Standard Deviation excess return 1,3035 1,0731 1,0160 1,0158 1,0839 G1 vs G3 0,9643 0,5116 Average Sharpe Ratio -2,25 -2,59 -2,74 -2,02 -1,82 G1 vs G4 0,8691 0,9170 G1 vs G5 0,6391 0,5142 G2 vs G3 0,8724 0,9416 G2 vs G4 0,6930 0,4833 G2 vs G5 0,7510 0,2157 G3 vs G4 0,8095 0,4603 G3 vs G5 0,6274 0,2170 G4 vs G5 0,4727 0,6001 Significance level 10%*, 5%** & 1%***
Table 1 displays accumulated excess return in percent, standard deviation and average Sharpe ratio between the five groups of funds sorted by total net asset value where group 1 and 5 are the largest and smallest respectively. The P-value represent if there is evidence that a fund group perform significantly different from another fund group in terms of average excess return (unadjusted performance) and average Sharpe ratio
Results and Analysis
Looking at the accumulated excess return illustrated in table 1 we can conclude that the results do not vary much between each group of funds in the different time periods. Analyzing the difference between the largest group and the smallest group we see that there is a marginal difference in terms of accumulated excess return in the first sub period. However, in the second sub period and also in the whole sample period there is a visible difference in performance which suggests that funds on average in the largest group perform better than funds on average in the smallest group in terms of excess return. Even so, when looking at the average risk-adjusted return for the largest and smallest group in these two time periods we can see that the smallest group presents a higher Sharpe ratio, which indicates that the smallest group has performed better on a risk-adjusted basis. These results are somewhat contradictory; therefore it is not surprising that we cannot distinguish any significant relationship between size and performance for our sample, not in the sub periods of three years nor over the whole sample period of six years. Meaning that our null hypothesis cannot be rejected on a 10 %, 5 % or a 1 % significance level, this indicates that we can conclude that no clear trend exists which confirms that larger funds tend to outperform smaller funds or vice versa.
Our findings in this section are in line with the findings of Ciccotello and Grant (1996), who found no significant relationship on any level between size and performance of growth and income fund on the American fund market neither on a ten year period between 1982 to 1992 nor the two five year sub periods. Furthermore, our results are also in accordance with the findings of a more recent study conducted by Heaney (2008) that show no evidence of larger Australian equity funds outperforming smaller Australian equity funds or vice versa on any significance level.
Another thing worth mentioning is that fund group 4 (second to smallest) displays the highest average accumulated excess return for the second sub period and for the whole sample period of six years, and also the second highest result in the first sub period. Ciccotello and Grant (1996) argue that historical returns are the foundation of all advertisement that can be associated with how well a fund is performing; hence, there are reasons to believe that rational individual investors take past returns into consideration before investing. This gives us incentive to believe that funds in group 4 on average will take a leap into group 3 in the future. This theory is further supported by the findings presented in table 4, where we conclude that top performing funds tend to increase in size over time since they attract new investors.
In order to evaluate the average performance of fund managers in each of the five subgroups we have as mentioned above chosen to look at Sharpe ratio as an appropriate estimate between amount of reward and incurred risk. Returns are averaged for each group and each month, and since the average values are relatively low in comparison to the risk free rate (Swedish treasury bills) due to extreme market fluctuations especially during the financial crisis with its starting point in 2008, the average Sharpe ratio generated only negative values for each group and for each period in time. A negative Sharpe ratio is somewhat complicated to analyze since it indicates that risk free rate has beaten return, and
Results and Analysis
hence it is hard to argue that one group has a more preferable Sharpe ratio than another. The average Sharpe ratio for each of the five sub groups do not differ much, neither in the three year sub periods nor over the full six year sample period. A general conclusion is that fund managers on average have taken on risky investments that have failed to generate positive excess return in a time of heavy market fluctuations. Even so, we find a significant difference in terms of average Sharpe ratios between group 2 and group 5 for the first sub period 2006-2008. This means that we can reject the null hypothesis on a 10% level, which indicates that group 5 has performed significantly better than group 2 in terms of risk-adjusted performance. This result is however not robust over time for group 5 and 2 since the second sub period presents an extremely high p-value close to one, we therefore conclude that no clear trend can be identified that shows evidence of larger funds outperforming smaller funds or vice versa in terms of risk-adjusted performance. Our next step in evaluating the relationship between performance and size of Swedish mutual funds we will look at the results from regression one, these results can be found in table 2 in the appendix. Most noticeable is that group 5 (the smallest group) shows the highest coefficients in absolute terms for both the two sub periods and the whole sample period, this indicates that a change in size of a fund has the biggest impact in terms of performance of funds that are located in group number five.
However, the low R-square tells us that the variance in the dependent variable (performance) cannot be explained to a great extent by the independent variable (size), hence our findings presented above should be interpreted with caution. Furthermore, the high p-values presented for all groups and over all periods in time tell us that we cannot identify a significant relationship between size and performance of Swedish mutual funds, not on a 1 % level, 5 % level or a 10 % level. These findings go in line with the findings of Droms and Walker (1994) who found no evidence of size being related to unadjusted or risk-adjusted performance for international mutual funds during a ten year period from 1981 to 1990.
Furthermore, our findings are also in accordance with the findings of Dahlquist et al. (2000), who suggest that size has little effect on equity funds from 1992 to 1997 on the Swedish market. Lastly our findings also coincide with the findings of Gallagher and Martin (2005), who suggests that the size of a fund has little or no effect on performance for Australian equity funds from 1991 to 2000.
In order to give the analysis more depth we have chosen to include one additional regression, namely equation 4 whose results are presented in table 3 in the appendix. This regression deals with the relationship between average monthly return for each group of funds and the monthly return of the benchmark index. It is not very surprising but although worth mentioning that the R-square values are extremely high and the p-values show significance on all levels for this relationship, this indicates that we are dealing with an index that coincide with the movement of our sample of funds on a very high level. This gives us reason to believe that we have chosen an appropriate index to compare our
Results and Analysis
groups since this gives us a good indication as to if the groups on an individual level are sensitive or not to movements of the market as a whole. Table 3 tells us that the only group of funds that does not display a beta above 1 is group number five (the smallest group in terms of TNA), its beta is still very close to one and the difference between the group betas are not particularly large. This means that the groups on average are following the movement of the market to a very wide extent.
The next section of this result and analysis presentation will deal with the findings in figure 2 presented below.
FIGURE 2- Excess return
Figure 2 compares how many times each fund group has been able to beat the index and how many times each group has failed to beat the index. The y-axis represents number of times, which in this case refers to how many times the excess return is positive or negative at the end of each month between December 2005 and December 2011.
As we can see in figure 2 above, there are no great differences in performance between the groups. However, group number 3 has been able to beat the market the most out of all the groups. Comparing the largest group and the smallest group with each other we can conclude that group 1 (the largest group) has beaten group 5 (the smallest group) in terms of outperforming the market over the 73 months in the sample period. These findings go in line with what we discovered when comparing the six year accumulated average excess return for both the largest and the smallest group of funds, namely that group 1 slightly outperformed group 5.
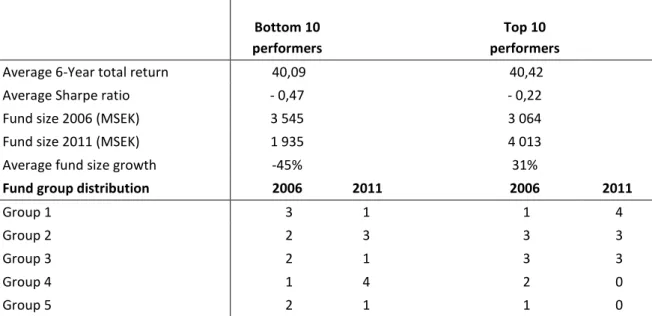
The next and final section of our size and performance result and analysis presentation, will display the findings in table 4. In order to investigate the relationship between fund size and fund performance we selected the ten best and the ten worst performing funds during the entire period similar to Ciccotello and Grant (1996). They find that funds that are large today have better historical returns which they argue is part of the reason that these funds
0 10 20 30 40 50
Group 1 Group 2 Group 3 Group 4 Group 5 43 38 47 44 40 30 35 26 29 33 N u mb e r o f mo n th s 2005 -12 u n ti l 2011 -12
Positive excess return vs negative excess return
Outperform Index Underperform Index
Results and Analysis
have grown to be large today. We have collected and ranked the ten best and the ten worst performing mutual funds based on the Sharpe ratios of the funds. The results from ranking the funds are presented in table 4.
TABLE 4- Top vs. bottom performers
Bottom 10 performers
Top 10 performers
Average 6-Year total return 40,09 40,42
Average Sharpe ratio - 0,47 - 0,22
Fund size 2006 (MSEK) 3 545 3 064
Fund size 2011 (MSEK) 1 935 4 013
Average fund size growth -45% 31%
Fund group distribution 2006 2011 2006 2011
Group 1 3 1 1 4
Group 2 2 3 3 3
Group 3 2 1 3 3
Group 4 1 4 2 0
Group 5 2 1 1 0
This table shows the top and bottom performing funds based on their Sharpe ratio during the period 2006-2011. The average fund size is presented for the beginning and the end of the period as well as the growth in fund size. The group distribution shows how many of the funds are in each size group for the beginning and the end of the period.
We have ranked the funds based on the Sharpe ratios, ranking the funds based on risk-adjusted performance is different from ranking funds based on unrisk-adjusted performance. According to Modigliani and Modigliani (1997) and Elton et al. (1995) it is important to include risk when ranking and comparing funds based on their performance and not only compare total returns.
In table 4 the results for the ten best and the ten worst funds are presented and for the period 2006-2011 the Sharpe ratios are negative, which is an indication that they have performed worse than the risk free rate (Swedish treasury bills). When ranking funds based on the Sharpe ratio the best funds will have the highest Sharpe ratio and this is also the case with negative Sharpe ratios where the least negative ratios indicate better performance (Stanford University, 1999). During our data period there have been periods with large negative returns that could be an explanation for the negative Sharpe ratios.
The funds that belong to the top ten funds are spread over the different fund groups in 2006 but at the end of 2011 the funds are more concentrated to the three largest groups, where four out of ten funds are in the largest group. The bottom ten funds seem to have changed groups from being evenly spread to being more in the small-sized groups. The average growth in fund size for the top performing funds is 31% and for the bottom funds