i
The impact of Pupil Premium
on the attainment gap in Wales
BACHELOR THESIS WITHIN: Economics NUMBER OF CREDITS: 15
PROGRAMME OF STUDY: International Economics
AUTHOR: Bethany Colwill Jenkins JÖNKÖPING May 2020
An investigation into the policy’s effect on the
ii
Bachelor’s in Economics
Title: The impact of Pupil Premium on the attainment gap in Wales Author: Bethany Colwill Jenkins
Tutor: Andrea Schneider Date: 2019-05-18
Key terms: Educational attainment, human capital accumulation, social mobility, educational policy, meritocracy.
Abstract
Education drives labour market outcomes and social mobility. When educational attainment is influenced by socioeconomic factors, many students from disadvantaged backgrounds are left behind. This is undesirable as it greatly reduces the human capital that could have been present in the national economy, therefore affecting the potential of economic growth. The purpose of this thesis is to analyse the impact of a policy that has the purpose of reducing the gap in educational attainment between disadvantaged students and their peers. The analysis takes place over a 12 year time span and across 22 local authority areas in Wales. The results highlight the importance in the measure of the attainment gap. The implementation of Pupil Premium can be correlated with a reduction in the gap that is defined by the proportional difference between disadvantaged students and their peers. The magnitude of the attainment gap has stayed fairly constant but overall attainment has risen significantly over the period under analysis. There is room for further study into the possibility that the impact of Pupil Premium has affected some groups of students more than others.
iii
T
ABLE OFC
ONTENTS 1 Introduction ... 1 2 Background ... 3 2.1 Pupil Premium ... 3 2.2 Attainment gap... 4 3 Literature review ... 7 4 Data ... 11 4.1 Variables ... 11 4.2 Descriptive statistics ... 13 5 Empiricals ... 15 5.1 Empirical models ... 15 5.2 Hypothesis ... 155.3 Results and discussion... 16
6 Conclusion ... 20
References ... 22
1
1 I
NTRODUCTION“Being born privileged in Britain means you are likely to remain privileged. Being born disadvantaged, however, means that you will have to overcome a series of barriers to ensure that you and your children are not stuck in the same trap” – Dame Martina Milburn (Social Mobility Commission, 2019).
In the United Kingdom (UK), completing secondary education is estimated to increase lifetime earnings by £100,000 (Hayward, Hunt and Lord, 2014). Disadvantaged students in the UK are less likely to complete secondary education to the same standard as their peers. Poor academic performance is linked to lower wages and higher unemployment in adulthood (National Audit Office, 2015). Education is a key driver of social mobility and reducing educational inequality is central to this goal (Crawford, MacMillan, and Vignoles, 2014). It is estimated if the link between background and achievement were weakened it could contribute £56 billion to £140 billion to the UK’s economy (Sutton Trust, 2010). In April 2011, the coalition government announced the launch of Pupil Premium funding. The expectation is that this additional funding will be used to support Pupil Premium eligible pupils and close the attainment gap between them and their peers (Department for Education, 2013).
Pupil Premium was not the first policy to concentrate additional resources in order to raise the attainment of disadvantaged students, but it may be considered the most radical (Hutchinson, Dunford and Treadway, 2016). The original attempt at reducing educational differences that have been ‘reinforced by social handicaps’ (para 153) was introduced in the 1960s in the form of Educational Priority Areas (Central Advisory Council for Education, 1967). Attainment gaps in education have always existed but are now attracting a greater level of concern (Gazeley and Dunne, 2007) which is reflected by the large budget of £2.5 billion for the 2014-15 school year that has since risen in line with inflation (Department for Education, 2013;2020). Policies with this expenditure naturally attract studies concerning the effectiveness of the spending. The Educational Endowment Foundation (2018) found no evidence of a direct relationship between increased school funding and increased pupil attainment. Instead, regarding how efficient the schools were in utilising financial and human resources to boost attainment is of higher importance. The purpose of this thesis is to assess the following research question: Has the
2
Section 2 outlines a background which summaries some key facts about Pupil Premium and gives insight into the attainment gap between disadvantaged students and their peers in Wales. Following that, Section 3 offers the literature review which covers the importance of equal educational outcomes and different types of attainment gaps that are known to be present in students’ achievement. In Section 4, the two measures of the attainment gap that will be measured are defined alongside the control variables used in the regressions. Descriptive statistics can also be found in this section. Section 5 defines the models used in the regressions, states the main hypothesis that is being tested and presents the results with the ensuing discussion. Finally, in Section 6, the thesis is concluded, summarising the implications of the results and the corresponding limitations. Suggestions for further study are also included.
3
2 B
ACKGROUND2.1 PUPIL PREMIUM
When Pupil Premium was first introduced the allocation of funding was based on the number of students eligible for Free School Meals (FSM) or had been in the care system for more than 6 consecutive months. FSM have existed in some form since the 1906 Education Act was passed. Eligibility for FSM is dependent on household income being below £16,190. In 2012, the second year of the policy, Pupil Premium was extended to include extra funding for any children who have been eligible for FSM in the previous 6 years. The funding is given to the schools via the local authorities. Schools were given the freedom to choose how to spend the additional funding in the way they perceived to be the most beneficial for the eligible children. This thesis will evaluate the effects of the reform in 2012 – 2019 in comparison to a previous period of 2008-2011.
The Office for Standards in Education, Children's Services and Skills (Ofsted), an impartial and independent non-ministerial department of the UK government, inspects schools and promotes progress. So, while schools have a choice in how they spend the funding acquired from Pupil Premium, Ofsted specifically monitor the attainment and progress of disadvantaged students. Schools are also required to annually report on how they have spent the money and this report is made publicly available, including to parents (National Audit Office, 2015). School governors are also expected to put pressure on school leaders when it comes to the annual budget.
The number of eligible students has averaged 14.6% between 2008 and 2019. Eligibility for FSM has been stable overall periods, see appendix A. So, it can be assumed schools will have had stable inflows of funding. This stability is surprising as the 2009 recession caused very high levels of unemployment which has then fallen significantly since see appendix B. It would have been expected that eligibility would have moved in line with movements in the labour market. The lack of a strong relationship is confirmed by the correlation matrix (table 3) which is presented in section 4 of the thesis. This result may signal some concern about the accuracy of the number of eligible students. But in Welsh local authority areas, there is access to an eligibility checking system (ECS) which allows them to notify families if they may be eligible instead of families having to come forward with proof (Welsh government, 2014). The family must confirm this by putting in a request as the funding cannot be given to the school
4
automatically. In the United Kingdom, about 4% of state school students have unknown FSM eligibility status (Gorard, 2016).
At the age of 16 British students will have reached the end of 11 years of compulsory schooling, the latter 2 years are of higher importance as this is when General Certificate of Secondary Education (GCSE) subjects are chosen, taught and examined. The results GCSEs are often taken as proof of ability, which is key for further study, employment and eventually social position (Demack, Drew and Grimsley, 2000).
2.2 ATTAINMENT GAP
Data on the attainment gap is collected in the form of the achievement of the level 2 threshold inclusive. This is defined as “a volume of qualifications at Level 2 equivalent to the volume of five GCSEs at grade A*-C including a grade A*-C in English or Welsh first language and Mathematics.”. Within the period under analysis, 2008-2019, there were changes made to this definition and some GCSEs. From 2017 onwards, changes were made to English, Welsh and Mathematics qualifications and there was an adjustment to the level 2 threshold inclusive; from then onwards, no more than 40% (2 of the 5 qualifications) could be vocational equivalents to GCSEs (StatsWales, 2020). The empirical analysis in section 5 will control for this change.
It is important to note that while Pupil Premium funding supports students who have been FSM eligible at any point in the most recent 6 years of their education, the data available on GCSE results only have a record if they are FSM eligible at the time of examination.
Figure 1. Attainment over time (2008-2019), Source: StatsWales, own calculations
0 20 40 60 80 2008 2009 2010 2011 2012 2013 2014 2015 2016 2017 2018 2019 P er centa ge po ints Exam year
Percentage of students reaching a level
2 threshold
5
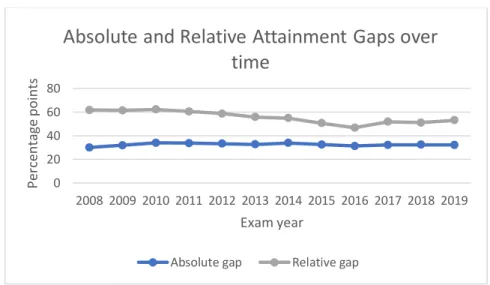
Above in figure 1, in the 2017 examination year and the first year where the reforms affected, there is a slight decrease for both student groups which departs from the general trend of increasing attainment. Due to this being so recent, we are unable to see whether this mean has resulted in a plateau of the trend of increasing attainment for all or is a temporary departure from the trend. From the figure above, it looks like the gap between FSM eligible students and their peers has stayed constant over the 11 years. Below in figure 2, the gap is graphed. The absolute gap is the percentage point gap between the two student groups. There is little movement in this data.
Figure 2. Attainment Gaps (2008-2019), Source: StatsWales, own calculations
However, it is necessary to put this into the context of the general increase in the level of attainment during the previous 11 years, so the measure of a relative attainment gap has been created. This sets the absolute attainment gap in proportion to the attainment of non-eligible students (the majority). This is especially useful for inference. In 2008 the absolute gap is 30.1 and 2016 it is 31.3 which is showing a slight increase but when you look at the relative gap the data points for those years are 61.7 and 46.8. Approximately, the absolute attainment gap is 30 percentage points throughout the 11 years. This does not show a distinction between 18.7% of FSM eligible students achieving the level 2 threshold while 48.7% of their peers achieving the same thing in 2008, with the 2016 data points of 35.6% and 66.8% respectively.
Prior to 2017, the year of the GCSE reform, the relative attainment gap had been slowly decreasing. For the 3 time periods after this point, it has not reached the low it did in 2016. This would suggest that either the Pupil Premium funding has had less of an impact in these recent years or that the GCSE reforms have disproportionately affected the achievement of
0 20 40 60 80 2008 2009 2010 2011 2012 2013 2014 2015 2016 2017 2018 2019 P er centa ge po ints Exam year
Absolute and Relative Attainment Gaps over
time
6
disadvantaged students. The implementation of the GCSE reforms will be tested for a correlation in the change of the size of both the absolute and relative attainment gaps later in this thesis.
Below in figure 3, the attainment differences between FSM eligible students and their peers are presented for the year 2019. The average for Wales is shown alongside the results from each of the 22 local authority areas, which will be the focus of the empirical analysis in section 5. The graph depicts the persistence of the issue of a gap in attainment in every area. However, Merthyr Tydfil (21.4) has a smaller gap than that of the Vale of Glamorgan (41.0). This may be explained by an overall lower level of attainment present in Merthyr Tydfil but there are also other possible reasons. Other causes for these difference between local authority areas will also be tested later in this thesis.
Figure 3. Attainment by local authority area (2019), Source: StatsWales
0 20 40 60 80 W al es V al e of … C ar di ff M onm o ut … C er edi gi on Sw ans ea C ar m ar th e… P ow ys C on w y N ewp or t Gw yne dd B ri dg en d D en bi ghs h … Fl int shi re N ea th P or t… C aer phi lly Is le of … R hond da ,C … W rex ha m P em br ok e… Tor fa en B la en au… M er thy r… P er centa ge
Local Authority Area
Attainment of level 2 threshold
7
3 L
ITERATURE REVIEWEducation-based meritocracies appear as an attractive ‘progressive’ goal for governments to aspire to (Goldthorpe and Jackson, 2006). Under this system, students’ progress in education is based on their ability, this progress then determines occupation and labour market success (Themelis, 2008). Under these assumptions, labour market status would be determined fully by achievement rather than ‘ascription’. Here, ascription would mean success in education and the labour market which is beyond an individual’s control, such as an advantageous socioeconomic position ensuring better outcomes. See appendix C for a figure depicting that more success in the education system will on average increase expected lifetime productivity returns. Current British society likely possesses more meritocratic tendencies than patterns of advantage and disadvantage which have been more prominent in the past (Saunders, 1997). Nonetheless, less important does not mean irrelevant, as seen by the attainment gaps presented in the previous section. There is some evidence that suggests the current idea of meritocracy in the education system has accentuated the inequalities by securing privileges for those who can advance through education and from there to the labour market success (Themelis, 2008). Those who have already succeeded within education and the labour market may use their knowledge to reproduce the same outcomes for their children. Saunders (1997) the previously cited empirical study which concluded that Britain was relatively meritocratic, stated if middle-class children’s success was due to socialised traits that enabled them to do well in school then this was still a meritocratic system. Saunders (1997) analysis has come under critique as within the system he defines as meritocratic, the effect of class origins remains strong (Breen and Goldthorpe, 2003). The issue with the system is not that middle-class students tend to do well but that similarly abled working-class students tend to achieve less, this results in a more rigid social hierarchy. If the education system enabled all students to achieve their potential it would increase productivity returns for individuals and society.
Eligibility for FSM is considered an accurate measure of child poverty (Gillborn and Mirza, 2000) and due to data availability, is often used as an indicator of social class in educational contexts. Social class is a more complex concept than low income on the basis eligibility of FSM. Many reports that have investigated ‘working-class’ students have solely used the indicator of FSM eligibility (The Education Committee, 2014; Social Mobility Commission, 2019). So, from this point, the social class gap and the gap between disadvantaged students and their peers will be considered as interchangeable concepts in the remainder of this thesis.
8
The attainment differences based on social class is larger than differences between ethnic groups and the gender gap (Demack et al., 2000). The State of the Nation (2017) report similarly concludes that those from economically disadvantaged backgrounds have the largest attainment gap, alongside students with special educational needs (SEN). Lower levels of attainment for disadvantaged students may be partly attributed to material deprivation which would determine a general inability to afford resources that could aid studying. The complex relationships between social class, ethnicity, gender and educational attainment (Strand, 2014) would suggest that the true causes behind the gap cannot be summed up so easily.
The students with SEN are more likely to be in poverty than their peers (Shaw et al., 2014) while in Wales, FSM eligible pupils are twice as likely as pupils who are not eligible to have additional learning needs (Welsh Government, 2014). The interaction of having SEN with other characteristics such as gender and ethnicity is not well studied. In contrast, the gender attainment gap has been well documented. Girls tend to outperform boys in all subjects (Bramley et al, 2015), but this gap is lower in STEM or language subjects. The gender attainment gap does not seem detrimental to labour market success which can be reflected by the gender pay gap in Wales recently being calculated as 11.2% (StatsWales, 2019). Girls are 1.5 times more likely to gain a level 2 threshold than boys, but those from the highest social class backgrounds are between 5 – 9 times more likely to achieve this threshold than those from the lowest social backgrounds (Connolly, 2006). There is also some evidence to suggest boys are over-represented at the extremes of the distribution of achievement. Data is not available on the breakdown of the grade distribution or by that of gender and SEN, so a deeper investigation of these variables is beyond the scope of this thesis. This means we are unable to analyse if Pupil Premium has impacted male or female students more and how this has contributed to changes in the overall attainment gap.
Students’ characteristics will interact with the educational setting. Disadvantaged students are more likely to be taught by teachers who have less experience and lower qualifications (APPG, 2019) while subjects that are known to have high returns for social mobility have issues with teacher recruitment and retainment (Social Mobility Commission, 2019). These structural aspects of the education system may be resolved through additional funding for teachers. However, teachers’ expectations are known to be a key determinant of school effectiveness and pupil progress (Feinstein, Duckworth and Sabates, 2004). Classes in poorer areas have different patterns of teacher-student interactions and this can influence the attainment gap between advantaged and disadvantaged students (Knowles and Evans 2012). Teachers with
9
negative stereotypes based on aggregate result differences can perpetuate low expectations and have a negative impact on marginalised student groups’ performance (Babad, Inbar, & Rosenthal, 1982). White working-class, black, or male students fall victim to negative stereotyping in education and the existing prejudices will take more than additional funding to remove. The attainment gap for these groups may remain at a stubborn level compared to their peers.
An economic disadvantage was found to have a more significant effect on white British students than ethnic minorities (Kingdon and Cassen, 2010). In part, this can be attributed to the ‘immigrant paradigm’ (Kao and Thompson, 2003) where those with immigrant backgrounds dedicate themselves more towards education as they view it as a way out of poverty. The anti-school culture among white British students was first studied by Paul Willis in his renowned ‘Learning to labour’ book in 1977. Gaining qualifications was not valued by these students as they expected to get manual jobs in the local community. However, even after the decline of manual jobs from a quarter of all jobs in 1980 to 8.2% of jobs in 2008 (PWC, 2009), there was still anti-school subculture present for white students which were non-significant for those from immigrant backgrounds (Demanet and Van Houtte, 2011). While these studies highlight a specific aspect of subculture attributed to white-British students it does not mean that all other students are a homogenous group. While data for Welsh students are not broken down by ethnicity, Appendix D shows a measure of attainment broken down by FSM and ethnicity for GCSE students in England. Chinese FSM eligible students are only second to Chinese non-FSM eligible students and have higher attainment than all other ethnic groups regardless of FSM eligibility. As the anti-school subculture studies would suggest, white FSM eligible students have the lowest attainment of any student group. Yet out of all non-FSM eligible students, black students had the lowest attainment. Cultural and subcultural attitudes to education clearly show some effect on student attainment.
Communities matter when it comes to aspiration level, some very deprived areas have high aspiration while others struggle. Certain community characteristics can contribute to lower aspirations such as close-knit social networks, a sense of isolation from broader opportunities and a history of economic decline (Social Exclusion Taskforce, 2008). It is thought that these conditions will lead to restrictions on young people’s access to opportunities. If it is the cultural aspects of the community or an anti-school attitude that leads to certain students underachieving, then the extra funding given by Pupil Premium would not necessarily have a direct impact on the attainment gap. The analysis in this thesis is limited in the sense that we
10
cannot control for changes in the general level of funding for schools, individual schools’ culture or other influential aspects such as changes to teacher training.
To evaluate if the policy is successful, cost-benefit analysis is often used. In the case of Pupil Premium, this could mean the current expenditure of the policy is compared with the expected additional income that would be generated by a better educated future workforce. Before the introduction of the additional funding, only 57% of schools focused on disadvantaged students, rising to 97% afterwards (National Audit Office, 2015). Even without more funding, purely focusing efforts on improving the attainment of disadvantaged students could have yielded better results. If policy analysis were to go further and then analyse the efficiency of Pupil Premium, it would be hard to then separate the benefit caused purely from schools pursuing an interest in raising the attainment of disadvantaged students, from the benefit of additional funding allocated by the state. In general, establishing causality of influence on educational attainment is difficult (Social Exclusion Taskforce, 2018). Ofsted commented that the schools who have been most successful with Pupil Premium funding have had ambition and strong leadership (Department of Education, 2013). Therefore, the analysis could go to the level of an impact assessment on each school that receives Pupil Premium. While it is beyond the scope of this thesis to complete an in-depth policy analysis, it is key to highlight that a policy’s effect cannot be fully explored by a single measure.
11
4 D
ATAA correlation of the introduction of Pupil Premium will be tested against a reduction of the attainment gap between disadvantaged students and their peers. All data has been sourced from StatsWales which is the Welsh Government’s online repository for statistics specifically from Wales. These are produced separately from data collected by the British Office for National Statistics (ONS). Panel data will be used in this analysis. The analysis is based on panel data for the years 2008-2019 covering the 22 local authority areas within Wales. Data on the attainment gap was presented in the Social Mobility Commission’s annual ‘State of the Nation’ report, this data was presented in graphs and had no source on either the ONS or on StatsWales. A data request was made to have access to the attainment gap data for each local authority area for as many years as it has been recorded. The office of the School Statistics, Welsh Government (also known as Ystadegau Ysgolion, Llywodraeth Cymru) were able to compile the data and make it public on the StatsWales website. Additional requests were made to the Social Mobility Commission to extend the thesis to include the analysis of England and its 343 local authority areas, but these could not be completed.
4.1 VARIABLES
Absolute Gap (AG)
The absolute attainment gap is the difference in the percentage of students achieving the level 2 threshold based on whether they are recipients of free school meals.
𝐴𝐺 = (𝑛𝑜𝑛 𝐹𝑆𝑀 𝑟𝑒𝑐𝑖𝑝𝑖𝑒𝑛𝑡𝑠 𝑎𝑐ℎ𝑖𝑒𝑣𝑖𝑛𝑔 𝑙𝑒𝑣𝑒𝑙 2) % − (𝐹𝑆𝑀 𝑟𝑒𝑐𝑖𝑝𝑖𝑒𝑛𝑡𝑠 𝑎𝑐ℎ𝑖𝑒𝑣𝑖𝑛𝑔 𝑙𝑒𝑣𝑒𝑙 2) % (1)
Relative Gap (RG)
The relative attainment gap is the magnitude of the absolute gap over the percentage of students achieving the level 2 threshold who are not recipients of FSM. This measure is important as it will cancel out the overall trend of increasing attainment for both student groups.
𝑅𝐺 =
𝐴𝐺(𝑛𝑜𝑛 𝐹𝑆𝑀 𝑟𝑒𝑐𝑖𝑝𝑖𝑒𝑛𝑡𝑠 𝑎𝑐ℎ𝑒𝑖𝑒𝑣𝑖𝑛𝑔 𝑙𝑒𝑣𝑒𝑙 2)% (2)
Pupil Premium (PP)
The introduction of Pupil Premium and its possible relationship with the attainment gap is the principal interest of this thesis. We measure this by creating a dummy variable which has the value of 1, for the years that the extra funding under this policy was made available for schools
12
(2012-2019) and has the value of 0, for the years before the implementation of the policy (2008-2011). The expectation will be that the introduction of Pupil Premium will be negatively correlated with the absolute and relative attainments gaps.
GCSE Reformations (GR)
This second dummy variable exists to separate the differences that could occur due to the reformation to some aspects of GCSE qualifications in Wales. The years from 2017 to 2019 are affected by the reformation. For the periods after the reforms, the dummy variable has a value of 1 and for the periods prior, a value of 0. This variable is included to see if the reformation corresponds with a significant change in the attainment gap. It is unknown if the reformation would impact disadvantaged students more or less than their peers which could lead to a change in the relative or absolute attainment gap.
Eligibility (EG)
EG reflects the proportion of students under examination each year who are eligible for FSM. This variable will allow to test for correlation between the size of the cohort of disadvantaged students and the size of the attainment gap. If there is a significant relationship between eligibility and the size of the gap it would suggest there would be clustering effects of disadvantaged students. A positive relationship would mean that an increase in the number of disadvantaged students would increase the attainment gap which then infers that the two groups of students become more distinct from one another. A negative relationship would infer the reverse. It is not clear from the theory which would be expected so the significance of a relationship will be discussed in section 5.
Diversity (DV)
The ethnicity attainment gap is also well studied within the United Kingdom. DV is the diversity statistic taken from the percentage of Black, Asian, Minority Ethnic (BAME) residents living within the local authority area in a given year. As there is no data on the attainment gap broken down by students’ ethnicity, we will use this measure to infer this from the general population. It is expected that more diversity would reduce the size of the attainment gap as white FSM eligible students score lower than non-white FSM eligible students.
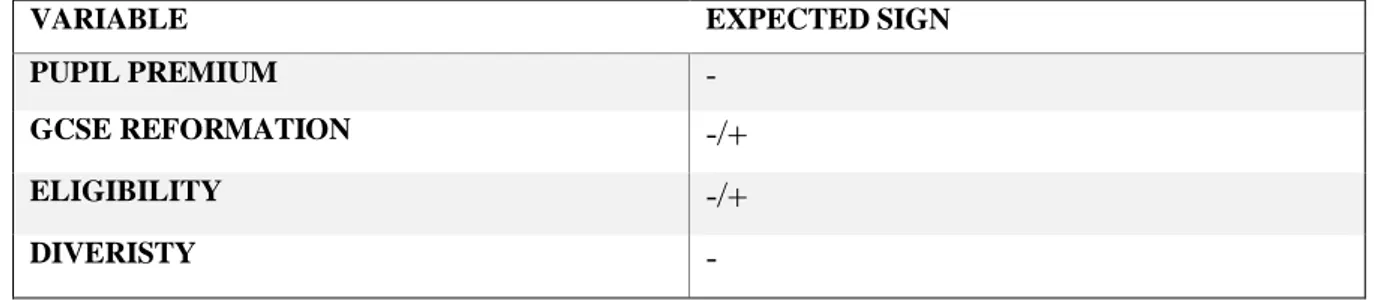
Table 1 below, summarises the expected effect that the control variables have on the attainment gaps.
13 Table 1. Expected signs
VARIABLE EXPECTED SIGN
PUPIL PREMIUM -
GCSE REFORMATION -/+
ELIGIBILITY -/+
DIVERISTY -
4.2 DESCRIPTIVE STATISTICS
The descriptive statistics are collected below in table 2, the number of observations varies due to omission of data points by StatsWales for not being sufficiently robust. This can be attributed to having small populations of BAME in certain areas of Wales, so the sampling technique in use was not valid.
Table 2. Descriptive Statistics
VARIABLES N MEAN MEDIAN MAXIMUM MINIMUM STD. DEV
ABSOLUTE GAP 264 31.5 31.7 47.1 15.8 4.75
RELATIVE GAP 264 54.7 55.1 79.5 27.6 8.53
ELIGIBILITY 264 14.7 14.4 27.2 6.8 4.18
DIVERSITY 255 3.4 2.3 18.5 0.6 3.43
The descriptive statistics show the relative attainment gap has a much higher variance than the absolute attainment gap. For the absolute attainment gap, the highest value (47.1) was is from Merthyr Tydfil in 2008, before the introduction of Pupil Premium and the lowest value (15.8) was from the Isle of Anglesey in 2014 which is after the implementation of Pupil Premium. However, for the relative attainment gap the same pattern does not feature, the smallest value was also from 2014 in the Isle of Anglesey (27.6) and the highest value (79.5) is from 2017 in Monmouthshire. This is most likely due to increasing attainment for both student groups so the absolute attainment gap can still increase when both groups attainment does not rise equally. The diversity statistic has an extreme maximum (18.5) compared to the mean (3.4) as the capital city, Cardiff, has a much higher BAME population than rural areas.
14
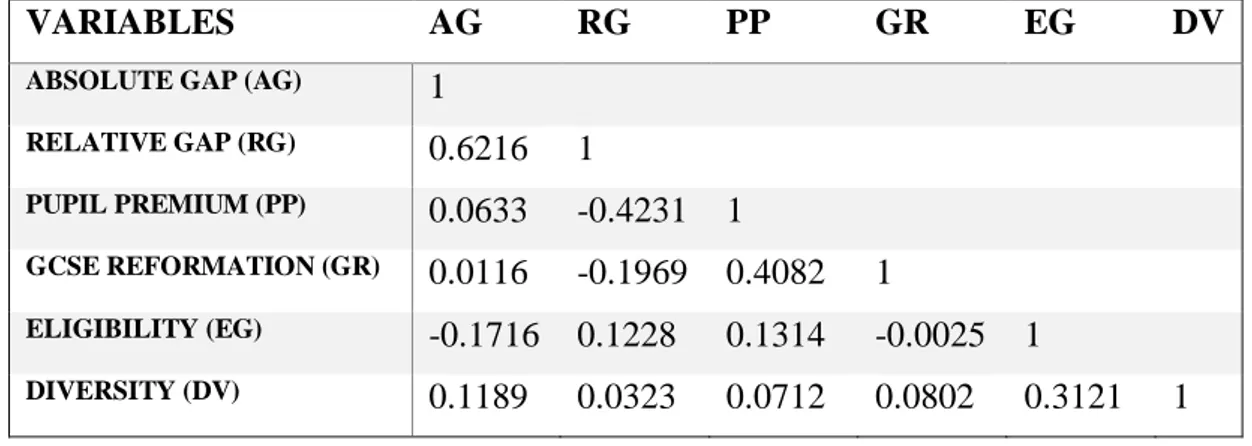
Table 3 presents the correlation matrix, where the values can be between minus and plus one. Zero indicates no correlation, one indicates a perfect positive relationship and minus one indicates a perfect negative relationship (Gujarati, 2003)
Table 3. Correlation matrix
VARIABLES AG RG PP GR EG DV
ABSOLUTE GAP (AG) 1
RELATIVE GAP (RG) 0.6216 1
PUPIL PREMIUM (PP) 0.0633 -0.4231 1
GCSE REFORMATION (GR) 0.0116 -0.1969 0.4082 1
ELIGIBILITY (EG) -0.1716 0.1228 0.1314 -0.0025 1
DIVERSITY (DV) 0.1189 0.0323 0.0712 0.0802 0.3121 1
In the table the only relatively strong correlation (i.e. ≥ |0.5|) is between AG and RG which is expected and acceptable as they are not tested in the same regressions. The interaction between PP and GR can also be ignored as they are both dummy variables for years and the correlation is just that overlap. The correlation between EG with AG is only very weakly negative (-0.1716) while the correlation between EG and RG is very weakly positive (0.1228). This is unexpected, further exploration of the difference in the relationship of eligibility with the absolute and relative attainment gaps will be discussed in the following section.
15
5 E
MPIRICALS5.1 EMPIRICAL MODELS
Panel data allows several different regression models. From the data, originally a Fixed-Effects Model (FEM) was expected to be most suitable due to using the separate local authority areas. However, after completing a Hausman test, the Random Effect Model (REM) is most suitable. Both the Hausman test and the output of a FEM regression can be found in Appendix E. In this case, REM may be more suitable due to the relatively small number of cross-sectional units. While table 1 covers the empirical hypotheses for the control variables, this thesis is concerned with the Pupil Premium policy.
The cross-sectional unit, i, is each individual local authority area of which there are 22. The time period, t, is defined as each year. The same random effect model will be used for both the absolute attainment gap and the relative attainment gap as the
𝐴𝐺𝑖𝑡= 𝛼 + 𝛽1𝑃𝑃𝑖𝑡+ 𝛽2𝐺𝑅𝑖𝑡+ 𝛽3𝐸𝐺𝑖𝑡+ 𝛽4𝐷𝑉𝑖𝑡+ 𝛾𝑖+ 𝑢𝑖𝑡 (3) 𝑅𝐺𝑖𝑡= 𝛼 + 𝛽1𝑃𝑃𝑖𝑡+ 𝛽2𝐺𝑅𝑖𝑡+ 𝛽3𝐸𝐺𝑖𝑡+ 𝛽4𝐷𝑉𝑖𝑡+ 𝛾𝑖+ 𝑢𝑖𝑡 (4)
where α is the constant intercept, 𝛾𝑖is the individual specific intercept and 𝑢𝑖𝑡 is the
idiosyncratic error term.
5.2 HYPOTHESIS
Therefore, the analysis will look for significant evidence that the introduction of Pupil Premium has reduced the attainment gap between disadvantaged students and their peers. The same hypothesis will be tested for both the relative and absolute attainment gaps.
𝐻0:𝛽1 < 0
That is, for the years after the introduction of Pupil Premium the attainment gap has been significantly reduced.
The alternate hypothesis is then that the introduction Pupil Premium has either increased the size of the attainment gap or it has remained unchanged.
16
5.3 RESULTS AND DISCUSSION
The addition of time fixed effects was considered but due to already having two time dummy variables it would be likely to be highly correlated with the GCSE reformation variable and the main variable under investigation, Pupil Premium. Table 4 contains the output of the regression for the absolute attainment gap as the explanatory variable and table 5 presents the output for the relative attainment gap as the explanatory variable.
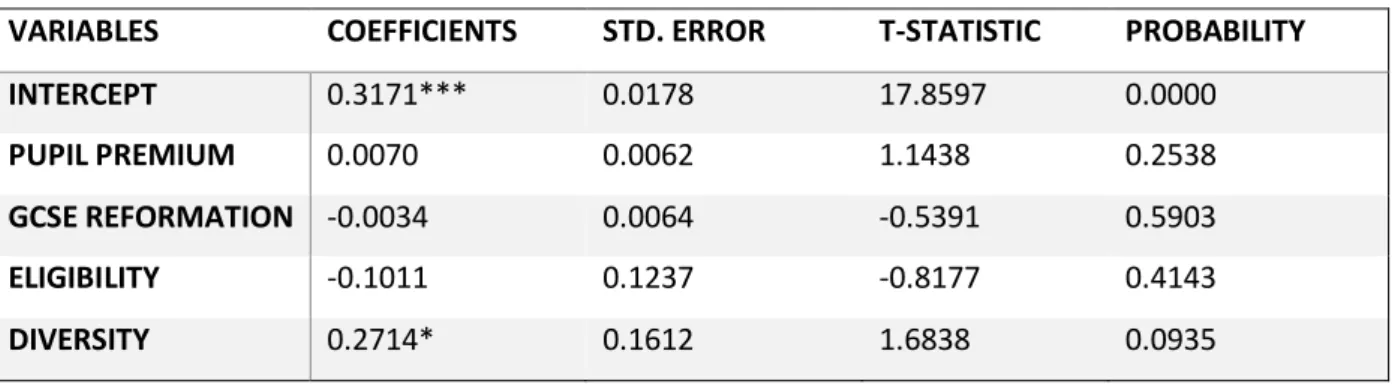
Table 4. Random effect regression model – results for the absolute attainment gap
VARIABLES COEFFICIENTS STD. ERROR T-STATISTIC PROBABILITY
INTERCEPT 0.3171*** 0.0178 17.8597 0.0000 PUPIL PREMIUM 0.0070 0.0062 1.1438 0.2538 GCSE REFORMATION -0.0034 0.0064 -0.5391 0.5903 ELIGIBILITY -0.1011 0.1237 -0.8177 0.4143 DIVERSITY 0.2714* 0.1612 1.6838 0.0935 ***/**/* significance level of 1%/5%/10%. Total panel (unbalanced) observations: 255 Cross-sections included: 22
Periods included: 12 R squared: 0.0169 Adj. R squared: 0. 0012
From data given in table 4, the coefficient of Pupil Premium is positive, yet insignificant. The level of significance of this coefficient is 0.2538 which is larger than the 0.05 level of significance being tested within this thesis. This means we cannot reject the null hypothesis so conclude that there is no significant evidence of Pupil Premium decreasing the attainment gap. In this regression, the only significant result is from the diversity variable, at 9.35%. The output would suggest that when diversity would increase, the absolute attainment gap would then increase a small, but a meaningful amount. The expectation would be that a negative relationship exists, the interpretation from the output would be that when ethnic diversity increases, the gap between disadvantaged students and their peers also increases. This may be due to white-British students and students from ethnic minorities not being equally represented in eligibility for FSM. So, if students from ethnic minorities were less likely to be eligible for FSM, given that those same students usually score higher than their white-British counterparts; this could explain the positive relationship between the absolute attainment gap and the diversity variable. In other words, this would highlight the lower achievement of disadvantaged
17
white-British students when they are clustered together in the FSM eligible group. Limitations in the dataset on student characteristics means the diversity statistic may not accurately represent the students under examination in a given year. This, alongside an investigation on whether Pupil Premium has distinct effects between separate ethnic groups, would be of interest for further research.
GCSE reformation and eligibility come back as having no evidence of a significant effect within the regression. So, considering the absolute gap alone, it would leave us to believe that Pupil Premium has not been successful in reducing the attainment gap between disadvantaged students and their peers. While figure 2 shows that the absolute gap has stayed fairly constant from 2008 to 2019 and Table 4 finds no significant relationship between the absolute gap with Pupil Premium; this does not capture that the attainment of each student groups has approximately risen in unison. The actual rate of increase in attainment of disadvantaged students would be quicker than that of their peers due to the magnitude of the gap in 2008 (18.7% vs 48.7%). Analysis of the relative attainment gap will allow us to put the absolute gap in perspective as a proportion of the level of attainment for non-disadvantaged students, this method will cancel out the impact of overall raising attainment. The output of the regression ran on the relative attainment gap is presented below in table 5. The R-squared for both regressions are low, this is not a significant concern within this thesis as the aim is not to fully explain the attainment gaps, but rather to assess the impact of Pupil Premium.
Table 5. Random effect regression model – results for the relative attainment gap
VARIABLES COEFFICIENTS STD. ERROR T-STATISTIC PROBABILITY
INTERCEPT 0.5434*** 0.2342 23.1990 0.0000 PUPIL PREMIUM -0.0825*** 0.0233 -3.5399 0.0005 GCSE REFORMATION -0.0030 0.0252 -0.1198 0.9047 ELIGIBILITY 0.4035*** 0.1211 3.3333 0.0010 DIVERSITY 0.0333 0.1407 0.2367 0.8131 ***/**/* significance level of 1%/5%/10%. Total panel (unbalanced) observations: 255 Cross-sections included: 22
Periods included: 12 R squared: 0.0955 Adj. R squared: 0.0810
18
For the relative attainment gap, 𝛽1 has a negative coefficient and is statistically significant
(0.0005<0.05). In this case, we can accept the null hypothesis and conclude that there is significant evidence that the introduction of Pupil Premium has coincided with a decrease in the relative attainment gap. This means that the proportional difference between disadvantaged students and their peers has reduced. However, when the coefficient is considered the effect seems very small. The coefficient for the Pupil Premium time dummy is -0.0825, meaning that for the years in which the extra funding was made available to schools the relative attainment gap was only very minimally reduced.
Under the measure of a relative attainment gap, rather than absolute attainment gap, the diversity variable is no longer significant. This may be in part due to its lack of accuracy for the student population as mentioned previously, or, that non-white British students are treated as a homogenous group in this dataset when that is not found to be true in many other studies. A significant result for the absolute attainment gap and not the relative attainment gap means there is the possibility of cointegration of the diversity data and the data for the absolute attainment gap as both generally rose over time. However, appendix F shows the output of a Pedroni Residual Cointegration Test and 6 out of the 11 statistics do not reject the null hypothesis that there is no cointegration at a 5% significance level. This is not strong proof of no cointegration, so Appendix G shows the result of the output when the variables have been first differenced, there are no significant results for any variables tested.
Similarly, to the previous regression results, GCSE Reformation has no significant effect on the relative attainment gap. As GCSE reforms were minor this is not unexpected. Eligibility has a significant relationship with the relative attainment gap (0.001<0.05), the positive coefficient means that where more students are eligible, the gap has been higher. This may suggest that there are clustering effects of disadvantaged students in similar schools perpetuating the size of the gap. The socioeconomic makeup of any school’s students correlates with the Ofsted rating of the school. The Ofsted rating has previously been found to have no relationship with the size of the attainment gap in the United Kingdom (Social Mobility Commission, 2019). It was not able to be tested in this thesis due to lack of data for the Ofsted rating amongst Welsh schools but would be an interesting point for further study as the effect of schools in London would have been included in the United Kingdom may have skewed the results and therefore would not apply to Wales. London tends to be a special case as it is known for being a hotspot for social mobility, having many FSM eligible students but also the highest attainment rate across the United Kingdom (APPG, 2019).
19
This notion of the clustering of disadvantaged students and its subsequent effect on the relative attainment gap would fit the results of the correlation matrix discussed previously. The relative attainment gap has a positive correlation with eligibility and a significant relationship in the regression while the absolute attainment gap has a negative correlation with eligibility and a non-significant relationship in the regression. The relative attainment gap is a proportional measure while the absolute attainment gap is just the magnitude of the difference. This demonstrates how differences in the measure of the gap can result in profoundly different outcomes. Many of the reports on the evaluation of Pupil Premium do not define how they measure the gap. Public debate must distinguish the difference between changes in the magnitude of the gap and changes in relative measures. Over longer periods, changes in the relative gap may be more important to analyse as there may be trends in the overall level of attainment. While in shorter periods, such as the difference between consecutive years, changes in the magnitude of the gap may serve as a better form of analysis.
20
6 C
ONCLUSIONEmpirically, the introduction of the Pupil Premium policy cannot be correlated with strong success with regards to reducing the absolute or relative attainment gaps. For the absolute attainment gap, the result for the impact of Pupil Premium was not significant and for the relative attainment gap, the reduction was found to be statistically significant, but the coefficient value was meagre. The control variables also had differentiating effects dependent on the measure used; the absolute attainment gap had a positive relationship with the level of diversity. The relative attainment gap showed no evidence of a relationship with diversity but did indicate a positive relationship with the proportion of FSM eligible in the student cohort. Neither regression showed a significant relationship with the GCSE reformations.
The regressions for the absolute and relative attainment gap exhibit dissimilar results, thus highlighting the gravity in the calculation behind an attainment gap. The measure of the attainment gap is not standardised in reporting. A merit to this thesis is that two different methods are defined and analysed while reports into the topic often only use one unspecified method and comment on it. However, some of the reports that are ambiguous about the calculations behind the conclusions on the gap are released by either the Department of Education (2013;2020) themselves or work in conjuncture with them such as the Social Mobility Commission. So, the limitations that this thesis has with regards to no access for the data on the breakdown of student achievement by gender, ethnicity or SEN is not encountered by those reports.
The relatively low impact of Pupil Premium found in this thesis may not necessarily improve with the addition of the new variables, gender and SEN breakdowns, or a more accurate indicator for ethnicity. But if better access to data on student characteristics were available, then areas for further study within the impact of Pupil Premium would be insightful. Pupil Premium may have had a larger impact on a specific a gender or differing levels of effect on the different ethnic groups in the student population. It would also be of interest to replicate a study into the impact of Pupil Premium on the attainment gaps at GCSE level in Northern Ireland and England and for the Scottish Highers (GCSE equivalent) qualifications.
Another limitation of this thesis is the relatively short period of data for the period before the implementation of Pupil Premium. This does not allow us to properly analyse the overall trend of rising attainment and if Pupil Premium may be correlated with that. Extra funding given to schools in order to raise the attainment of disadvantaged students may just have easily had a
21
positive effect on their peers. The relative attainment gaps ability as a measure to cancel out the trend means it may give a more illuminating description of the situation presented in the thesis. So, the conclusion can be that the policy is somewhat successful in reducing the relative attainment gap based on the empirical analysis in section 5. The small coefficient is likely to represent that the impact of extra funding can only do so much within the context of cultural attitudes towards schools. The social aspects of attainment such as low expectations and low aspiration for certain children limit the potential effect of Pupil Premium, raising attainment would, therefore, be more complex and require a multi-agency approach which is more often easier at a localised level that can properly target regional concerns (Social Exclusion Taskforce, 2008). If a similar policy were to be replicated in another country which also suffers from inequality of educational outcomes, the social aspects would have to be taken into consideration as those aspects may act as friction in preventing a more successful result given the expenditure of a policy.
Students due for examination in the summer of 2020 will not be sitting the exams due to the spread of Covid-19 and the subsequent bans on gatherings of people. The grades that students will then receive will be calculated by sources of evidence that could reflect the students’ ability, such as previous results in school, in combination with teacher assessed grades (Morgan, 2020). While not necessarily significant in an analysis of Pupil Premium, the effect that this may have on the attainment gap would be of interest to inspect. Teachers’ unconscious biases against some student groups may perpetuate an attainment gap based on FSM eligibility, gender, ethnicity or SEN. This could, in theory, isolate some of the social aspects that can not necessarily be captured by any econometric analysis and could be applied to any further studies into different types of attainment gaps.
22
R
EFERENCESAPPG – All Party Parliamentary Group on Social Mobility. (2019) Closing the Regional
Attainment Gap. Available at
https://www.suttontrust.com/wp-content/uploads/2019/12/APPG-2019.pdf [Accessed Feb 17. 2020]
Babad, E., Inbar, J., Rosenthal, R. (1982). Pygmalion, Galatea, and the Golem: Investigations
of biased and unbiased teachers. Journal of Educational Psychology, 74, 459–474.
Bramley, T., Vidal Rodeiro, C.L., & Vitello, S. (2015). Gender differences in GCSE. Cambridge Assessment Research Report. Cambridge, UK: Cambridge Assessment.
Central Advisory Council for Education (1967) Children and their Primary Schools. The Plowden Report. London: HMSO.
Connolly, P. (2006). The effects of social class and ethnicity on gender differences in GCSE
attainment: a secondary analysis of the Youth Cohort Study of England and Wales 1997–
2001. British educational research journal, 32(1), 3-21.
Crawford, C., MacMillan, L. and Vignoles, A. (2014). Progress made by high attaining
children from disadvantaged backgrounds. Social Mobility and Child Poverty Commission
Demack, S., Drew, D. and Grimsley, M. (2000) Minding the Gap: Ethnic, gender and social
class differences in attainment at 16, 1988‐95, Race Ethnicity and Education, 3:2, 117-143
Demanet, J., and Van Houtte, M. (2011). Social-Ethnic School Composition and School
Misconduct: Does Sense of Futility Clarify the Picture Sociological Spectrum 31 (2): 224–256
Department for Education. (2013). Evaluation of Pupil Premium, Research Brief. [Report]
Available at https://www.gov.uk/government/publications/evaluation-of-pupil-premium
23
Department for Education. (2020) Pupil Premium. [Online] Available at
https://www.gov.uk/government/publications/pupil-premium/pupil-premium [Accessed Apr.
21 2020]
Education Endowment Foundation. (2018) The Attainment Gap. [Report] Available at
https://educationendowmentfoundation.org.uk/evidence-summaries/attainment-gap/
[Accessed Mar 7. 2020]
Feinstein, L., Duckworth, K. and Sabates, R. (2004) A model of the intergenerational
transmission of educational success. Centre for the Wider Benefits of Learning
Gazeley, L. and Dunne, M. (2007) Researching class in the classroom: addressing the social
class attainment gap in Initial Teacher Education, Journal of Education for Teaching, 33:4,
409-424
Gillborn, D. and Mirza, H. (2000). Educational inequality: mapping race, class and gender, London: Office for Standards in Education
Goldthorpe, J.H. and Jackson, M. (2004). Education based meritocracy: The barriers to its
realization.
Gorard, S. (2016) 'A cautionary note on measuring the pupil premium attainment gap in
England.', British journal of education, society and behavioural science., 14 (2). pp. 1-8.
Gujurati, D. (2003). Basic Econometrics. 4th edition. Boston: McGraw-Hill. Pp. 320-351
Hayward, H., Hunt, E. and Lord, A. (2014). The economic value of key intermediate
qualifications: estimating the returns and lifetime productivity gains to GCSEs, A levels and apprenticeships. 1st ed. [Research report] Department of Education.
Hutchinson, J. and Dunford, M. (2016). Divergent Pathways: the disadvantage gap,
24
Kao, G., and J. S. Thompson. 2003. “Racial and Ethnic Stratification in Educational Achievement and Attainment.” Annual Review of Sociology 29(1): 417–442.
Kingdon, G., and R. Cassen. 2010. Ethnicity and Low Achievement in English Schools. British Educational Research Journal 36(3): 403–431
Knowles, E. and Evans, H. (2012) PISA 2009: How does the social attainment gap in England
compare with countries internationally? London: DFE
Morgan, I., 2020. Issuing Grades For Qualifications Summer 2020. [online] Wjec.co.uk.
Available at: www.wjec.co.uk/articles/issuing-grades-for-qualifications-summer-2020/
[Accessed 16 May 2020]
National Audit Office. (2015) Funding for Disadvantage Students. Available at
https://www.nao.org.uk/report/funding-for-disadvantaged-pupils/ [Accessed Mar 2. 2020]
PricewaterhouseCoopers. (2009). The future of UK manufacturing: Reports of its death are
greatly exaggerated. Available at https://www.pwc.co.uk/assets/pdf/ukmanufacturing-300309.pdf [Accessed Apr. 27 2020]
Saunders, P. (1997). Social mobility in Britain: An empirical evaluation of two competing
theories. Sociology, 31(2): 261–88
Social Exclusion Taskforce (2008) Aspiration and attainment amongst young people in
deprived communities. Department for Communities and Local Government, Department for
Children, Schools and Families
Social Mobility Commission. (2019) The State of the Nation 2018-19: Social Mobility in Great
Britain. Available at
https://www.gov.uk/government/publications/social-mobility-in-great-britain-state-of-the-nation-2018-to-2019 [Accessed Jan 28. 2020]
StatsWales. (2019). Gender pay difference in Wales by year. [Online] Available at
25
StatsWales. (2020). Key Stage 4 Interim Measures by FSM, from 2018/19. [Online] Available
at https://statswales.gov.wales/v/Ha7F [Accessed Feb 15. 2020]
Strand, S. (2014) Ethnicity, gender, social class and achievement gaps at age 16:
intersectionality and ‘getting it’ for the white working class, Research Papers in Education,
29:2, 131-171
Sutton Trust. (2010). The Mobility Manifesto. [Research report] Available at
https://www.suttontrust.com/wp-content/uploads/2019/12/120100312_mobility_manifesto2010-3.pdf [Accessed Apr 03. 2020]
Themelis, S. (2008) Meritocracy through education and social mobility in post‐war Britain: a
critical examination. British Journal of Sociology of Education, 29:5, 427-438,
Welsh Government. (2014) Free School Meals in Wales: Information for Schools. Available
at
https://gov.wales/sites/default/files/publications/2019-03/free-school-meals-in-wales-information-for-schools.pdf [Accessed Apr 25. 2020]
Willis, P (1977). Learning to Labour: How Working Class Kids Get Working Class Jobs, Westmead, Farnborough: Saxon House.
iv
A
PPENDICESAppendix A - Figure - Eligibility for FSM
Figure 4. Eligibility for Free School Meals (2008-2019)
Appendix B - Figure Unemployment rate, Wales
Figure 5 – Unemployment rate in Wales (2008-2019)
0 2 4 6 8 10 2008 2009 2010 2011 2012 2013 2014 2015 2016 2017 2018 2019 Unem pl o ym ent rat e (%) Years
Unemployment in Wales
0.0% 5.0% 10.0% 15.0% 20.0% 2008 2009 2010 2011 2012 2013 2014 2015 2016 2017 2018 2019 yearEligbility for FSM
v
Appendix C – Figure - Estimated lifetime productivity returns
Figure 6. Estimated lifetime productivity returns to achieving GCSEs at A*-C as highest qualification. Source: Hayward, H., Hunt, E. and Lord, A. (2014) for the Department of Education
Appendix D– Figure GCSE attainment by FSM and ethnicity, England
Figure 7. Attainment 8 score by ethnicity and eligibility for free school meals, England (2017/18). Source: Ethnicity Facts and Figures GOV.UK
Attainment 8 measures the achievement of a pupil across 8 qualifications including Mathematics and English. And has been used as a measure of pupil success in England since 2016.
vi
Appendix E- Model specification Hausman Test:
𝐻0: Random Effect Model is suitable
𝐻1: Random Effect Model is not suitable; the alternative is to use the Fixed Effect Model.
Table 6. Hausman Test output for the Relative Gap
TEST SUMMARY CHI-SQ STATISTIC CHI-SQ D.F. PROBABILITY
Cross section random 1.0923 2 0.5791
As the p-value is above our 5% level of significance (0.2522>0.05), we reject the null hypothesis and conclude that the Random Effect Model is suitable for testing the Relative Gap.
Table 7. Hausman Test for the Absolute Gap
TEST SUMMARY CHI-SQ STATISTIC CHI-SQ D.F. PROBABILITY
Cross section random 6.3716 4 0.1731
As the p-value is above our 5% level of significance (0.1552>0.05), we reject the null hypothesis and conclude that the Random Effect Model is suitable for testing the Absolute Gap.
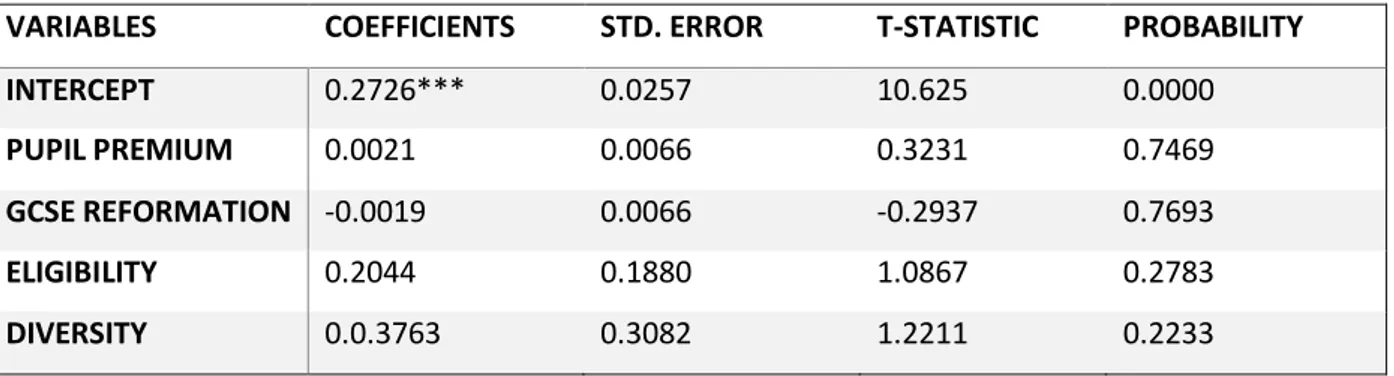
FEM output:
𝐴𝐺𝑖𝑡= 𝛽0𝑖+ 𝛽1𝑃𝑃𝑖𝑡+ 𝛽2𝐺𝑅𝑖𝑡+ 𝛽3𝐸𝐺𝑖𝑡+ 𝛽4𝐷𝑉𝑖𝑡+ 𝛼𝑖+ 𝑢𝑖𝑡 𝑅𝐺𝑖𝑡= 𝛽0𝑖+ 𝛽1𝑃𝑃𝑖𝑡+ 𝛽2𝐺𝑅𝑖𝑡+ 𝛽3𝐸𝐺𝑖𝑡+ 𝛽4𝐷𝑉𝑖𝑡+ 𝛼𝑖+ 𝑢𝑖𝑡
where 𝛼𝑖 defines the local authority area’s fixed effect and 𝑢𝑖𝑡 is the idiosyncratic error term.
Table 8. Fixed effect regression model – results for the absolute attainment gap
VARIABLES COEFFICIENTS STD. ERROR T-STATISTIC PROBABILITY
INTERCEPT 0.2726*** 0.0257 10.625 0.0000 PUPIL PREMIUM 0.0021 0.0066 0.3231 0.7469 GCSE REFORMATION -0.0019 0.0066 -0.2937 0.7693 ELIGIBILITY 0.2044 0.1880 1.0867 0.2783 DIVERSITY 0.0.3763 0.3082 1.2211 0.2233 ***/**/* significance level of 1%/5%/10%. Total panel (unbalanced) observations: 255 Cross-sections included: 22
Periods included: 12 R squared: 0.3584 Adj. R squared: 0.2884
vii
The difference between FEM and REM models for the absolute attainment gap is that for the REM Pupil Premium and the diversity variable come back as having a significant effect.
Table 9. Fixed effect regression model – results for the relative attainment gap
VARIABLES COEFFICIENTS STD. ERROR T-STATISTIC PROBABILITY
INTERCEPT 0.5562*** 0.0450 12.3543 0.0000 PUPIL PREMIUM -0.0825*** 0.0116 -7.1329 0.0000 GCSE REFORMATION -0.0059 0.0116 -0.5051 0.6140 ELIGIBILITY 0.2288 0.3300 0.6934 0.4887 DIVERSITY 0.4248 0.5409 0.7854 0.4330 ***/**/* significance level of 1%/5%/10% Total panel (unbalanced) observations: 255 Cross-sections included: 22
Periods included: 12 R squared: 0.3989 Adj. R squared: 0.3332
The difference between FEM and REM is that for the relative attainment gap, REM finds eligibility a to be significant.
Appendix F – Pedroni Residual Cointegration Test
Null hypothesis: No cointegration
Trend assumption: No deterministic trend
Automatic lag length selection based on SIC with lags from 0 to 1
Table 10. Alternative hypothesis: common AR coefs. (within-dimension)
STATISTIC PROB. WEIGHTED STAT. PROB.
PANEL V-STATISTIC -0.2876 0.6132 -0.2990 0.6175
PANEL RHI-STATISTIC 0.2539 0.6002 -1.6076 0.5040
PANEL PP-STATISTIC -1.0938 0.1370 -3.8546*** 0.0001
PANEL ADF-STATSTIC -2.1079** 0.0175 -3.6828*** 0.0001 ***/**/* significance level of 1%/5%/10%.
Table 11. Alternative hypothesis: individual AR coefs. (between-dimension)
STATISTIC PROB.
GROUP RHO-STATISTIC 0.2988 0.6175
GROUP PP-STATISTIC -3.3492*** 0.0004
GROUP ADF-STATISTIC -2.9440*** 0.0016
***/**/* significance level of 1%/5%/10%.
In this test for cointegration, 6 out of the 11 tests cannot reject the null hypothesis at a 5% significance level. On these results we can assume that there is not cointegration between the absolute attainment gap and the diversity variable.
viii
Appendix G – Random Effect Model – Absolute attainment gap, first difference
Table 12. Random effect regression model – results for the absolute attainment gap when the variables (inclusive of explanatory) have been first differenced
VARIABLES COEFFICIENTS STD. ERROR T-STATISTIC PROBABILITY
INTERCEPT 7.20E-05 0.0043 0.0169 0.9865 D(PUPIL PREMIUM) 0.0022 0.0134 0.1658 0.8684 D(GCSE REFORMATION) 0.0055 0.0127 0.4281 0.6690 D(ELIGIBILITY) 0.0207 0.2300 0.0901 0.9283 D(DIVERSITY) 0.5670 0.4425 1.2814 0.2014 ***/**/* significance level of 1%/5%/10%. Total panel (unbalanced) observations: 255 Cross-sections included: 22
Periods included: 12 R squared: 0.0082 Adj. R squared: -0.0095
If the data were cointegrated this would be a potential remedy. The table does not show any significant results in this case.