Linköping Studies in Science and Technology.
Licentiate No. 1174
Towards a Road Safety Development Index (RSDI)
Development of an International Index to Measure
Road Safety Performance
Ghazwan Al Haji
Department of Science and Technology
Campus Norrköping, Linköping University
SE-601 74, Norrköping, Sweden
LIU-TEK-LIC-2005:29 ISBN 91-85299-70-7 ISSN 0280-7971© Ghazwan Al Haji, 2005
Thesis Number: LIU-TEK-LIC-2005:29 ISBN: 91-85299-70-7
ISSN: 0280-7971 Printed by:
UniTryck, Norrköping, Sweden, 2005 Distributed by:
Linköping University
Department of Science and Technology (ITN) Campus Norrköping
SE-601 74, Norrköping, Sweden Tel: +46 11 36 30 00
To my parents, my wife, and my sweet little boy Aghyad
with deep love and appreciation
“…Road safety is no accident, the theme for this year’s World Health Day, reminds us that road safety does not happen by chance. Achieving and sustaining safety on the roads requires deliberate action from many sectors of society…”.
Kofi Annan’s Secretary-General of the United Nations Message on the World Health Day, observed 7 April/2004 The United Nations, News Centre- Press Releases- SG/SM/9224 OBV/415
Linköpings Studies in Science and Technology Licentiate Thesis No. 1174
Towards a Road Safety Development Index (RSDI)
Development of an International Index to
Measure Road Safety Performance
Ghazwan Al HajiABSTRACT
im. This study suggests a set of methodologies to combine different indicators of road
safety into a single index. The RSDI is a simple and quick composite index, which may become a significant measurement in comparing, ranking and determining road safety levels in different countries and regions worldwide. Design. One particular concern in designing a Road Safety Development Index (RSDI) is to come up with a comprehensive set of exposure and risk indicators which includes as far as possible the main parameters in road safety related to human-vehicle-road and country patterns instead of considering few and isolated indicators such as accident rates. The RSDI gives a broad picture compared to the traditional models in road safety. Challenges. The differences in definitions, non-collection of data, no reliability of data and underreporting are problems for the construction of RSDI. In addition, the index should be as relevant as possible for different countries of the world, especially in developing countries. Empirical study. This study empirically compares the road safety situation and trends between ten Southeast Asian countries and Sweden for the period 1994- 2003. Methodologies. Eleven indicators are chosen in RSDI, which have been categorised in nine dimensions. Four main approaches (objective and subjective) are used to calculate RSDI and determine which one is the best. One approach uses equal weights for all indicators and countries, whereas the other approaches give different weights depending on the importance of indicators. Findings. The thesis examines the RSDI for the ten ASEAN countries and Sweden in 2003. The results from this study indicate a remarkable difference between ASEAN countries even at the same level of motorisation. Singapore and Brunei seem to have the best RSDI record among the ASEAN countries according to the indicators used, while Laos, Cambodia and Vietnam show lower RSDI records. Conclusions. The RSDI results seem very promising and worth testing further applications with bigger samples of countries and from different parts of the world.
Key Words: Road safety, RSDI, ASEAN, international comparisons, Human Development
Index, ranking, principal components, composite indicators, macro-performance indicators, macro- models.
Department of Science and Technology Campus Norrköping, Linköping University
SE-601 74, Norrköping, Sweden Norrköping 2005 ISBN 91-85299-70-7
Licentiate No. 1174
Acknowledgments
uring my stay at Linköping University at the Department of Science and Technology (ITN), I have had the opportunity to work on many interesting research projects and the opportunity to meet many local and international colleagues, friends and others who have helped me along the way of research either directly or indirectly. I am especially grateful to the following persons:
First and foremost, my deepest gratitude is to my thesis advisor, Prof. Kenneth Asp, for his invaluable support, gentle encouragement and advice during my doctoral studies, and long before during my master’s study. I consider myself fortunate to work under his direction and benefit from his broad international experience. Thank you for giving me this great opportunity to work on this interesting area of road safety and these international projects. I would also like to thank you for giving me the freedom to develop my own ideas and learn from my mistakes.
Next, I would like to express my special thanks to Dr. Per Lindskog, my colleague, travel companion during the ASNet project and my good friend, for being so supportive in general over the recent work together. It has always been a pleasure working with you and to listen to your remarkable direct and depth overview of the subject. I also liked your discussions on geographical and social knowledge and how you incorporate them into the field of road safety e.g. “No democracy on road traffic”, “War on roads”, etc. I appreciate your comments on my thesis. Thank you also for our joint paper to the International Conference in Brazil.
I am deeply grateful to Prof. Kåre Rumar who is, nationally and internationally, a well-known expert in the field of road safety, for his inspiring ideas and fruitful discussions, especially during the RetsNet project work and during my MSc thesis. I still remember bugging him with many questions during the RetsNet work. Our discussions were an important source of inspiration and knowledge to this study. Your publications were also very useful for this study. In spite of your retirement, you have always had time to come and give valuable lectures (materials) to the new MSc students, which proved to be highly appreciated by the students.
My appreciation goes to my other projects members and my close colleagues. To Ing-Marie Eriksson for everything administrative and her central role in promoting the team projects in general, thank you for the conferences we attended together in Bahrain and Malaysia. To Malin Eriksson (my office mate) for making a pleasant work environment at office and helping me in some programming and e-learning technologies. To Johanna Emilsson for always being online and keeping the virtual classrooms happy
D
and alive. Thanks to all of you not just for being on the team but for all of your guidance and assistance.
Åke Sivertun from the Department of Computer and Information Science (IDA) deserves a special mention for his skilled, knowledgeable and friendly manner. It was a pleasure for me to work with you in the Spider project. You made the travel abroad more pleasant and valuable. I would also like to thank Arne Karyd, my office mate. I am pleased that I have been surrounded by knowledgeable and friendly people.
I want to thank all the staff from the programme of Communication and Transport Systems (CTS) for your kind help, though too many to mention you all by name. I would also like to thank the research administrators and directors of the ITN department for your great help; I have found, in all your offices, kind and generous cooperation, for which I am very grateful. Many thanks to Ivan Rankin for proofreading the manuscript and improving the English language that contributed to the final copy. Thanks also to Zaheer Ahmed for your editing suggestions to the earlier drafts of this thesis manuscript. However, the responsibility of the final text is certainly mine alone.
This thesis has also profited from the collaboration with international institutions such for instance ADB (Asian Development Bank) and GRSP (Global Road Safety Partnership). I have enjoyed knowing them and working with them. I would specifically like to mention the following consultants and specialists: Charles M. Melhuish (ADB), Alan Ross (ADB), Michael Goodge (ADB), David Silcock (GRSP) and Andrew Downing (GRSP). Thanks for our joint work and for kind cooperation. Thanks Alan for sharing data and useful documents related to ASEAN countries with me. My thanks also go to several people from overseas with whom I have had the opportunity to meet through the projects like: RetsNet, ASNet, TechTrans and Spider. Thanks for making our work together interesting, enjoyable and valuable.
I sincerely thank all the master students and graduated master’s students from the program (Traffic Environment and Safety Management). I wish them all the best in their careers. I also would like to mention all my friends, thanks for your support and enjoyable time.
My deepest gratitude and love go to my family in Damascus/Syria, Dad, Mom, brothers/sisters for supporting me at all times. I express my sincere thanks to my older sister Nadia for her warm-heartedness and frequent contact, which always have made me feel at home. Last, but certainly not least, I thank my beloved wife Mai for her patience, encouragement and support. Thanks for always being there. Thanks for commenting and reading my texts. The least thing I can do is to dedicate this work to you. My final thanks go to my son Aghyad, the little angel who brought joy and happiness to our world. Thanks for giving me a reason to stop working, to wake up every day quite early and to watch Bolibompa (Kids TV program in Sweden) with you. Ghazwan Al Haji
Norrköping, Sweden May 2005
List of Abbreviations
ADB Asian Development Bank ASEAN Southern Asian Nations
ASNet Regional Traffic Safety Network to Ten South East Asian Countries DC Developing Country
EU European Union
GDP Gross Domestic Product Globesafe Globe Road Safety Database GRSP Global Road Safety Partnership HDC Highly Developed Country HDI Human Development Index HMC Highly Motorised Country IRF International Road Federation LMC Low Motorised Country
NGO Non-Governmental Organisation
OECD Organisation For Economic Cooperation and Development RetsNet Regional Traffic Safety Network to Five African Countries RSDI Road Safety Development Index
SIDA The Swedish International Development Agency SPIDER The Swedish Program for ICT in Developing Regions
TechTrans Developing E-learning Courses in Road Safety to Russian Universities UNDP United Nations (Development Program)
VRU Vulnerable Road Users
WB World Bank
WDI World Development Indicators, World Bank WHO World Health Organisation
Table of Contents
ABSTRACT ...V ACKNOWLEDGMENTS ...VII LIST OF ABBREVIATIONS ... IX LIST OF FIGURES ...XIII LIST OF TABLES ... XIV
CHAPTER 1: INTRODUCTION ...1
1.1 RELATION TO PREVIOUS WORK...1
1.2 PURPOSE OF THE STUDY...3
1.3 TARGET OF THE STUDY...3
1.4 APPROACH AND THESIS OVERVIEW...3
1.5 TERMINOLOGY...4
CHAPTER 2: ROAD SAFETY IS A GLOBAL ISSUE...7
CHAPTER 3: THE THEORETICAL FRAMEWORK OF MACRO-INDICATORS/MODELS ....11
3.1 THE QUANTITATIVE RELATIONSHIP BETWEEN RISK, EXPOSURE AND SAFETY...11
3.1.1 What are the Exposure, Risk and Consequences?...12
3.1.2 Correlation between the quantified macro-factors and road accidents ...15
3.2 MACRO-INDICATORS OF PERFORMANCE IN ROAD SAFETY...20
3.2.1 The macro-performance indicators in road safety and their purposes...21
3.2.2 Criteria for selecting macro-performance indicators in road safety...22
3.2.3 Sample of survey and the multidimensional index...23
3.2.4 Quantitative versus qualitative indicators...23
3.2.5 IT supports the macro-performance indicators ...24
3.2.6 Several types of indicators ...24
3.3 MACRO-MODELS FOR DESCRIBING, COMPARING AND FORECASTING THE ROAD SAFETY DEVELOPMENT INTERNATIONALLY...28
3.3.1 Linking motorisation, traffic risk and personal risk...28
3.3.2 Linking traffic risk, motorisation and personal risk with time...34
3.3.3 Other macro-models for international comparisons with many other variables involved..36
3.3.4 Summary ...37
3.4 ACCIDENT DATA UNDER-REPORTING AND CORRECTION FACTOR...38
CHAPTER 4: A COMPARATIVE STUDY OF ROAD SAFETY IN ASEAN COUNTRIES...41
4.1 BACKGROUND OF THE ADB-ASEAN-ASNET PROJECT ...41
4.2 DATA SOURCES...42
4.3 NATURE AND CHARACTERISTICS OF ROAD SAFETY SITUATION IN ASEAN COUNTRIES...42
4.4 MOTORCYCLE SAFETY IN ASEAN COUNTRIES...44
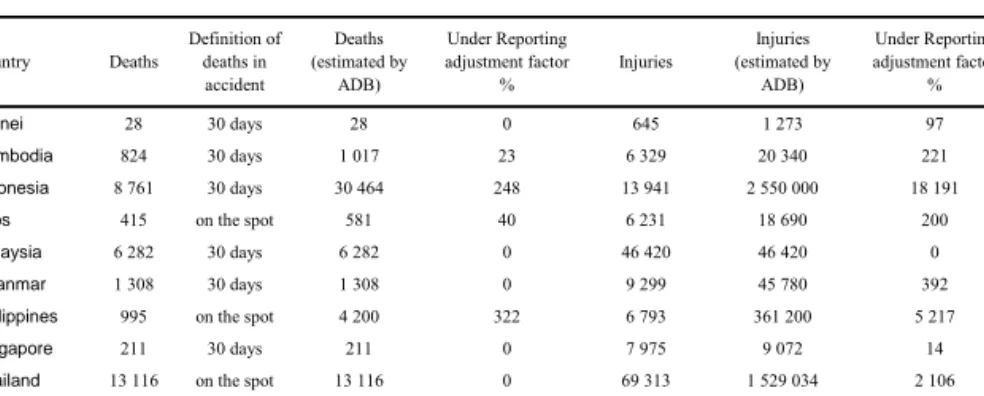
4.5 THE IMPORTANCE OF GOOD DATA AND REPORTING IN ASEAN COUNTRIES...46
4.6 ACCIDENT RATES IN ASEAN COUNTRIES...48
4.6.1 How to compare traffic safety in ASEAN countries ...49
4.6.2 Motorisation ...50
4.6.3 Traffic risk ...50
4.6.4 Personal risk...52
4.6.6 Traffic risk and urbanisation ...55
4.6.7 Severity Index ...55
4.7 FINAL COMMENTS AND SUMMARY...55
CHAPTER 5: ROAD SAFETY DEVELOPMENT INDEX (RSDI) ...57
5.1 THE EXPECTED BENEFITS OF USING RSDI ...58
5.2 SOURCES OF DATA...59
5.3 RSDI QUALITY CRITERIA...59
5.4 METHODOLOGIES USED IN RSDI CONSTRUCTION...60
5.4.1 Finding the best indicators to be added in RSDI...61
5.4.2 Normalising (standardising) the indicators...67
5.5 WEIGHTING THE VARIABLES...70
5.6 COMBINING THE CHOSEN INDICATORS INTO RSDI BY USING DIFFERENT TECHNIQUES...70
5.6.1 Approach 1: Using Simple Average...71
5.6.2 Approach 2: Expert Judgements ...74
5.6.3 Approach 3: Based on theories for each indicator...75
5.6.4 Approach 4 Principal Components Analysis (PCA)...78
5.7 COMPARISONS OF THE RSDI APPROACHES...82
5.8 RSDI IS LOOKING FORWARD...84
5.9 CONCLUDING REMARKS...84
CHAPTER 6: CONCLUSIONS AND FUTURE WORK ...85
REFERENCES...90
APPENDIX. 1: BASIC MACRO-INDICATORS IN ASEAN COUNTRIES AND SWEDEN ...97
List of Figures
FIGURE 1.1: STRUCTURE OF THE THESIS...4
FIGURE 2.1: MOTORISATION, PERSONAL RISK AND TRAFFIC RISK IN DIFFERENT REGIONS...8
FIGURE 3.1: ROAD SAFETY PROBLEM DESCRIBED BY THE THREE DIMENSIONS CUBE...14
FIGURE 3.2: THE PYRAMID OF ROAD SAFETY INDICATORS AND LEVELS OF PERFORMANCE...21
FIGURE 3.3: HIERARCHY OF CATEGORIES AND INDICATORS (TOP-DOWN APPROACH) ...25
FIGURE 3.4: MOTORISATION AND FATALITIES RATE (BASED ON SMEED’S FORMULA) ...29
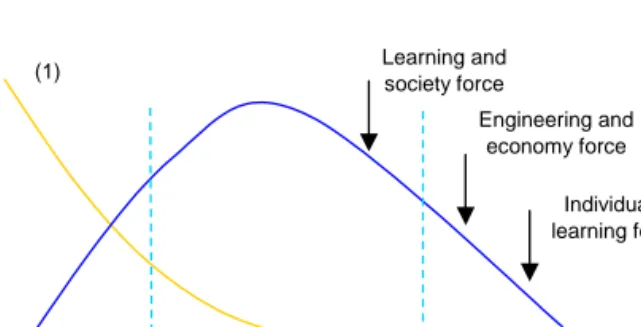
FIGURE 3.5: THE INFLUENCING FACTORS ON THE DEVELOPMENT CURVE OF ROAD SAFETY...30
FIGURE 3.6: ROAD SAFETY DEVELOPMENT IN HDCS...31
FIGURE 3.7: ROAD SAFETY DEVELOPMENTS OVER TIME FOR DEVELOPING COUNTRIES...32
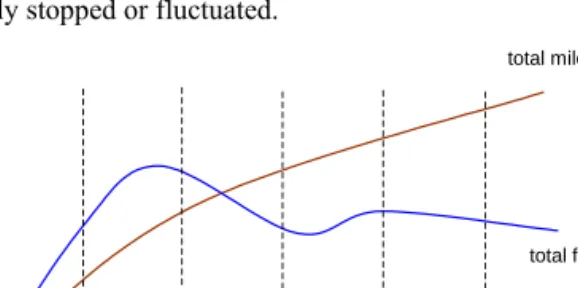
FIGURE 3.8: TOTAL FATALATIES BASED ON THE DEVELOPMENT OF MIBILITY...32
FIGURE 3.9: TRAFFIC RISK AND PERSONAL RISK DEVELOPMENT...33
FIGURE 3.10: THREE-DIMENSION MODEL OF MOTORISATION AND FATALITY RATES...33
FIGURE 3.11: ILLUSTRATION OF ROAD SAFETY PROFILE (ASP & RUMAR, 2001) ...37
FIGURE 4.1: PROGRESSION OF THE ASEAN COUNTRIES ACCORDING TO THE TRAFFIC RISK INDICATOR..51
FIGURE 4.2: TRAFFIC RISK AND MOTORISATION FOR ASEAN COUNTRIES 2003 ...53
FIGURE 4.3: PERSONAL RISK AND MOTORISATION FOR ASEAN COUNTRIES 2003...54
FIGURE 4.4: TRAFFIC RISK AND URBANISATION FOR ASEAN COUNTRIES 2003...55
FIGURE 5.1: COMPONENTS OF RSDI ...65
FIGURE 5.2: THE CORRELATION BETWEEN DIFFERENT NORMALISATION METHODS...69
FIGURE 5.3. THE OUTCOME DIFFERENCES ON ROAD SAFETY DIMENSIONS ...72
FIGURE 5.4: THE THREE RSDI GROUPS OF ASEAN COUNTRIES AND SWEDEN...73
FIGURE 5.5: THE RELATIONSHIP BETWEEN RSDI AND HDI...74
FIGURE 5.6: PERCENTAGE OF THE MAJOR FACTORS CONTRIBUTING TO ROAD ACCIDENTS ...76
FIGURE 5.7: AN ILLUSTRATION OF THE DIFFERENCES BETWEEN VARIOUS DIMENSIONS...77
FIGURE 5.8: SCORE PLOT OF THE NEW SCORES OF PCA IN ASEAN COUNTRIES & SWEDEN...80
List of Tables
TABLE 3.1: FACTORS INFLUENCING EXPOSURE, RISK AND CONSEQUENCES...19
TABLE 3.2: THE SETS OF MACRO ROAD SAFETY INDICATORS AND CHARACTERISTICS...27
TABLE 4.1: MOTORCYCLES AND OTHER SOCIOECONOMIC VARIABLES IN ASEAN COUNTRIES 2002...45
TABLE 4.2: THE ESTIMATED NUMBERS OF DEATHS AND INJURIES IN ASEAN (YEAR 2003)...47
TABLE 4.3: ACCIDENT RATES OVER A PERIOD 1994-2003 IN ASEAN COUNTRIES...49
TABLE 5.1: THE SELECTED INDICATORS WILL BE USED IN THE ANALYSIS OF RSDI ...66
TABLE 5.2: TRAFFIC RISK AS AN EXAMPLE OF USING DIFFERENT NORMALISATION TECHNIQUES...69
TABLE 5.3. THE SUBJECTIVE WEIGHTING RESULTS IN A NUMERICAL SCALE OF RSDI ...75
TABLE 5.4: EIGENVALUE ANALYSIS OF THE COVARIANCE MATRIX OF STANDARDISED VALUES...79
TABLE 5.5: THE ADJUSTMENT PROCEDURES OF PCA WEIGHTS TO MATCH THE SCALE OF THE RSDI...81
1 Chapter 1: Introduction
Chapter
1
Introduction
The purpose of this chapter is to briefly present the outline of this thesis as well as explaining the reasons why this study is of interest. A brief description of the concept of ‘Road Safety Development Index’ (RSDI) is given and the aim of the study is highlighted. In addition, this chapter outlines the structure of the thesis.
1.1 Relation to previous work
uring the last few years, I have worked on a variety of international projects focusing on road safety development in developing countries. One of the most important lessons I have learned is that the concept of Road Safety Development is broader and more complex than what I have learned in theory during my undergraduate years and master’s study. I now realise how much this development in road safety requires deeper processes, integrated programs and much more cooperation between all the key bodies, which are responsible for road safety in the country. Road safety concerns everyone and all aspects of life.
My master’s thesis (Al Haji, 2001) dealt with the extension of one project called RetsNet ‘Regional Traffic Safety Network’. At that time, the primary purpose of this project was to strengthen the cooperation and technology transfer in road safety between five south African1 countries and Sweden. The project was successful in bringing these countries together and sharing experience. More recently, I have been involved in several overseas projects; these are the ASNet project, TechTrans project, and SPIDER project. The ASNet project ‘The ASEAN Road Safety Network’ started in November 2003. It is designed as an Internet networking system and devoted to the Southern Asian Nations (ASEAN)2 professionals and institutions. The ASNet members can discuss
issues affecting the road safety field and exchange expertise in the region as efficiently and widely as possible.
1 This refers to the countries: Botswana, Malawi, Namibia, South Africa and Zimbabwe
2 ASEAN countries are: Brunei, Cambodia, Indonesia, Laos, Malaysia, the Philippines, Singapore, Thailand, Vietnam
and Myanmar
D
The TechTrans project started in December 2003. It aims to establish a sustainable virtual resource centre at the State Technical University (MADI) in Moscow, Russia. This project developed e-learning courses and applications in the field of road safety to Russian universities. The other project that I am currently working on is called the SPIDER project ‘The Swedish Program for ICT in Developing Countries’. This project aims to create programmes and applications for higher education adapted to the needs of developing countries. The project focuses on three developing countries for cooperation with: Burkina Faso, Sudan and Vietnam.
During these overseas experiences and our visits to different countries, I had the opportunity to discuss road safety development with local professionals and consultants. There I also had the opportunities to attend various conferences, seminars and workshops and to listen to experts from different countries. This was a rewarding learning experience, which was especially meaningful for me in terms of future contacts. There were always questions raised during this work, for instance, how do we define and measure road safety development in a country? How do we determine the progress this country has achieved? How do we establish targets for road safety improvement in a country? Until now, there is no simple answer to these questions. This has inspired me to develop sets of macro-indicators that can be used as appropriate benchmarks to compare the performance of different countries. I started to use previous results of the projects as a point of departure, in order to build a model from the conclusions drawn.
By keeping this goal, some two years ago. I, together with my advisor3, met
representatives of many departments and organisations in Sweden, such as the Swedish International Development Agency (SIDA)4, World Health Organisation (WHO)5 and Karolinska Institute6 where we have introduced a new concept of road safety
performance, which we called RSDI ‘Road Safety Development Index’. We emphasised the broader concept of road safety development more than the accident rates that are currently used.
To address national development in the area of road safety, it is desirable to view road safety level in a global context. Road safety is a complex issue and there is a high number of factors and indicators involved in the accidents. This situation leads me to examine several theories and models in order to compare the achievements in road safety between different countries and regions. The problem itself is underestimated in many countries, especially in developing countries where the issue is challenging. The progress in any country will be minimum unless the country has a good and standard measurement to rely on (e.g. RSDI), in comparisons and problem formulation.
3 Kenneth Asp (Professor), Linköping University, Sweden. E-mail address: kenas@itn.liu.se; Tel: +46 11 363497 4 SIDA website: http://www.sida.se (last accessed 2005-05-15)
5 WHO website: http://www.who.int/en (last accessed 2005-05-15)
1.2 Purpose of the study
The purpose of this study is to integrate and summarise much information and knowledge about road safety into measurable indicators, which will be then converted into a single value. The study develops methodologies and approaches for constructing RSDI. This will allow RSDI to make a direct comparison and will rank road safety progress internationally. Therefore, RSDI is capable of increasing the awareness of road safety problems among the public and policy makers. This information will help a country’s policy makers to take appropriate decisions, setting targets and priorities for the future. The RSDI is developed to be as simple and easily understandable by ordinary people as possible. I believe that over time, the RSDI index I am developing in this study will be useful for road safety research. It may become a significant index in ranking and determining road safety levels worldwide.
1.3 Target of the study
By constructing the RSDI, the road safety level of different countries can be compared directly. This will be useful for researchers who have an interest in working on international comparisons and analysis. It will also be of interest to governments and international organisations to refer to the RSDI index since it will show the scale of the problem that they were perhaps not aware of. Other targets of this research are the country policy makers and ordinary persons. This index will help them to understand the magnitude of the problem and to draw attention to this phenomenon.
1.4 Approach and thesis overview
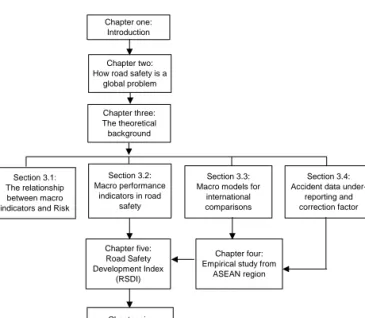
There are several steps involved in this study in constructing the RSDI as illustrated in Figure 1.1 that are organised into six chapters, with the relations between different chapters and sections. I begin in chapter two by showing the scope of road safety problem worldwide and how it concerns every country. Then in chapter three I provide a theoretical background of all the factors that could contribute to road accidents by showing the relationship between each factor and the probability that road accidents may happen from the macro-level. Following this, the key macro-performance indicators will be identified. These indicators should be easy, available, measurable and comparable worldwide. This leads me to make a comparative review of macroscopic models and methodologies used in describing and comparing road safety development internationally. This will support the theoretical framework of the RSDI index. In chapter four, I gather data regarding the identified macro-indicators and apply some of the previous models to this data. The empirical (case) study comes from ten Southeast Asian countries (ASEAN region). Chapter five is a more practical part where I assess the importance of the chosen indicators and then I discuss different approaches in normalising (standardising) the variables and weighting them. I combine the weighted indicators into the index (RSDI) by using different techniques. This will include an application of RSDI to ASEAN countries and I perform an analysis of the results. In
chapter six the conclusions are drawn from the previous discussion and moreover an indication of future work is given. The appendix concluding the thesis gives the overall data of the case study and indicators used in calculating RSDI.
Figure 1.1: Structure of the thesis.
1.5 Terminology
There are several terms concerning road safety issues and their applications. It is not possible to give a precise definition of all the terms used in the following chapters. This would run to many pages and discussions. It may be useful for now to go briefly through the key terms that are frequently used and differences from one study to another. Readers should bear in mind that the meaning of each term depends on the context and the subject of discussion.
In this thesis, the term "Road Safety" is often used instead of "Traffic Safety" because this thesis focuses on road traffic safety only including road user safety and vehicle safety. The term “Traffic Safety” is a general term and could refer to the safety of all traffic modes: air traffic, sea, rail and road.
Some studies are not comfortable with the term "accidents" that describes road safety problems as accidents that happen by random chance. They prefer to use the term "crash" instead of accidents. In this thesis, as accidents is a popular term and widely
Chapter one: Introduction
Chapter two: How road safety is a
global problem Chapter three: The theoretical background Section 3.1: The relationship between macro indicators and Risk
Section 3.2: Macro performance
indicators in road safety
Section 3.3: Macro models for
international comparisons
Chapter four: Empirical study from
ASEAN region Chapter five: Road Safety Development Index (RSDI) Section 3.4: Accident data
under-reporting and correction factor
Chapter six: Conclusions and
used, I prefer to keep it. Accidents can be simply classified as fatal, serious, slight and damage only. The term "casualties" means both deaths and injuries.
I used the term "aggregated data" to describe the group of data from a macro and national level e.g. number of injuries in the country, whereas "disaggregated data" refers to detailed information and smaller groups from a micro and local level e.g. number of injuries by age and transport mode.
The distinction between developed and developing countries is a hard matter. The term "developing countries" is rather misleading because all countries are developing today. Developing countries are officially classified on a human development index (according to the United Nations) or on an economic basis. Whether we call this group developing country, less developed countries, underdeveloped countries, third world, south, or other names; there is no precise definition of the term "developing countries". Some international studies, e.g. Jacobs et al. (2000), consider "vehicle ownership" as the most appropriate criteria to define developing countries e.g. "less motorised countries". This term again has no direct meaning; in particular many developing countries have high motorisation levels similar to those of developed countries. Also, the question of whether the number of vehicles can be considered as a sign of development in a country. In contrast, many European countries are currently discussing whether to stop or reduce the increasing level of motorisation. For the purpose of this study and because of the lack of something better, I use the term "Highly Developed Countries" (HDCs), e.g. North America, Western Europe and Japan, and "Less Developed Countries" (LDCs) are the remaining countries.
The term "composite index" is used throughout this thesis to mean the combination of several indicators. The "indicator" itself is a measure derived from variables. In this study the indicator is not any measure and it is normally used to show the level of performance in the country. The indicator can be presented as an average or accident rate. The term "risk" better emphasises the accident rate.
The term e-Learning refers to anything delivered, by electronic technology for the purpose of learning. Internet-based distance education (learning) is often called online learning or e-learning.
2 Chapter 2: Road Safety is a Global Issue
Chapter 2
Road Safety is a Global Issue
The purpose of this chapter is to give a brief overview of the scope of the road accident problem worldwide and how it is a serious problem almost everywhere. Also it aims to show a comparative summary of the road safety situation across different regions over the world.
s the use of motor vehicles is continuously increasing globally, road traffic accidents have become an increasing cause of deaths and injuries. The most recent World Health Organisation (WHO) statistics (Peden M et al., 2004) shows that almost 1.26 million people are killed in road accidents each year worldwide and an additional 50 million people are estimated injured. Nearly half of them are seriously injured or disabled. Due to the unreliability and under-reporting of data in most countries, these figures are still under-estimated. The road traffic injuries ranked currently as the ninth leading cause of the global burden of disease and injury. WHO estimates road accidents will become the world's third leading cause of death by the year 2020 (after heart disease and deaths linked to mental illnesses) if no effective actions and efficient measures are taken.
The road safety problem has seen in many countries as accidents that happen by chance. In the year 2004, road safety received a considerable attention at national and international levels. This was a result, among with other things, from the WHO health day on 17th April. WHO launched a global campaign titled “Road Safety is No
Accident” to raise awareness about road traffic injuries and costs. The message of the campaign indicates that road injuries can be prevented by appropriate countermeasures and policy. However, many efforts still need to be taken to reduce the severity of this problem in the years to come.
Apart from these tragic injury losses, road accidents also lead to serious consequences for family social life and the economy. Annually, the cost of road accidents is between one and three percent of a country's Gross National Product (GNP). In a few developing countries, the cost probably is less than this (one per cent of GNP) but this is still a
major loss for these countries. Developing countries cannot afford such a considerable waste of resources because they need them for their development.
According to one study carried out by TRL (Jacobs et al., 2000), the majority of road deaths and injuries occur in developing and transitional countries, with approximately half of all fatalities in Asia and Pacific. Highly developed countries (HDCs) have sixty percent of the total motor vehicle fleet but they contribute only to fourteen percent of the total global road accident deaths. Trends from these data show that the total number of road fatalities in HDCs has been declining or stabilising during recent decades, whereas the situation in developing countries is particularly severe and the total number of fatalities continues to increase.
Although Asia has the highest proportion of global road fatalities, Africa has the highest road death rate per number of vehicles. Al Haji (2001) performed a comparative study internationally for fatal accidents, motorisation (vehicles per person), personal risk (deaths per person), and traffic risk (deaths per vehicle). Results (Figure 2.1) show that developed countries have the lowest risk records with high motorisation, while Africa has the lowest motorisation with high traffic risk. The South East Asia countries together with Africa and the Middle East have the highest risk of being killed in terms of personal safety. This comparison should not be taken too seriously, since there are differences within the same region concerning motorisation, population, education, health, welfare, GDP, etc. Most recent international comparisons look within similar countries in the same situation of development.
Notes: Motorisation is taken in this figure as the number of vehicles per 100 persons. Personal Risk is fatalities per 100,000 inhabitants.
Traffic Risk is fatalities per 10,000 vehicles. ( ) = Number of selected countries.
Figure 2.1: Motorisation, personal risk and traffic risk in different regions in 1995 (Al Haji, 2001) 0 10 20 30 40 50 60 70
Motorisation Personal Risk Traffic Risk
Developed Countries (5) Eastern Europe (2) South East Asia (5) M iddle East (5) Latin America (3) Africa (6)
It should be emphasised that the majority of road accident victims (injuries and fatalities) in developing countries are the vulnerable road users (pedestrians, cyclists, motorcyclists and non-motorised vehicle (NMV) occupants), whereas car occupants account for most of the victims in high-income countries since there are many people who own cars (Asp et al., 1998). Pedestrians are mostly the main victims anywhere in developing countries, throughout Asia, Africa and the Middle East. In Southeast Asia, a substantial percentage of the victims are cyclists and motorbike riders. Globally, road accidents are the main cause of death in the 15- to 35-year-old age group, which represents a major loss of human resources and productivity in society.
Because of the rapid economic growth, motorisation and urbanisation in developing nations are growing very fast. These create a pressure on the transport infrastructure, which is not sufficient or ready to meet such an increase in the number of vehicles and people. The lack of institutional framework, appropriate engineering, education, and law enforcement are important explanations for the severity of the safety problem in these countries. There is a need to bring together all the key departments, agencies and professionals in an effort to improve road safety in the country.
Nevertheless, there is also a need for a transfer of information and experience between countries for accident prevention and reduction. E-learning techniques are good examples of such a technology transfer and cooperation between countries. Linköping University in Sweden is one of the international institutes, which has taken part in several road safety activities and projects in developing countries (i.e. the ASNet project). Additionally, the Global Road Safety Partnership (GRSP)7, among others, is
an active international agency that facilitates knowledge sharing and delivers several road safety projects to less developed countries.
3 Chapter 3: The Theoretical Framework of Macro-Indicators and
Models in Road Safety
Chapter 3
The Theoretical Framework of
Macro-Indicators and Models in Road Safety
The purpose of this chapter is to give a literature survey of the most important macro factors and concepts in road accidents. It describes the road safety problem as a function of three dimensions (exposure, risk and consequences). The chapter discusses the relationship between different factors and accident risk. This will be useful to choose the most important performance indicators that could be used as benchmarks in international comparisons. I also give a brief literature review of the most important and/or recent macroscopic models in road safety that are used for describing the development in road safety in a country and internationally. Finally, I conclude this chapter with important notes regarding under-reporting of data and the correction factor.
here is a growing interest globally in macroscopic indicators and models in road safety due to the importance they can play in describing the road safety situation in a country, comparing the development and assessing the effect of different measures. This chapter is divided into three main parts. The first part describes the relationship between risk, exposure and safety. The second part identifies the key macro-performance indicators, which will help later in constructing the RSDI index (Chapter 5). The third part provides a review of macro-models that are usually used for comparing the development in road safety in a country and internationally.
3.1 The quantitative relationship between risk, exposure and safety
As young road users represent a high risk in accidents all over the world, we might say that a developing country, which has high proportion of young people of the total population, should have more casualties than those of the developed countries where they have low birth rates as well as an older age group. Similarly, countries with a high proportion of motorcycles or vulnerable road users on roads should have more casualties than those countries where most road users are well protected inside vehicles. In the same context, as rich people are healthier than poor people because they have
better access to hospitals and health services, so we might say that rich countries are healthier (safer) than poor countries. In the same way, one can try to assess the differences between countries in relation to other types of factors such as: weather differences between countries, age of vehicles in a country, the expenditure rate on road safety measures, etc.
Although there are many attempts have been made to describe road accident problem, I used to describe the problem as a disease where the causes of road accidents are symptoms as (illness). The road safety problem is a sign of illness in society. To diagnose the problem, there are direct and indirect symptoms (causes). The direct symptoms in road safety can be easily seen in society from simple observation and data such as: speed problems, alcohol and driving, vehicle conditions, road user behaviour, etc. The indirect symptoms in road safety are not simply obvious and they need more checking and examination such as: the traffic management, education, traffic police enforcement, legislations, etc.
It is generally known that the amount of road safety problems in a country can be observed by the large number of accidents, large number of casualties, high severity level of accident consequences, high risks in travel, and high cost. There are many studies and much research in road safety that have attempted to formulate a theory or model that can explain why accidents happen. Hauer (1982) defined the road safety problem as the product of Exposure and Risk. Rumar (1999) illustrated the road safety problem as a function of three dimensions: exposure, accident risk for a certain exposure and injury consequences.
3.1.1 What are the Exposure, Risk and Consequences?
Exposure is an important dimension in road traffic that refers to the amount of travel in
which accidents may occur. The more we travel on roads, the higher the probability of an accident to occur. Without traffic or mobility, there will be no accidents and no road safety problems. Many studies show that there is a correlation between vehicle traffic volume and the total number of accidents. Moreover, traffic volume (mobility) is one of key issues, which is needed to promote the sustainability of transport in any country. At present, there are many ways of measuring exposure. In international comparisons as well as for national statistics, the population size, urban population, the number of vehicles, length of road network and number of driving licenses are possible and available indicators of exposure. However, these indicators, as found in many studies, do not always work as good measures of exposure. This is due to the differences in socio-economic conditions between countries, population density, vehicles per citizen, and transport mode split.
The number of kilometres vehicles travelled is generally considered as a relevant exposure measure and is defined as the sum of the distance travelled by all motor
vehicles in the country over a year (the distance travelled per vehicle multiplied by the number of vehicles). Unfortunately this measure is not often available in most countries. Many countries do not have any national system/scale for counting travel volume on the basis of this measure, where they estimate the kilometres driven by either the total fuel sales (consumption) in the country or they give an estimated equal average distance for each car driven (amount of kilometres per year). In fact, these assumptions are not fully accurate because of the differences in fuel consumption and the distances travelled by each type of car and vehicle. Also one should remember that the amount of kilometres is gathered more on urban roads, which are busier than those in rural areas.
The lack of detailed and quality exposure data is a challenging issue and therefore, international comparisons are often conducted on the basis of a per-capita population or per-vehicle. There is a need for detailed exposure information on a specific population (e.g. children or elderly road users), non-motorised modes (e.g. cyclists and pedestrians), motorcycles, and driver information. This information is often less known and available in many developing countries than in highly developed countries. The classifications of roads also differ in their standards from one country to another (e.g. national/regional/motorways). There is a need for special counts of traffic volume by type of vehicle and type of roads.
Calculation and gathering of annual exposure traffic data is not a simple issue and it needs to be conducted in a regular and systematic manner for each group of road user, type of roads, time, etc. Besides travel, surveys are increasingly expensive in many countries especially in developing countries. Fortunately, more advanced technologies have now become more available in most countries. They are cheap and effective in calculating exposure of travel (e.g. widespread use of mobile telephones, telecommunications technologies inside vehicles and along roads) that it hopes will provide better and more accurate exposure variables that can be used in international comparisons.
Risk: is determined as the probability of an accident to happen per units of exposure or
it is valuated as the size of consequences (severity) of this accident. The higher the accident risk, the higher is the probability of an accident to occur for a given road user in one particular place and time. Sometimes the term risk of accident is named as accident rate.
When comparing different countries, the indicators of fatality per population and fatality per vehicle are widely used and they vary from country to country and over time. Both measures do not take into consideration the characteristics of the type of transport modes or the road users. The risk per exposure unit has generally shown a clear decrease over time in most countries. This is an indication of an improvement in the overall accident situation in most countries where they produce lower accident rates for each unit of exposure. However, the exposure unit itself (i.e. number of vehicle or vehicle kilometres travelled) has continued to increase and more casualties occur on
roads in many countries. It is internationally found that the risks for accidents are higher in the countries with low motorisation (vehicle fleet) level and in countries that have experienced very rapid and quick motorisation.
Consequences: The third dimension in describing the road safety situation is the risk of
injury severity (consequence variable) in an accident, which refers to the outcome of accidents in terms of injuries. The severity of the consequences of an accident ranges from fatalities and serious injuries down to slightest and damage only.
By multiplying the three dimensions (Exposure, Risk, and Consequences) we get the total number of killed or injured persons or accidents in road traffic. Rumar (1999) described the road safety problem as a function of three dimensions, which are ‘exposure’ (E), ‘accident risk’ (A/E) for a certain exposure and ‘injury risk’ (I/A). This is illustrated in Figure 3.1 where the volume of the cube determines the size of the road safety problem. Any change in any one of these three dimensions will change the whole safety situation in a country.
The shaded area indicates the number of accidents (A). The total number of deaths or injured persons (I) = Exposure (E) * Accident risk (A/E) * Injury severity (I/A).
Figure 3.1: Road safety problem described by three-dimensional cube (Rumar, 1999)
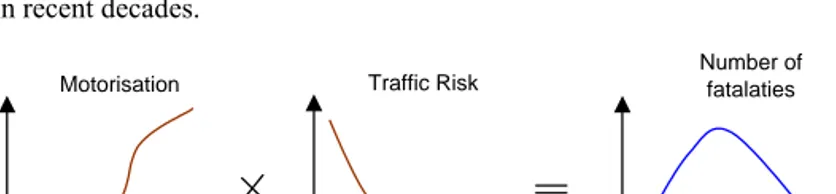
This formula can be transformed to the fatality rate. An example of this expression is:
accidents fatalaties * exposure accidents * s inhabitant exposure s inhabitantfatalaties =
If we take the number of vehicles as an exposure measure, we find: Personal Risk = Motorisation * Traffic Risk
Accident Risk (A/E)
Exposure (E)
These formulas would allow us to compare and illustrate the road safety situation among countries. Thulin & Nilsson (1994) have shown how exposure, risk and consequences vary for different transport modes and age groups in Sweden.
In principle there are three main ways for reducing this size of safety problem in response to any change in the three dimensions:
- Reducing Exposure Factors: by reducing the amount of travel per person or vehicle and the total reduction in traffic volume.
- Reducing Risk Factors: by reducing the accident rate for a given unit of exposure (travel). It is possible to reduce this by improving driver skills, road user education, vehicle performance, road standards, legislation and enforcement.
- Reducing accident severity: by protecting people better in vehicles from injury severity. Protecting pedestrians and other vulnerable road users by vehicle design, and protecting two wheelers by using appropriate helmets.
Shifting travel from means of transport with high exposure and risk (e.g. motorcyclists) to means that have a low level such as public transport can influence the level of the safety situation in the country.
3.1.2 Correlation between the quantified macro factors and road accidents
Many studies have shown that there are many factors that can be chosen as risk factors that increase the probability of accidents to occur and their severity. The correlation between any factor and road accidents means that they both increase and decrease simultaneously. For example, if an increase in speed causes an increase in road accidents it means both are correlated. The degree of such a correlation differs from factor to factor and is usually measured by using different statistical techniques and it ranges from zero to one. If one, it means the factor is highly correlated to road accidents and if zero there is no correlation at all. In this section I will not discuss these techniques in detail, but instead I focus on the results from several sources have been reviewed. I have tried to select recent studies demonstrating long international experience in this field. For example, the Handbook of Road Safety Measures (Elvik & Vaa, 2004) provides a wide literature survey and meta-analysis of different road safety measures made in relation to accidents in different countries. I will provide a summary of the most important factors in relation to risk, exposure and consequences at the end of this section. However, I know that it is hard to identify all those macro-factors that have the potential to contribute to accident occurrence and consequences. In all approaches, the chosen factors should be relevant to the concept of road safety that one is seeking to measure.
I. Risk and Road User Behaviour: Different studies indicate that the human factor
(road users) is the major contributory factor to accidents. At the same time, any error in the system and on roads will lead to unsafe road user behaviour:
Speed and risk of crash involvement: Speed has been identified as a highly important influencing factor concerning road safety risk and consequences. An increase in average speed results in a higher risk of involvement in an accident and greater severity. In many countries, speed contributes to a significant percentage of all deaths on the roads. Leaf & Preusser (1999), for example, concluded that reducing vehicle speeds could have a highly significant influence on pedestrian accidents and injuries. Garber & Gadiraju (1988) determined that accident rates increased with increasing variance of speed.
Alcohol and risk of crash involvement: Drivers with high BAC (Blood Alcohol Content) in their blood have more chance of being killed than those with zero BAC (sober drivers). Hakkert & Braimaister (2002) provided a review of many studies and reported that the risk in traffic will increase rapidly with BAC. Such results have given the basis for setting BAC limits in many countries (e.g. .08 g/dl). Thoresen et al. (1992) have shown a positive correlation between the total number of fatalities in Victoria state in Australia with alcohol sales and inverse relationship with random BAC breath testing. Age of drivers and risk of crash involvement: Road accidents are the leading cause of death for young drivers and motorbike riders. The risk by age group per kilometre travelled and per hour exposed to traffic is higher among young people (15-24) and old (65+). However the exposure for young is higher than old people. Evans (1991) reported that young male drivers are overrepresented in accidents in the US. Page (2001) concluded from a survey in OECD countries that the higher the proportion of young people in the population, the higher the number of road accident fatalities. Use of helmets: Motorcycle helmets have been shown to have a clear impact on reducing fatal and serious injuries by between 20% and 45% (WHO, 2004). The same study shows that bicycle helmets reduce the risk of head and brain injuries between 60% and 80%. Wearing helmets reduces the probability of being injured by around 25% (Elvik & Vaa, 2004). Many countries have legislated mandatory helmets use, which has been effective in preventing, or reducing the severity of two-wheeler riders (motorcyclists and cyclists). The use of helmets varies from country to country. In high-income countries, the usage rate tends to be high.
Use of seat belts: Road accident research has found that seat belts reduce the fatal injuries significantly and it can reduce the risk of fatal injury to front-seat passengers. The use of seatbelts varies from country to country. In high-income countries, the usage rate tends to be high. In Sweden for instance, seatbelt usage exceeds 90% (Koornstra et al., 2002). The use of seat belts reduces the probability of being killed by 40-50% for drivers and front-seat passengers and by 25% for passengers in the back seats as shown in (Elvik & Vaa, 2004). Regarding the use of safety seats for children and infants, studies (e.g. WHO, 2004) have shown that reduce infant deaths in cars by 70% and deaths of small children by 50%. Mandatory seat belt use proves to provide strong
protection against fatalities in accidents in different countries according to various studies.
II. Risk and Road Conditions: Motorways have the lowest risk on injury accidents
compared to other types of roads because of the separation between vehicle movements according to their speed (no high speed variance). (Elvik & Vaa, 2004) show that the rate of injury accidents per million vehicle kilometres of travel on motorways is about 25% of the average for all the public roads. Road surface conditions, poor road surface, defects in road design and maintenance contribute to an increase in the risk of accidents. Bester (2001) reported that countries with more paved roads will lead to lower fatality rates.
III. Risk and vehicle related factors: New cars tend to have more safety and protection
features, such as air bags, anti-brake system (ABS), etc. There is relation between vehicle age and risk of a car crash. One study (in WHO, 2004) showed that occupants in cars manufactured before 1984 have almost three times the risk of new cars. Many developed countries improved vehicle crashworthiness and safety, which means the protection that a vehicle gives its passengers (and to the VRUs) from a crash. Many countries in the European Union (EU) as well as USA have set out legislation for safety standards in motor vehicles, for instance the New Car Assessment Program (NCAP), where vehicle crash performance is evaluated by rating the vehicles models according to their safety level for occupant protection, child protection and pedestrian protection. Vehicle defects increase the risk of accident. The size of vehicle is crucial; the greater the mass of the vehicle (e.g. heavy trucks), the more protection people have inside the vehicle (their occupants) and the more involved in fatal accidents to others. It is known that poor vehicle maintenance and technical conditions can also contribute to accidents. In terms of periodic vehicle inspection, different research shows different results. (Elvik & Vaa, 2004) concluded in the review of macro-studies that there is no clear evidence that periodic vehicle inspection has an effect on the number of accidents, while (Hakim et al. 1991) presented in another review of macro-studies that the periodic inspection of motor vehicles reduces the number of road fatalities.
IV. Risk and post-crash injury outcome: Different studies have shown that fatality
rates are correlated with the level of medical facilities available in the country expressed in terms of population per physician and population per hospital bed, see (Jacobs & Fouracre, 1977) and (Mekky, 1985). A review of a European study, in (WHO, 2004), showed that about half of deaths from road accidents occurred at the spot of the accident or on the way to the hospital. Noland (2003) concludes that medical care has led to reductions in traffic-related fatalities in developed countries over time (1970-1996). The variables used are: infant mortality rates, physicians per capita, and average acute care days in hospital.
V. Risk by different transport modes: The ETSC report (1999) has compared the risk of
in terms of fatality per hundred million passenger hours or kilometres travelled) is 10 times greater than buses. The risk for the vulnerable modes (foot, cycle and motor-cycle/moped) is 80-200 times more than buses. Motorised two-wheelers are the highest risk among all other modes. The study gave a rough assumption of travel speed by the transport modes.
VI. Socio-Economic Factors and Risk: There are many socioeconomic factors that
contribute to the causes of accidents. Some of the major factors are the following: Gross National Product GNP: It is widely known that the motorisation rate (vehicle per population) increases with income (GNP per capita). This may affect both exposure and the risk of fatal accidents. Many studies (e.g. World Bank, 2003) have shown that the fatalities per vehicle appear to decline rapidly with income. Maybe this reflects the shift from vehicles with high risk (motorbikes, foot) to safer and protected vehicles (e.g. four-wheelers) or it may show more funds and expenditure being spent by the country on its road safety measures. There is a negative relationship between income growth and the number of road accidents in the long term (Hakim et al. 1991). The increase in income leads to safer vehicles and more investment in road infrastructure, that leads to fewer road accidents and casualties. However, it should be clear that the improvement of income could also increase the travel distance (higher exposure) and more alcohol consumption (higher risk).
Unemployment: Few studies have used the unemployment factor as a risk factor for accidents. It appears to be negatively related to accidents and casualties. Hakim et al. (1991) has shown in the literature review he made that an increased unemployment rate in country might reflect on the ability to pay for a single journey and a reduced exposure to the whole journey. Page (2001) included employment (percentage of population in employment) into his model in the study conducted for the OECD countries (1980-1994). The higher employment figures showed an increase in the number of fatalities. Urban population: Urban roads will have more accidents and fewer fatalities or severity per kilometre travelled than rural roads, because of the density of vehicles and the lower speeds of travel. Hakkert and Braimaister (2002) have shown in one macro-study that countries with a high level of urbanisation will have higher population densities and they may experience lower levels of fatalities and serious injuries. Page (2001) has found that the population who live in urban areas have fewer road accident fatalities than other places. Bester (2001) also reported similar results that countries with higher road densities will have fewer fatality rates. Shorter distances to medical services can explain this.
Illiteracy: Bester (2001) has analysed socio-economic factors in different countries and he found that the illiteracy percentage has a statistically significant effect on the national fatality rate. He explained that a country that can read and write is expected to influence the ability of road users to understand the rules of the road and road signs.
Technology level: Few studies have described the decline in the number of fatalities in all industrialised countries as a result of the increase of technology use in vehicle and road infrastructure (i.e. Evans, 1991).
VII. Risk and other factors: Different macro studies have shown that the risk of crash
will increase by other factors such as: poor visibility, using hand-held mobile telephones, dark conditions, wet roads and roads that are covered with snow or ice (Elvik & Vaa, 2004), (Evans, 1991). There is an inverse relationship between accidents and the average gasoline prices (Hakim et al., 1991). It seems that an increase in the price of gasoline reduces the number of trips and the exposure. Similarly, there is an inverse relationship between number of accidents and the number of driving licenses delivered (Van and Wets, 2003). Moreover, the road safety audit process is shown to have a clear impact on the number of accidents (Proctor et al., 2001). However, there is lack of data concerning all these factors and they are not available in many countries. To sum up, what I have now of the main points discussed, is a classification of the most important of factors into three categories of exposure, risk and consequences as shown in the following table:
Table 3.1: Factors influencing exposure, risk and consequences Factors influencing exposure to traffic
- Economic factors and GNP per capita
- Urban population density, and other demographic factors - Type of travel mode choice
- Travel route - Length of trip - Mix of traffic
Factors influencing risk of accident
- To driver: speed, alcohol and driving, being young, etc. - To groups of road users: unprotected road users
- To vehicles: Motorcyclists, heavy trucks, non-motorised traffic, defects, age of car, etc. - To roads: intersections, unpaved, defects in road design, poor maintenance, etc. - To environment: darkness, fog, ice, etc.
Factors influencing accident severity (Consequences)
- Human factors: speed, alcohol
- Vehicle: active and passive safety (e.g. seatbelts, airbags, child safety seat, vehicle safety and protection standards)
- Helmets worn by users of motorcyclists and cyclists - Crash-protective roadsides, guardrails, barriers - Poor rescue and pre-hospital emergency care - Poor country health care system
I believe this summary will be useful in obtaining a picture of the whole safety situation in a country. It will contribute to the selection of macro-indicators in more detail, as will be discussed in the next section. These performance indicators can be checked and determined whether if they can be used as benchmarks in international comparisons.
3.2 Macro-indicators of performance in road safety
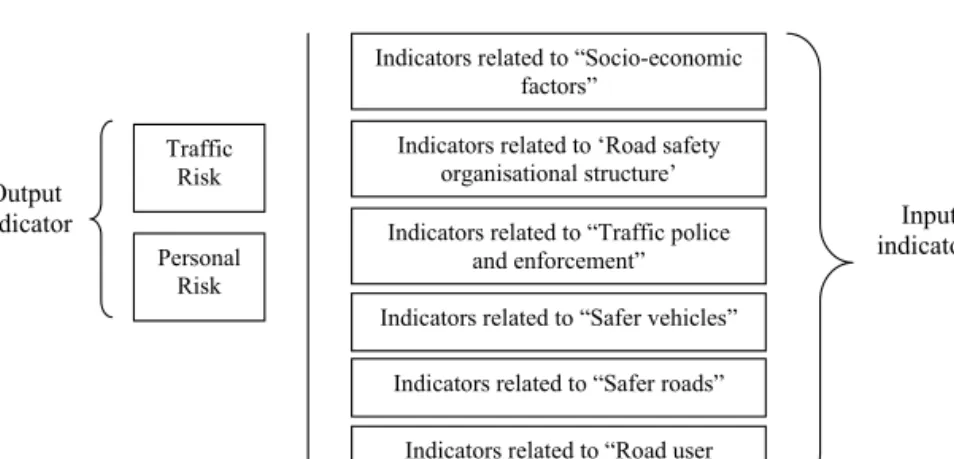
In road safety, there are a large number of variables (causal factors) contributing to road accidents and their severity. The weight of each variable depends on the conditions of the accident, place and time. According to the studies and evaluations shown in the last section, there is no single cause of accidents and it is hard to pick up one factor (or even a few of them) as being more important than the others. From this, removing any factor that contributes to or causes the accidents will not provide a fully and quick satisfactory solution to road accident problems. However, in many studies and theories it is shown that accidents are caused by a combination of five main dimensions (human-vehicle-environment-road-system). These dimensions are not fully independent of each other and each dimension is influenced by many factors. I can express this function as: Y=F (X), where Y is the number of accidents or the accident rate, and X is a vector matrix of the explanatory variables in each of (human-vehicle-environment-road-system). The safety situation can also be quantified by a combination of risks in traffic as probabilities (e.g. speed risk, alcohol and driving risk, etc.). For instance this can be indicated by the following formula (Koornstra, 1996):
kilometres R w R w R w SAFETY =
∑
( 1. 1+ 2. 2+...+ n. n)* Where R is the risk of particular factorkilometres is the exposure in traffic, and
w is the weight of the risk factor in a particular country
One of the major contributory factors in road accidents is human error (for example violation of speed limits). The type, size and frequency of these human errors depend on the whole road system and traffic regulations, which must be designed in a way to be safe and protective of such human errors.
The indicator itself is a value derived from variables. The choice of each indicator is crucial, which depends on the type of data being collected, what we want to measure, and for whom this indicator will be used (target group). Indicators can be used at the highest national levels to measure or assess the progress being made towards a certain goal, such as reducing the number of accidents and injuries in the whole society. At the local level, indicators can be used to measure the daily/monthly activities through which measures can reduce the number of accident in a certain place and time (e.g. young pedestrians involved in an accident at particular intersection). The ordinary road user (at micro- or individual level) is more concerned with his/her danger or what is meant by the probability of accident on the way from his home to work or to school. This is associated with the type of his/her behaviour on a particular road and the use of a particular mode of transport, while policy decision makers (at top level) are often interested in the number of total accidents, deaths and injuries in the whole of society and in the way to reduce them and the cost.
3.2.1 The macro-performance indicators in road safety and their purposes
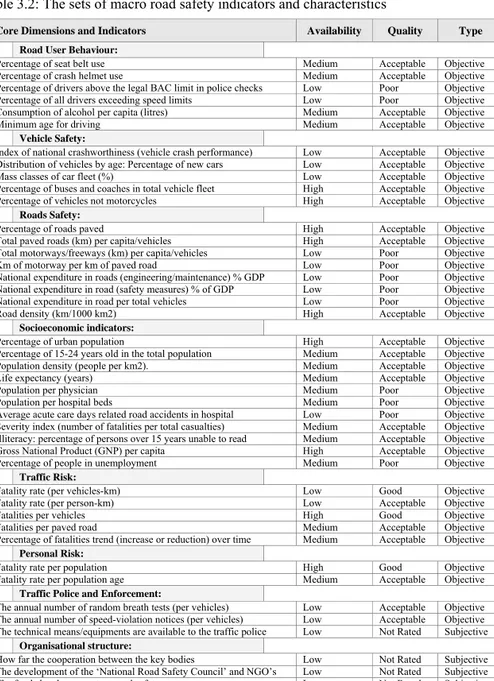
Macroscopic road safety performance indicators refer to all national measurements that could indicate the country’s progress over time in road safety, to monitor this progress or any changes in countries' efforts, and to allow international comparisons. The macro-indicator is a value that quantifies something that affects the national road safety level and it can be measured as a number (e.g. number of fatalities), a percentage (e.g. percentage of front-seat belt usage), a rate (e.g. number of fatalities per population), or as qualitative information (e.g. level of national data collection and reporting: Very Good, Good, Fair, Unsatisfactory). The number of accidents, deaths and injuries tells us nothing about the safety level or the process that produces accidents. Not all indicators and data used at a local and provincial level can be used nor are available at a national level. Most of the detailed data is available only at a local level. The need for macroscopic performance indicators in road safety becomes more important and necessary to every country so that they can measure and monitor the progress they made against other countries.
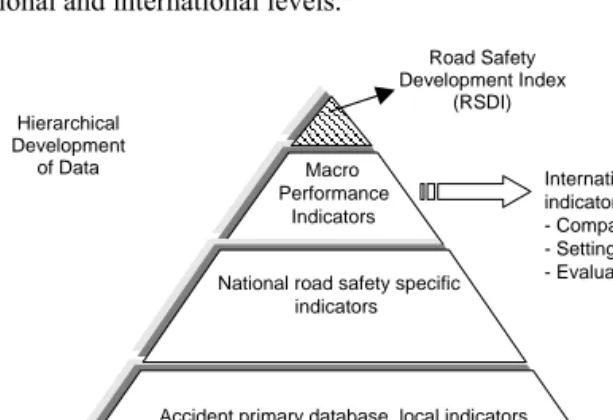
Data can be converted into different forms; some common forms include percentages, rates, and indices. The national multidimensional index integrates and summarises much information and knowledge about road safety into measurable indicators that will be then converted into a single value. In this section, I will discuss the overall concept of criteria and macro-performance indicators. This will also be useful in designing a multidimensional index Road Safety Development Index (RSDI) (this will be discussed in Chapter five). Figure 3.2 shows hierarchical development of the data and availability from local to national level. I focus in this part of the study on the indicators that are used in national and international levels.
Figure 3.2: The pyramid of road safety indicators and levels of performance
Accident primary database, local indicators and secondary indicators
Macro Performance
Indicators
National road safety specific indicators International key indicators for: - Comparisons - Setting visions - Evaluation Road Safety Development Index (RSDI) Hierarchical Development of Data
3.2.2 Criteria for selecting macro-performance indicators in road safety
The value of each chosen indicator is expected to correlate with the road safety outcome, which means it is related to the probability of accidents to occur under different conditions. It is possible to find multiple indicators relating to a single meaning. This needs a clear selection especially of which ones to choose and why. For instance, if I take the health level in a country as an example (road safety is a health matter), possible indicators could measure this: the proportion of the total health care expenditure as a percentage of GDP, life expectancy at birth (years), physicians per population, hospital beds per population, etc. However, a higher number of ‘hospital beds’ in a country does not necessarily lead to better health. In addition ‘Life expectancy at birth’ which is being used by HDI, is not enough to measure the health level in a country. The focus should be first on more comprehensive and efficient indicators and second on the outcomes (outputs)8 not on the mere numbers. In terms of
road safety, I might add the severity index (proportion of deaths per total accident casualties) as a good indicator of health, which severity index decreases with better medical facilities and rescue services.
Consider, for instance, the indicators that can be used to measure the change of the number of drivers above the legal BAC limits or driving exceeding speeds limits checked by police in one particular country over a year. This change could indicate a higher real traffic violation rate, but at the same time it can be sign of an increased level of reporting and checking by police.
On the way to develop a complete set of macroscopic performance indicators that can be used for international comparisons, one needs to remember that such a choice is restricted by certain conditions and requirements for both the indicators and data: First, the indicators should have effect on road safety if any change in indicator occurred (relevant to the concept). They should represent the improvement in the situation and be reasonably accepted from different studies and literature surveys. Second, one should care about the quality of each indicator and data. There are usually several data sources available from which we can find data to measure. But the data should come from one or more reliable sources (national and international).
Third, the indicators chosen should be clear and with a precise definition. For example, an indicator of ‘safer vehicles or urban roads standards’ without a clear and precise definition of what we mean by the words safe or standards could easily lead to as unclear collection of data. This will likely lead to a misunderstanding of what results are being achieved.
8 An example of the outcome indicators (in health sector) that have been developed in recent years are: the number of
specific surgical operations are made in the country annually, and the level and spread of infectious diseases in the country.