Combating Inequalities through Innovative Social Practices of and for Young People in Cities across Europe
C
AUSES OF INEQUALITY AFFECTING YOUNG PEOPLE IN
10
E
UROPEAN
C
ITIES
Baseline and comparative report 11 October 2013
Mikael Stigendal Malmö University
This report is part of Work Package 2 of the research project entitled “Combating Inequalities through Innovative Social Practices of and for Young People in Cities across Europe” (CITISPYCE). CITISPYCE (2013-15) has been devised against the back drop of research which shows the disproportionate impact of the global economic crisis on young people across Europe. This includes excessively high rates of youth unemployment (particularly amongst those who face multiple social, economic and cultural disadvantages) and threats to the social provision enjoyed by previous generations. CITISPYCE partners are working on a three year multi-disciplinary, multi-sectoral programme to examine the current state of the art and ideas concerning social innovation against inequalities faced by young people, explore socially innovative practices being developed by and for young people in urban areas, and test the transferability of local models of innovative practice in order to develop new policy approaches. The CITISPYCE consortium covers ten European countries and is funded by the European Commission (FP7, Socio-economic Sciences & Humanities).
Introduction ... 2
1. Ten European cities ... 6
2. NEETs – the not included ... 9
3. Growth models ... 13
3.1. Dependent financialisation in the south ... 16
3.2. Export-orientation in the centre ... 19
3.3. Dependent export-orientation in the east ... 21
3.4. Superior financialisation in the west ... 22
3.5. Export-orientation and financialisation in the north ... 23
4. Welfare regimes ... 25
4.1. The conservatives and their ”misérables” in the centre ... 26
4.2. The liberals and their obstacles to economic growth in the west ... 28
4.3. The social democratic hesitancy in the north ... 30
4.4. The reliance on the family in the south... 31
4.5. The constant transitions in the east ... 34
5. The simultaneous convergence and divergence in Europe ... 37
6. Prospects for social innovations ... 43
References ... 46
Annex ... 52
Introduction
Citispyce means “Combating Inequalities through Innovative Social Practices of and for Young People in Cities across Europe”. The objectives of the project are set in the framework of the Social Innovation Europe Initiative and follow on from the establishment of the European Platform against Poverty, the Social Innovation Pilot within the European Social Fund, the PROGRESS programme and the focus on young people and employment through Youth on the Move and New Skills for New Jobs. They come together around the key question: In the rapidly redrawn landscape of deprivation and inequalities across Europe, how might policymakers (at local, national and EU levels) be assisted in their objectives to tackle inequalities through learning from innovative strategies developed for and by young people and particularly those from marginalised groups in major European cities, including an elaboration of the resources and technologies at the heart of these social innovations?
In order to achieve that, we first of all need to know about the inequalities that are supposed to be combatted through innovative social practices of and for young people in cities across Europe. Accordingly, this report aims to fulfil that need and in that way present a basis for the further work in the Citispyce project. The report deals with the inequalities, but not by restricting itself to the symptoms. It aims to go beyond the symptoms and identify the causes. Such analyses will show that the symptoms may be the same in two cities, for example in terms of youth unemployment, but the causes different. As agreed in the project, social practices to combat inequalities have to be directed at the causes to become successful and innovative. The symptoms of inequality are of course important, but mainly as point of departures for further analyses of the causes.
The report builds on 10 reports, dealing with the cities in their national contexts, written by national teams in the Citispyce project (see References). In order to make the descriptions of symptoms in these 10 reports similar, 14 indicators were selected (see Annex). All of them are well known, established and defined within the EU. They are used in the work within the EU Youth Strategy (European Commission, 2009), the framework for European cooperation in the youth field (2010-2018). Two recent publications, EU Youth Report (European Commission, 2012) and a report by Eurofound (2012), contain values for all the indicators, specified for the national levels. The 10 national teams were asked to try to find the corresponding values at the city level. If they were not successful, it would perhaps be possible to determine whether values were higher or lower. These values or estimates have then served as a basis for the analyses of the causes (see Annex).
Regarding the causes of inequalities, this report runs counter to the wisdom that has characterized a lot of economics and politics during the last decades (see chapter 5). The report suggests that a capitalist economy has to be regulated. Thus, totally deregulated capitalist economies do not exist and when deregulations are carried out, one can expect that the fundamentally contradictory content of the capitalist economy gets out in the open, so to speak, engendering instability and conflict (Jessop, 2013). These structural contradictions (basically deriving from the exchange- and use-value aspects of the commodity), for example the one between labour-power as a use-value and capital as an exchange value, are one of the reasons to why a capitalist economy has to be regulated. The other reason is that a capitalist economy cannot reproduce itself. For example, children have to be born, raised and educated in order for labour-power to be available. People have to make decisions about buying the commodities produced and thus needs have to be engendered. Historically, it took a while for people to become mass consumers. Among other things, people need to feel sufficiently secure about their future. The welfare state has had as one of its purposes to make them feel that.
This means that the economy cannot be studied separately. It has to be understood in its “inclusive sense” (Jessop, 2002: 5) and in this report, this will have two implications. Firstly, it means that the relationships between growth and welfare will be highlighted. It turns out that there are crucial differences between the countries regarding this relationship, which then may explain the differences in the causes of inequality. That will be conceptualized as regimes of capital accumulation. Secondly, it means that extra-economic mechanisms and structural forms contributing to the regulation of the economy have to be brought into the picture. One such structural form is the wage relation, another one is the state and we will focus on the specific configurations of state, market, family and social economy known as welfare regimes. These regimes will be regarded as structural forms, decisive for the regulation of the capitalist economy.
This view expressed above belongs to the perspective called regulation theory (Aglietta, 1987). The implications of it will be clarified in chapter 3. Another guiding theory of this report concerns causes. They are not always what they seem to be; and what seems to be is not always the cause. Furthermore, often nothing seems to be the cause; although a cause certainly exists but it does not seem so as we may not be able point it out. For that reason, we have to ask ourselves what can have a potential to be a cause.
Such a line of inquiry has its basis in the scientific paradigm called critical realism (Jessop, 2005) which distinguishes between the real, the actual and the empirical. Something must have the causal force to make people unemployed before they become it. Critical realism identifies such a causal force at the level of the real. Whether people do become unemployed (the actualisation of it), however, depends on various circumstances interacting at the level of the actual. Finally, that should be distinguished from how we perceive it, which is a matter of the empirical and may be indicated by, for example the unemployment rate.
The distinction between the real and the actual explains how the same causal forces can operate in different contexts but get different outcomes due to the differences in actualisation. In one of the articles resulting from the EU project Social Polis,1 Pratschke and Morlicchio (2012: 1895) express the same thought when they refer to it as generative mechanisms that “combine to produce differing outcomes in a context-dependent way”. This means that we cannot take the indicators for granted and that is what the distinction between the actual and the empirical implies. The indicators may be well defined and technically superb but do not speak for themselves. It is we who have to speak for them by interpreting them critically. As stated above, the indicators should only be regarded as point of departures.
The critical realist view of causes enables us also to understand that what is a symptom, effect or solution can also become a cause and problem. For example, unemployment of young people may be regarded as an effect but it also causes a lot of problems; another example is the welfare state, which seems to solve problems as it regulates the economy and makes it run more smoothly. The welfare state also causes its own problems, however, regarding, for example, the conditions for getting benefits or access to public housing. Thus, what seems to be solutions can also be, or turn into, problems. This was underlined by the Hamburg team in a contribution to the WP2: Strategy report:
Nationality and age open and close doors to services, and the reason for this is no other than the very make-up of the welfare system itself that draws clear boundaries around citizenship (citizen vs alien) or age (child vs adult). Secondly, the institutions of inclusion may in practice provoke exclusion through mechanisms of institutional discrimination, just think about the last riots in France which were clearly directed against discriminatory state practices in schools etc., or think about the conditionalities built into the workfare approach of employment policies - not handing out benefits to people because they fail to apply for jobs means in reality that they will face deeper hardship than before rather than anything else.
The objective of this report is to compare the 10 reports on the cities in their national contexts. The cities can probably be compared in many different ways, but here the comparisons have been made with the purpose of serving the forthcoming work packages. Since the view of this report is that in order to combat inequalities, social practices have to be directed at the causes to be regarded as innovative, the analyses finishes with a chapter where some conclusions are drawn about what these causes may be. But first of all, the 10 cities will be presented on the basis of how they are presented in the 10 reports.
1
Thereafter (chapter 2), the focus turns to the symptoms of inequality and one of the 14 indicators will be highlighted, the NEET. That means the young people not in employment, education or training. There are several reasons why we have chosen to highlight the NEET indicator. Firstly, it is a major indicator because it covers not only one symptom of inequality but at least three (employment, education and training) and also often other symptoms related to that, like for example discrimination. Secondly, the NEET indicator is particularly useful as a way of leading into a more theoretical discussion, including problematising concepts such as social exclusion and aiming at improving the understanding of young people’s situation and what it depends on. At the local level, however, the NEET indicator has not been available with the same definition in all the 10 cities. That shows the difficulties of finding indicators which may be used for comparisons.
Then, in chapter 3 we turn to the causes of inequality, starting with the ones associated with the growth models. In chapter 4 the exploration of causes continues with the welfare regimes. Chapter 5 highlights two major and general trends from a European perspective. Both these trends have been engendered by the political project called neo-liberalism. It has on the one hand caused a divergence between and within European societies. On the other hand, it has made them converge in the sense of being increasingly imprinted by neo-liberalism. Finally, based on the analyses and as a kind of conclusions, chapter 6 outlines seven prospects for social innovations.
It is important to note that this report represents a critical interpretation of the 10 reports and information provided in other ways. The report does not simply convey the content in the 10 reports. It is the view of the author that such a procedure would not have been scientifically justified. It is also the author who is responsible for the selection of theories and literature by which the critical interpretations and analyses have been made. All the teams have, however, been given the opportunity to read and comment on a previous version of this report. All these comments have been considered by the author to the best of his ability. The responsibility for the final result, however, with its remaining shortages, lies with the author.
1.
Ten European cities
The 10 European cities are very different. All the cities, however, can be regarded as capitals, although only two in the national sense and the others regionally. Some of the cities are very old, in particular Athens, one of the oldest cities in the world. Others were previously very prosperous industrial cities which have gone through a hard time of industrial decline. Some of them have managed to change their identity, like Malmö. In contrast, Birmingham seems to have got stuck in between the old and the new, while Rotterdam remains as the working class stronghold, the city where you earn the money you spend in Amsterdam, according to a popular saying (Spies and Tan, 2013: 3).
Some cities have been very much affected by the crisis, like Athens, while in Hamburg things have never been better. Also Brno looks optimistically towards the future. In two of the cities, Krakow and Rotterdam, there do not seem to be any serious problems at all, according to the reports. In especially one city, history means a lot and that is Barcelona, the city that gains strength from its history and sees itself as champion in the contemporary struggles against the central power in Spain. That probably provides something for young people to identify with, making life a little more meaningful, and that is also a reason for mentioning it. The cities differ in terms of the meaning and identities they offer young people. Inequality is certainly about jobs, housing, education and politics, but also about meaning which will be made clear later in this report.
Another city with a rich historical and cultural heritage is Venice. It does not, however, provide the same opportunities as Barcelona for young people to gain strength from this heritage. According to the Venice report (Campomori et al., 2013: 19), the history of trades and cosmopolitanism, but also the working class tradition and the strong presence of migrants have made Venice an open city, acceptant towards strangers. This feature is anchored in the Old Town of Venice which during the last decades, however, have been invaded by tourists. In this emergent “touristic monoculture”, many young people cannot afford to live any longer and have been forced to move. The Venice report (Campomori et al., 2013: 21) describes the city as “heartbroken by the disruption of social ties that have suddenly taken shape in the last thirty years, polarized between an ‘Old Town-museum’ (‘Old-Town-Disneyland’) and a ‘mainland-dormitory’, as a melancholic because of the progressive emptying of young population that appears unstoppable and because of the lack of generational turnover caused by the projection of the new generations to other contexts and by their lack of attachment to the city and to its history”.
In terms of population, the cities range from 270.000 (Venice) to almost 2 million people (Hamburg and Barcelona). That is not particularly significant, however, as all the cities are included in wider metropolitan regions with much bigger populations of between half a million (Brno) and 5 million people (Barcelona) or even 7 million of the Randstad in The Netherlands. Thus, as centres of metropolitan regions they all offer a wide range of opportunities for young people. The difference in opportunities
between cities has nothing to do with size. It is not because some of the cities are small that there are a lack of opportunities.
More interesting is the change of populations in the cities. Athens stands out as the city which has lost a substantial part of its population. In fact, the registered population of Greece has diminished significantly from 10.206.539 in 2001 to 9.903.268 in 2011 (Avatangelou et al., 2013: 3). Malmö constitutes the opposite pole, being one of the fastest growing cities in Europe. The other eight cities have either increased a little (Barcelona, Birmingham, Brno, Hamburg and Sofia) or remained around the same size (Krakow, Rotterdam and Venice). According to the Athens report, the decrease of population in Greece and in Athens depends on, amongst other things, low fertility rates, but also large-scale emigration and that makes it even worse because, as the Athens report (Avatangelou et al., 2013: 3) mentions, “the majority of emigrants are well educated young people who move towards other European countries in search of employment and better living conditions”.
Particularly worrying is that Greece has lost as much as a fifth of its young population (age 15-29) during the last decade, falling to below 18% of the entire population. That makes Greece a middle range country in relation to the share of young people. Among the ten cities, Krakow and Rotterdam have the highest share of young people, amounting to 22% of the population, followed by Brno with 20%.
Athens is not only the city with the highest emigration. It probably also has the highest immigration, although a lot of it is undocumented. In 2010, according to FRONTEX, 9 out of 10 immigrants who illegally entered Europe did that via Greece (Avatangelou et al., 2013: 4). This could be well explained by the fact that a large number of immigrants do not have Greece as their final destination, but rather use it as a transit point in order to reach other European countries (Kitsantonis, 2007). Due to the fact that other member states do not want to receive them, they remain in Greece and end up living in specific areas of Athens, many of them working in the informal sector and in that way contributing to the growth of that sector.
Barcelona has also experienced a rapid increase of immigrants, but of a different character. Previously, Spain has been characterized by emigration. It changed at the end of the 1990s when large numbers of foreigners started entering Spain, mainly because they could get a job there. From 2001 to 2012, the ratio of foreign nationals living in the city has risen significantly, from 6,3% to 17,4% of the population. As Latin American immigrants represent the largest continental group, constituting 41% of the immigrant population, many immigrants obviously speak the Spanish language. Regarding the rest, Europeans amount to 30%, which also creates favourable conditions for a social integration. In addition, large numbers of undocumented immigrants live in Barcelona, corresponding to roughly 17% of the immigrant population according to estimates (Barcelona report). The proportion of immigrants has increased particularly rapidly, from approximately 3.9% in the year 2000 to 29.9% twelve years later of the youth population (15-24) of Barcelona.
A city which has a much longer experience of immigration is Birmingham. Currently, 22% of the city’s residents were born outside the UK. Due to the status of English as a world language and because many immigrants in the UK have their background in English-speaking countries, speaking the language of the majority does not imply the challenge that it does in, for example, Malmö where almost none of the immigrants, except for the Danes, understand Swedish on their arrival. Among the ten cities, Malmö seems to have the highest share of people born abroad, namely 30%, although the figures are difficult to compare. Hamburg as well as Rotterdam (21%) have high proportion of people born in other countries. In contrast, less than 1% of the population in Krakow was born abroad. Also Brno and Sofia have very low proportions of people born abroad. In these cities, however, another ethnic division prevails, one between the majority and the Roma community.
All these differences between the cities immediately raise a question about comparability. How is it possible to compare the cities when they are so different? They are not, however, supposed to be compared in general. The comparisons should focus on the symptoms and causes of inequality affecting young people. For that reason, we have selected 14 indicators of such symptoms as points of departure for further examinations of the causes. As explained in the introduction, one of these indicators has turned out to be particularly useful. That is the NEET indicator, indicating what all the cities have in common, although to different extent, “the not included”.
2.
NEETs – the not included
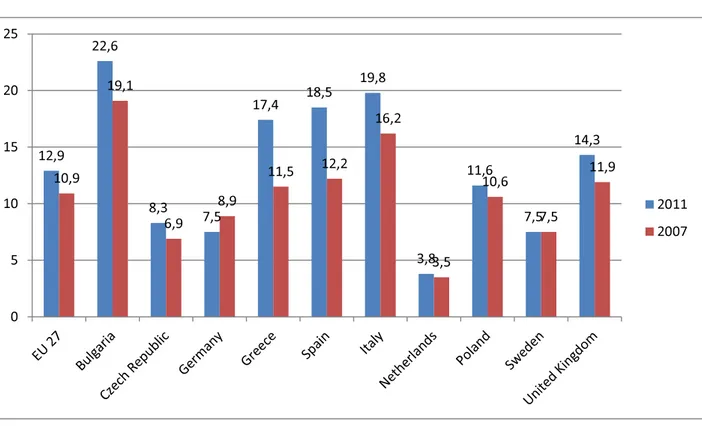
A major indicator of inequality is the so-called NEET (young people not in employment, education or training). The EU Youth Report (2013: 211) points out the NEETs as the “group of young people mainly at risk of poverty and social exclusion”. According to the Youth Report (2013: 211), in 2011, 12.9 % of young people in the EU-27 were classified as NEETs. Among the countries in our project, Bulgaria had the highest share of NEETs with 22,6% (age 15-24). The share of NEETs was high also in Greece, Spain and Italy, but particularly low in the Netherlands (European Commission, 2012b).
Diagram 1. Young people (15-24) not in employment, education or training (NEET), 2011
As the Malmö report (Grander, 2013: 6) states, in Malmö “those born abroad are overrepresented in the NEET category”. That means that in addition to not being in employment, education or training many of them are probably affected by discrimination. Furthermore, many of them probably live in specific areas of the city, thus with concentration of NEETs and where others in a similar situation, the “almost-NEETs”, live.
As mentioned in the quote above from the EU Youth Report, the NEETs are associated with social exclusion. According to the Youth Report (2013: 199), “social exclusion brings about a vicious circle of unemployment or low-quality employment and poor living conditions with limited access to education and training, health care and social and community networks and activities. In short, it adversely affects all aspects of young people’s lives”. Social exclusion can, however, be a controversial term as it may be
12,9 22,6 8,3 7,5 17,4 18,5 19,8 3,8 11,6 7,5 14,3 10,9 19,1 6,9 8,9 11,5 12,2 16,2 3,5 10,6 7,5 11,9 0 5 10 15 20 25 2011 2007
used to stigmatize and thus aggravate the problems rather than solving them. For that reason, if we are to use it, we should very carefully define it and specify the purpose of using it.
The EU has since 2004 defined social exclusion as (European Commission, 2012b: 144) “a process whereby certain individuals are pushed to the edge of society and prevented from participating fully by virtue of their poverty, or lack of basic competencies and lifelong learning opportunities, or as a result of discrimination. This distances them from job, income and education and training opportunities, as well as social and community networks and activities. They have little access to power and decision-making bodies and thus often feel powerless and unable to take control over the decisions that affect their day to day lives.”
One of the major problems with the concept concerns if it refers to a process or a state (situation). The EU report Employment and Social development in Europe 2012 expresses both these meanings, without paying attention to the very important difference between them. On the one hand, social exclusion is referred to as a process, as in the definition above, but then there is said to be “consensus that it can also mean being deprived of other aspects of life in a rich European society, such as access to paid employment, quality education, health and health care, housing, public benefits, and social contacts.” (European Commission, 2012b: 145) Being in a state of deprivation, however, is something else than the process of depriving.
As clarified in for example Collins English Dictionary, the term exclusion has two different meanings, the one referring to a process and the other to a state. While in English, the one and the same term carries both meanings, different terms are used in for example Swedish. The term used by the Swedish government, “utanförskap”, corresponds to only one of the meanings carried by the English term social exclusion. In Swedish, the term is used as a noun, referring to a state.
That is not how many scientists define it (for example Byrne, 2005; Madanipour et. al., 2003: 22). It is seen as an on-going process and Byrne (2005: 2) stresses the benefits of such a definition: ”When we talk and write about ’social exclusion’ we are talking about changes in the whole of society that have consequences for some of the people in that society.” Byrne asks us to pay attention to the inherent dynamics of the term because it points out something that happens in time. The term is also clearly systemic, Byrne claims, as it is about the nature of social systems and also has an implication for agency. ”’Exclusion’ is something that is done by some people to other people”.
In British politics, however, a definition of social exclusion as a state prevails, according to Fairclough (2000: 54), as “in the language of New Labour social exclusion is an outcome rather than a process – it is a condition people are in rather than something that is done to them.” It is used to present people and places as excluded but without the slightest trace of someone causing it, other than themselves. Fairclough (2000: 65) concludes that New Labour has replaced the quest for equality with the desire for more inclusion.
The objective of equality in left politics has been based on the claim that capitalist societies by their nature create inequalities and conflicting interests. The objective of social inclusion by contrast makes no such claim – by focusing on those who are excluded from society and ways of including them, it shifts away from inequalities and conflicts of interest among those who are included and presupposes that there is nothing inherently wrong with contemporary society as long as it is made more inclusive through government policies.
This is the definition that the Swedish alliance government has imported by translating social exclusion to “utanförskap”. Levitas traces the roots of this view in the sociology of Emile Durkheim. Its main characteristic consists of taking the existing social order for granted. Society is seen as obvious and natural. The individual must adapt to it. Disorder depends on individuals who have not adapted and therefore should be blamed. Levitas (2005: 188) sees it as a “neo-Durkheimian hegemony”, which removes the critique of capitalism from the political agenda.
But will a process-definition of social exclusion be sufficient to bring the full potential of that critique back? The answer here is no, because the process-definition also tends to take society for granted, although not necessarily the contemporary one. It conjures up the vision of a society that does not exclude and where social exclusion becomes the exception. It makes us believe that we are all basically included, but in modern and functionally differentiated societies we are not.
According to Marx (1996), following the French physiocrats and Adam Smith, capitalism requires a separation of work from the ownership of its material conditions. There must be people who volunteer to work for others because they do not own anything and therefore cannot work for themselves. They have to be outside, so to speak, before they can come inside. They must be out of work to be compelled to take one. Marx calls it “primitive accumulation” and what he conceptualises as capitalism’s point of departure can be understood as a state of social exclusion.
Harvey (2010: 48) updates the concept of primitive accumulation by renaming it as “accumulation by dispossession”. By that he wants to highlight that primitive accumulation does not only belong to the earlier stages of capitalism. It continues to happen and indeed, puts an imprint on contemporary society, by the use of illegal means, “such as violence, criminality, fraud and predatory practices of the sort that have been uncovered in recent times in the subprime mortgage market”. But also legal means are deployed, including “privatisation of what were once considered common property resources (like water and education), the use of the power of eminent domains to seize assets, widespread practices of takeovers, mergers and the like that result in ‘asset stripping’, and reneging on, say, pension and health care obligations through bankruptcy proceedings”.
Dispossession means excluding, thus reaffirming the definition of the term as a verb. But all these processes of social exclusion tend to reproduce a fundamental precondition of capitalism, namely the state of social exclusion. This argument seems consistent with the view held by Luhmann who distinguishes between pre-modern and modern societies (Braeckman, 2006). In pre-modern societies, Luhmann claims,
the individual is basically included due to family bonds. Being inside and included is linked to the individual as a person, thus, one is either completely included or excluded. Moreover, one is included in only one system as in pre-modern society households constitute the systems. Each such sub-system can be characterised as multifunctional, i.e. it serves many functions.
Modern societies are instead functionally differentiated. The various sub-systems perform different functions. The same individual is now participating as a voter, consumer, student and/or music fan, but in different sub-systems. No one is, for example, neither just a voter nor a consumer. We are both voters and consumers, but in different sub-systems and thus with different conditions for being included. In order for the individual to appear and feel as a whole individual, she/he must reconcile what in reality is systemically separated. Beck (1998: 220) describes it as a separation between subsystems which runs right through the individual and which the individual has to integrate in her/his life history. In modern society, the individual is basically excluded.
Therefore, social exclusion should neither solely be defined as a process (verb) nor as a state (noun), but as both. It is a matter of both excluding people and the state they are in. Accordingly, both the causes that exclude people and the conditions that hinder people from getting included have to be analysed. It might be argued that using the term social exclusion in its form as a state, “utanförskap” in Swedish, contributes to stigmatisation. That is certainly a risk but the term also helps recognising a particular situation. For what should the result of dispossession be called when it also means being excluded from any influence in society? We may call it a state of social exclusion (Braeckman, 2006: 74); and it is this state of social exclusion which some of the reports describe.
Using the term social exclusion both as a noun and as a verb paves the way for a fundamental critique of contemporary society. Moreover, it makes it possible to recognize the excluded on their own conditions. Being excluded does not necessarily equate with being useless or worthless. More specifically, it means that you do not fulfil the conditions for being included or perhaps do not want to fulfil them. The European Commission (European Commission, 2012b: 144) actually hints at such a definition when they claim that “situations of poverty and social exclusion are relative in time and space”. Relative to what? Such a line of inquiry is very seldom pursued, probably because it opens up the scope for a critique of contemporary society. Perhaps the main problem is not a matter of the excluded young people lacking competencies, but that society fails to recognize and make use of it. We will return to this last point in chapter 6.
Using the term social exclusion both as a noun and as a verb enables two sets of questions regarding the inequality affecting young people. Firstly, what are the conditions that hinder young people from getting included, that the young people affected by inequalities and in particular the NEETs do not fulfil? Secondly, why and how does society cause the inequalities that affect young people and even exclude some of them? These are the questions that will be guiding for the subsequent chapters.
3.
Growth models
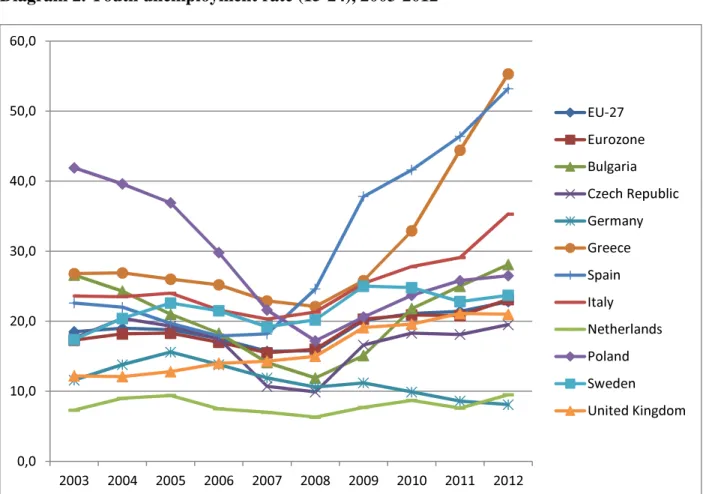
The global crisis that started as a banking crisis in 2008 has put its imprint on all the countries across Europe. The youth unemployment rate (15-24) increased from 2007-2012 in all the countries involved in Citispyce, except for Germany where it decreased from 11,9% to 8,1%.2 In contrast, the youth unemployment rate has increased by 2,9 times in Spain, from 18,3% to 53,2%, and by 2,4 times in Greece, from 23,0% to 55,3%. This also shows the differences in point of departure. Greece had the highest youth unemployment before the crisis set in. The youth unemployment rate was high also in Poland, 21,6%.
Diagram 2. Youth unemployment rate (15-24), 2003-2012
This has led to an increase in long-term unemployment, but not in all the countries and not to the same extent (European Commission, 2012a: 168). It has increased in Greece, Spain and somewhat also in the Netherlands, but not in the Czech Republic nor in Poland. Among the employed, the share of those with temporary employments has increased overall in Europe, but not in all the countries and to very different extents. Also the share of part-time work has increased, but again to different degrees and from various points of departure.
2
Available at:
http://epp.eurostat.ec.europa.eu/statistics_explained/index.php?title=File:Youth_unemployment_rate_ratio,_2012.png&filetimest amp=20130710115744 (accessed 3 October 2013)
0,0 10,0 20,0 30,0 40,0 50,0 60,0 2003 2004 2005 2006 2007 2008 2009 2010 2011 2012 EU-27 Eurozone Bulgaria Czech Republic Germany Greece Spain Italy Netherlands Poland Sweden United Kingdom
To conclude, young people across Europe have been affected by the crisis but to various extents and in different ways. The comparisons on the basis of symptom indicators will not take us further than that. Thus, we will not be able to make assessments of the situation for young people in cities on one single scale. The situation may be worse in one sense and better in another. For example, the situation looks perhaps good in Poland where a remarkably high share of the 25-29 have jobs, but as a remarkable share of these jobs are temporary, that probably causes a lot of uncertainty; and how do we grade that uncertainty in relation to the uncertainty caused in other ways?
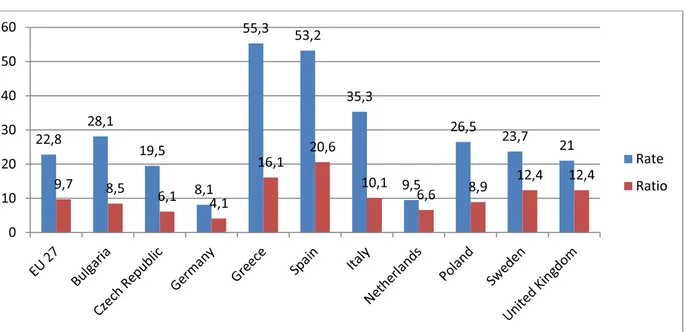
Really, what do we know about what the indicators indicate? Indeed, they all have their limitations and shortcomings. One of the most used indicators of inequality in the labour market is the unemployment rate. It measures unemployed people in a particular age group as a percentage of the total labour force (both employed and unemployed). It covers only, however, the active population and thus excludes those classified neither as employed nor as unemployed, for example students. To be classified as unemployed you need actively to seek employment. For that reason, the unemployment ratio seems to be a more accurate indicator as it covers the proportion of people registered as unemployed over the total population in the same group.3 Among the countries in our project, Spain has the highest unemployment ratio, 19%. None of the other countries comes near that high level. Germany, The Netherlands and The Czech Republic have the lowest unemployment ratios, between 4-7%.
Diagram 3. Youth unemployment rate and ratio (15-24), 2012
Getting a job is not, however, necessarily the solution. Also, conditions and quality matter. For example, the job may be temporary, of which Poland (Chrabąszcz et al., 2013: 6) has the highest share. 66% of the jobs there are temporary, compared with only 8% in Bulgaria (Eurofound, 2012: 16). On the other hand,
3
Available at:
http://epp.eurostat.ec.europa.eu/statistics_explained/index.php?title=File:Youth_unemployment_rate_ratio,_2012.png&filetimest amp=20130710115744 (accessed 3 October 2013)
22,8 28,1 19,5 8,1 55,3 53,2 35,3 9,5 26,5 23,7 21 9,7 8,5 6,1 4,1 16,1 20,6 10,1 6,6 8,9 12,4 12,4 0 10 20 30 40 50 60 Rate Ratio
Bulgaria has the lowest employment rate among young people, which means that the share in relation to all those taking advantage of the permanent jobs is not particular high.
One may wonder what the rest do. In Bulgaria, only 27% of the young people aged 15-24 are either employed or registered as unemployed (European Commission, 2012b: 406). In Italy, it is the same. What do the rest do? Study? Some of them certainly do but far from all of them. Thus, in all probability the unemployed consist of many more than the registered ones. That means that youth unemployment is considerably higher than what the figures indicate.
Thus, we may take for granted that young people are affected by inequalities in all the countries but in different ways. We do not really know, however, to what extent, due to the inaccuracy of statistics. But even with more accurate statistics we would not have been much wiser. For example, Sweden and the UK have the same unemployment ratio, which may then look as if they have the same problem. They do not. Behind these figures lie very different causes. In order to understand that we need to know about the different economic structures across Europe.
In Industrial relations 2008 the European Commission suggests a classification. They start by highlighting some commonalities which the western member states of the European Union share and which distinguishes the EU from other regions in the world. In post-war western Europe, the industrial relations arrangements and their achievement in contributing to growth and publicly secured social protection have rested on four institutional pillars (European Commission, 2008: 19); “strong or reasonably established and publicly guaranteed trade unions; a degree of solidarity wage setting based on coordination at the sectoral level or above; a fairly generalized arrangement of information, consultation, and perhaps co-determination at the firm level based on the rights of workers and unions to be involved; and routine participation in tripartite policy arrangements.”
From the perspective of regulation theory (see Introduction), these four pillars are associated with the so-called Fordist mode of regulation. This was linked to the fordist regime of capital accumulation, which consisted of a virtuous circle of mass production and mass consumption. A fordist growth model existed when this regime of accumulation was coherently combined with its associated mode of regulation. Fordism, however, was developed unevenly across Europe. In Britain, Fordism has been described as flawed, while an export-oriented flexi-fordism developed in Germany (Jessop and Sum, 2006: 128-133). The countries in southern Europe did not develop Fordist growth models due to their large agrarian sectors and late industrial development. Yet, they were affected by the general crisis of the Fordist growth model during the 1970s. When new growth models eventually appeared, it turned out that the differences between the European economies had increased.
In Industrial relations 2008, and more recently in Industrial relations 2012 (European Commission, 2013: 47), the European Commission tries to classify these differences. On the basis of several typologies, the report identifies five models of industrial relations, associated with different geographical areas. The Nordic model is characterised by being inclusive and coordinated as well as having a high
union density and collective bargaining coverage. The Central European model is also coordinated, but dualistic and it has a middle-range union density, although a quite high bargaining coverage. The Western model is uncoordinated and market-oriented as well as characterized by a low union density and also low coverage of collective bargaining. In the Southern model, described as state-centred and dualistic, union density is extremely low but bargaining coverage rather high. The Eastern model has both an extremely low union density and a low bargaining coverage. Citispyce contains representatives for all these five models.
From the perspective of regulation theory, these five categories concern the structural form called the wage relation. As such, however, categorisation is useful. In order to make the categories even more useful, these five different forms of wage relations will be linked to different regimes of accumulation. As Becker and Jäger (2011: 4) maintain “to understand the crisis of the EU and the Eurozone and the responses to the crisis it is necessary to analyse the content of structural forms, their interaction and territoriality together with the regimes of accumulation.” Together these five different forms of wage relations and their structurally coupled regimes of accumulation constitute five models of growth. Each one of them will be dealt with in turn and the reports will be used to clarify how they have been actualised. The aim is to highlight the model-specific causes of inequality, the ones that makes it difficult for young people to get included as well as the ones that exclude them.
3.1.
Dependent financialisation in the south
Countries in the south of Europe have pursued an import oriented regime of capital accumulation, depending on borrowed money and indicated by current account deficits in Spain and Greece at least since the mid-1990s. The increasing indebtedness has been driven by consumption but also by rising prices on real estate (Lapavistas et al., 2012: 19). The main reason for increasing debt has been the loss of competiveness. That has forced peripheral countries to focus on boosting domestic demand, above all, through investment in real estate and consumption (Lapavistas et al., 2012: 92).
This regime of accumulation has been called dependent financialisation (Becker and Weissenbacher (2012). With the support of Fine (2011), we may define the concept of financialisation by referring to the phenomenal expansion of financial assets and financial activity relative to the rest of the economy over the last thirty years. Financialisation has comprised “the proliferation of different types of assets, not least through the expansion of securitisation, derivatives, exchange rate speculation and corresponding futures markets for currencies as well as for many commodities”. Moreover, this proliferation has occurred at the expense of the real economy. Financialisation “has been perceived to be dependent upon consumer-led booms based on credit in which the housing market in particular has been the basis for a central speculative asset”. It has also penetrated generally into “ever more areas of economic and social life such as pensions, education, health, and provision of economic and social infrastructure.”
In addition to the definition suggested by Fine, financialisation has to be treated in conjunction with the finance-dominated regime of accumulation. This differs from the fordist regime of accumulation, where productive capital dominated and the wage was regarded as a source of demand. Therefore, increases in real wages were in the interest of both capital and labour. In the finance-dominated regime of accumulation the wage is regarded as a cost and has to be kept as low as possible. Hence, the wage share has declined in all OECD countries, according to Stockhammer (2013: 1) on average from 73,4% in 1980 to 64% in 2007, constituting “a major historical change as wage shares had been stable or increasing in the post-war era”. The results of Stockhammer’s study indicate that financialisation has been the main cause of the decline in the wage share.
In Spain, the continuous economic growth for 14 years, from 1994 to 2008, and the veritable economic boom in the last decade of this period, built on loans. As Lapavistas et al. (2012: 93) shows, “aggregate Spanish debt has risen dramatically as a proportion of GDP since the late 1990s. The bulk of growth has been in private debt, driven mostly by rising debt of the financial sector”. In contrast, Spanish public debt has actually declined in relative terms since the late 90s. Money was mainly invested in construction and its subordinated industrial production, not for example in export oriented production or an increased productivity (Lapavistas et al., 2012: 27). That made the growth model vulnerable to changes in borrowing conditions. Accordingly and as the Barcelona report highlights, sectors closely related to the previous economic growth were affected more severely by the crisis.
In Greece, the public sector debt has been a far more significant part of aggregate debt than in Spain and Portugal. This has been a feature of the Greek economy since the 1980s, the initial growth of public debt being an outcome of the expansion of public expenses and mismanagement (Lapavistas et al., 2012: 95). For instance, the Athens report describes that although the National Health System, founded in 1982, was originally a breakthrough concept at the time, gradually, great administrative loopholes, mismanagement and lack of monitoring, resulted in poor public health services, worsening during the time of the crisis (Avatangelou et al., 2013: 11). The Greek welfare state in general is currently described as dysfunctional and inefficient. Obviously, despite the great expectations of certain legal provisions, operation mechanisms remained ineffective and the welfare state did not manage to support the development of a competitive economy deserving its place in the international division of labour.
In Italy, the general government gross debt as a percentage of GDP has exceeded 100% every year since at least the mid-1990s. Dependent financialisation has not, however, engendered the same dynamic as in Spain and Greece. Italy has suffered from slow growth since the late 1990s. As Tridico (2013: 18) concludes, “Italy used to be a richer country, with an average GDP above the EU15 (the richest club), and today it is far below this average level”. According to the detailed analysis made by Tridico, this depends on the past reforms of the labour market, in particular the labour flexibility introduced in the last 15 years. The development of the welfare state in Greece can be interpreted as an attempt to catch up regarding modes of regulation instituted in other countries during the heydays of Fordism. Another such attempt
was made to establish the kind of wage relation associated with Fordism when pressures by the Unions led to the establishment of some ‘protective’ laws restricting the use of fixed-term contracts. Accordingly, in 2007 Greece’s rate of fixed-term contracts was below the EU27 average, the Athens report tells us, but “nevertheless, after the eruption of the crisis, temporary employment came dynamically to the forefront and permanent employment declined, within the general measures taken for the enhancement of “flexible work”.” (Avatangelou et al., 2013: 8)
The restrictions on fixed-term contracts in Greece did perhaps alleviate the effects of the division between insiders and outsiders, characterising the southern form of wage relation. In contrast, on the labour market of Spain a tendency to rely on temporary work contracts, especially for young people, has been the norm. As the Barcelona report (Roiha et al., 2013: 6) states, “a key reason why temporary contracts do not lead to permanent employment in the Spanish context is the large difference between dismissal costs for temporary and permanent contracts, making companies reluctant to convert fixed-term contracts into open-ended ones. … This means that many young people are trapped in precarious employment or unemployment, with unfavourable effects for their long-term employability and large costs for society as a whole.”
The dualistic division and the concomitant existence of a market for low skills seemed to have made it legitimate for a substantial share of young people not to educate themselves. As the Barcelona report mentions, a high share of youth (15-24) in Spain have attained at most lower secondary education, but yet “until 2007, the unemployment rate of low-skilled workers was not much higher than that of skilled workers, indicating a great deal of low-skilled jobs in the construction and hospitality sectors in the past” (Roiha et al., 2013: 7). The first to lose their jobs during the crisis, however, were these low-skilled youths and “they are also likely to be in a disadvantageous position in terms of accessing new jobs when the economy recovers, considering the growing demand of high and intermediate levels of skills”.
In general, young people have been particularly vulnerable due to the southern form of wage relation with its dualistic labour market dividing workers in insiders and outsiders. They do not seem to have had any legitimate representatives at the labour market. Union density is extremely low in the southern form of wage relation. As the Athens report (Avatangelou et al., 2013: 19) maintains, “participation of young people in labour unions is minimum in Greece, mainly due to the neglect and lack of good practices for attracting youth.” The Greek trade unions have failed to offer a fresh view to young people and tend to have restricted themselves to safeguard the insiders.
To this another characteristic of the Southern growth model can be added, and that is its weak learning opportunities. Lundvall and Lorenz (2012: 237) make a distinction between four different forms of work organisation; discretionary learning (DL), lean production, taylorist organisation and traditional organisation. The forms of work organisation differ with regard to problem solving and learning on the job as well as the degree of freedom that the worker has to organise his or her work. Discretionary learning is the form where employees are engaged in work activities involving problem solving and
learning. The concept refers to “work settings where a lot of responsibility is allocated to the employee who is expected to solve problems on his or her own” (2012: 238). That matters, Lundvall and Lorenz claim (2012: 237), because “… the key to economic success for a national or regional economy is its capacity to renew competencies in order to be able to move into activities that are less exposed to global competition.” It is simply less efficient to operate in a hierarchical organisation when the environment changes rapidly. The Southern growth model, however, consists to a high degree of hierarchical organisations. In 2000, only around 20% of the employees in Spain and Greece worked in organisations characterised by discretionary learning and since then it has further decreased.4 In Italy, the corresponding figures has been higher (30% in the year 2000), but yet far below the shares in the Netherlands (64%), Sweden (53%) and Germany (44%) (Lundvall and Lorenz: 2012: 249).
Yet, in Spain and Greece the growth model seemed to be successful. In 2003, Greece had the highest growth rate among the countries in the European Union, 5,9%, compared to -0,4% in Germany. As the Athens report (Avatangelou et al., 2013: 2) states, “an unexpected growth throughout the 1990s, also continued into the new millennium, involving a major improvement in employability, welfare and citizens’ living standards and providing immense opportunities to young people at the time.” Yet, just a few years later, everything had been turned upside down and the growth model had proved to be unsustainable. The crisis has led to the collapse of this growth model, the one characterized as dependent financialisation.
3.2.
Export-orientation in the centre
The Central European model consists of an export-oriented regime of accumulation, regarding both goods and capital, where productive capital dominates. In contrast to the countries with dependent financialisation, Germany has had a surplus in its account balance since 2001, rising until 2007. This surplus has not depended on superior productivity growth, which has been weaker than for example Greece (Lapavistas et al., 2012: 26), but on a favourable situation in the Eurozone as well as an internal pressure on pay and conditions. Growth in Germany has in fact been mediocre. In addition, investment has been flat, consumption stagnant, savings rising and household debt falling. The question arises about what has engendered growth. As Lapavistas et al. (2012: 21) underlines, “the only source of dynamism has been exports” and two thirds of German trade is with the Eurozone (2012: 30). As the leading country of this growth model, Germany has become very rich.
One of the most important industrial centres in Germany, and indeed of this growth model is Hamburg. It shows all the benefits of this growth model. As the Hamburg report (Gehrke et al., 2013: 7) states, “never before has the number of people in employment been as high”. In fact, Hamburg is one of the richest
4
According to a lecture given by Bengt-Åke Lundvall at the international Helix conference in Linköping, 12 June 2013, where he referred to recent research available at: http://www.ike.aau.dk/digitalAssets/71/71537_holmlorenzemaee2013.pdf (accessed 4 October 2013).
cities in Europe, ranking four of the 271 NUTS-2 regions with regard to GDP comparison per capita. The Hamburg report gives the impression of a city with a lot of space for discretionary learning:
The City of Hamburg has a prosperous and innovative scene that spans across the arts and creative industries, including services and production related to new technologies and software development, media and journalism, advertising and design. Beside the typical hot spots in which young urban professionals have already established centres for multimedia and all types of creative and independent arts and technology (Schanzenviertel/St. Pauli/ Ottensen), many new creative cells are spread all over the city. (Gehrke et al., 2013: 4)
The report also highlights, however, the costs of this model because “at the same time, precarious jobs (short term or part time contracts - with less protection than in previous decades when permanent contracts were the norm) are increasingly common, even for middle classes, causing uncertainty and unease” (Gehrke et al., 2013: 8). The Hamburg report mentions subcontracted temporary employment, “which increased by 95% during 2000-2011 up to now 3.4% of all formal employment contracts (the national average is 2.9%). Half of these contracts are for less than three months and typically, the wages are much lower compared to average wages in regular employment contracts” (Gehrke et al., 2013: 9). Since 2000, the low wage sector has increased by 38% and in 2010, it comprised 19% of all employees working with an income of less than 1890 Euro per month. People in general have benefitted from the regime of capital accumulation but a substantial share of the population has not been favoured by its form of wage relation. As Becker and Jäger (2011: 6) emphasise, the low wage sector is as important in Germany as in the USA. According to Eurostat data, the proportion of low-wage earners among all employees is among the highest in Europe, 22,2%, slightly higher than in the UK (22,1%).5
Rotterdam with its harbour is certainly a very important node in this growth model. As the Rotterdam report (Spies and Tan, 2013: 7) maintains, “from the 19th century onward the harbour and the economic activity that comes with it, has been the most important source of employment in the region”. A lot of the low-skilled work, associated with the harbour and traditionally dominating the labour market, has however disappeared. The Rotterdam report tells us how the labour market has changed, also in terms of the wage relation. Flexibility is increasing and fewer people have a permanent job. Nevertheless, the Dutch economy seems to have positioned itself successfully in the international division of labour, indicated for example by a surplus in the current account balance for decades and by low levels of unemployment. Netherlands has one of the highest percentages of employees working in organisations characterised by discretionary learning, 64% in 2000, although it has decreased since then. Obviously, that makes the Dutch economy competitive and allows it to provide job opportunities for young people.
5
Available at: http://epp.eurostat.ec.europa.eu/statistics_explained/index.php?title=File:Figure2_Proportion_of_low-wage_earners,_%25,_2006_and_2010.png&filetimestamp=20130201090333 (accessed 6 October 2013)
3.3.
Dependent export-orientation in the east
The Czech Republic, Poland and Bulgaria have in common the legacies of the severe recessions and de-industrialisation that occurred in the early 1990s as a result of the transformation to capitalism. It took until the late 1990s until the growth models became more neatly defined. Becker and Weissenbacher (2012: 5) characterise the growth model of the Czech Republic and Poland as a combination of export-oriented industrialisation and dependent financialisation. “These growth models corresponded to the accumulation strategies of West European companies – the outsourcing of production by German manufacturing companies and the export of money capital.”
The key sectors, export industry and banking, became dominated by Western European companies. In that way, the Czech Republic and Poland were closely linked to the German export industry and productive system. As the Brno report (Sirovatka and Valkova, 2013) reaffirms, “the economy of the country is very much tied to the performance of manufacturing industries, the exporters in particular, strongly influenced by the development of the economy in Germany”. Due to this dependence the growth model has proved to be highly vulnerable, Becker and Weissenbacher (2012: 9) concludes, “but it has at least a productive base – though usually a very narrow and extraverted one”. The expansion of domestic demand has relied significantly on increasing household debt.
Regarding the industrial relations, union density is below 20% in both the Czech Republic and Poland, while bargaining coverage is higher in both countries, around 40%, but yet much lower than the average of the EU-27 (European Commission, 2013: 23). Active labour market policies are rather underdeveloped, in the Czech Republic amounting to 0,3% of GDP and in Poland 0,7% (2010). As the Brno report (Sirovatka and Valkova, 2013: 7) puts it, “the Czech Republic prefers rather to have an increasingly flexible labour market and force the unemployed to take any job available than to invest into job creation and employability”.
In contrast, financialisation was the main motor of the growth regime in Bulgaria, Becker and Weissenbacher (2012) maintain, relying on huge capital inflows. During 2001-2007, Bulgaria attracted considerable amounts of Foreign Direct Investment. This led to the emergence of an unsustainable current account deficit. The pre-crisis growth model proved compatible with increased labour force participation, a significant jump in employment levels and much lower unemployment. The Sofia report explains what happened:
The limited construction of new housing in combination with the increased demand pushed the housing prices progressively upwards. With the stabilisation of the economic situation in Bulgaria and a clear course towards EU membership, the Bulgarian property market became interesting for foreigners. In addition, numerous Bulgarians who emigrated during the 1990s started investing in property in the country, giving a push to a construction boom from 2000 to 2008, during which property prices increased dramatically. (Hajdinjak and Kosseva, 2013: 17)
That made the Bulgarian economy vulnerable in a way similar to the countries with dependent financialisation. Hence, the global financial crisis led to a considerable decline in the economy. Both private consumption and foreign investment declined rapidly in 2009 and 2010. Although a very modest growth resumed in 2010, both private consumption and investment remained quite low even by 2012, when they began to recover in most EU countries. Today, the most important obstacles for foreign investment and economic growth remain low productivity and competitiveness on the European and global markets, which are a consequence of inadequate R&D funding and a lack of a clearly defined development policy.
Bulgarian households are under heavy burden of low incomes, high unemployment, the declining property prices and the fear that the jobs market will deteriorate further. Severe constraints on access to credit, concerns about liquidity in banks with strong linkages to EU-15 countries and very high real interest rates are also major factors inhibiting investment. Wage levels remain the lowest in the EU and the low-wage sector comprises 22% of all employees.6 As a result of low average wages, Bulgaria enjoys substantially lower unit labour costs, which means that Bulgaria has to rely on industries with low added value – a factor preventing a catch-up with the more advanced countries of the EU. For example, the majority of Bulgarian exports are products with very low skill content (clothing, footwear, iron and steel, machinery and equipment).7
3.4.
Superior financialisation in the west
The Birmingham report (Robinson et al., 2013: 8) mentions how the crisis revealed several systemic vulnerabilities of a previously outwardly successful economy, “a house price bubble, an over-extended banking system, an over-indebted household sector”. These are the symptoms of an extreme financialisation which has its background in the political project of the Thatcher governments in the 1980s to make Britain, and London in particular, the principal site for international financial institutions. Since then, the UK has had a deficit in its annual current account balance. Thatcherism in the 1980s set the UK on a path which also included the weakening of the unions and led to high levels of unemployment, in Birmingham rising to over 20%.
Many of those out of work were low-skilled manual workers with minimal or no qualifications and had no tradition of self-employment. They were ill-equipped to access new opportunities which required higher levels of literacy and numeracy. They were in no small part victims of the structural shift in economic policy espoused by the Thatcher government in the 1980’s. This was the case across the country, where the emergent neo-liberal economic settlement significantly altered the cultural as well as economic bedrock of Britain. (Robinson et al., 2013: 4)
6
Available at: http://epp.eurostat.ec.europa.eu/statistics_explained/index.php?title=File:Figure2_Proportion_of_low-wage_earners,_%25,_2006_and_2010.png&filetimestamp=20130201090333 (accessed 6 October 2013)
7
Currently, Britain has a low union density and one of the lowest bargaining coverage rates in Europe (Ind rel 2012: 22). Another legacy of the Thatcher governments in the 1980s is the emphasis on flexibilizing wages, hours and working conditions, instead of reskilling workers (Jessop, 2006: 135). The UK displays the lowest level of spending on active labour market policies in the whole of the EU (European Commission, 2012b: 96). Thus, the victims of the structural shift, mentioned in the quote above, have not got much support to cope with the new flexible conditions and instead become permanently socially excluded, sometimes for generations.
Youth unemployment in the UK was quite low before the crisis and lower than the average of the EU-27. It has been argued that the deregulated labour market makes it easier for young people to get a job. It certainly makes it easier to lose jobs as well. The inequalities have been transformed into the labour market and many young people work on precarious conditions. An example mentioned in the Birmingham report (Robinson et al., 2013: 7) is the so-called zero contract, “whereby people agree to be available for work as and when required but they have no guaranteed hours or time of work”.
According to Lundvall and Lorenz (2012: 250), the UK belongs to the countries with the lowest frequencies of discretionary learning. They relate that to income inequality and claim that “the countries with the highest degree of income inequality (the UK and Portugal) are amongst those that are most unequal in terms of access to discretionary learning and that those countries (Denmark and the Netherlands) that have the most equal income distribution also offer the most egalitarian access to jobs with discretionary learning.” This means that young people who get a job in the UK are more likely than in other countries to also get a low income and less likely to learn something useful for a future career.
3.5.
Export-orientation and financialisation in the north
The growth model in Sweden is characterized by export-orientation, just like the German one, and Sweden has had a surplus in its current account balance every year since 1994. In contrast to the German growth model, however, households in Sweden have become heavily involved in financialisation through both assets (pensions and insurance) and liabilities (mortgage and unsecured debt). Financialisation in Sweden has become, what Becker and Jäger (2011) call, mass-based. A part of the pension system has been privatised via the implantation of capital based schemes. Housing prices have increased almost constantly since the late 1990s and households are heavily indebted. The government, therefore, announced at the end of August 2013 the establishment of a “stability council”.
The unions are, however, still quite strong and the collective agreements do still cover a considerable part of the labour market. This has contributed to strengthening competiveness, but not as in the German case through reduced wages and the preservation of a low-wage sector. According to Eurostat data, Sweden has the smallest low-wage sector in Europe.8 The proportion of low-wage earners is only 2,5% of all
8
Available at: http://epp.eurostat.ec.europa.eu/statistics_explained/index.php?title=File:Figure2_Proportion_of_low-wage_earners,_%25,_2006_and_2010.png&filetimestamp=20130201090333 (accessed 6 October 2013)