. V/Lsärtryck
171
1991
Variation in drivers' cognitive load. Effects of
driving through village areas and rural
junctions
Lisbeth Harms
Reprint from Ergonomics, 1991, Vol 34, No 2, pp 151-160
Veg-och Hf/l!-
Statens vag- och trafikinstitut (VTI) * 581 01 LinkGping
' Institutet swedish Road and Traffic Research Institute * $-581 01 LinkGping Sweden
Variation in drivers cognitive load. Effects of driving through
village areas and rural junctions
LISBETH HARMS
Swedish Road and Traf c Research Institute, VTI S 58101 Linköping. Sweden Keywords: Driving; Dual-task performance; Cognitive load.
Two experiments were performed in which drivers cognitive load was
measured by the time taken to complete calculation tasks presented to them
while driving on prespeci ed routes. Experiment l was conducted on two different driving routes. Both routes included driving on a highway and driving through a village area. Mean driving speed was lower and mean calculation time was higher in the village areas than on the adjacent highway sections of the two driving routes. Across successive IOO-m intervals of the
two driving routes, drivers cognitive load was found to be inversely related to their driving speed. Experiment 2 tested the same dual-task method on
driving routes including two rural junctions. At both junctions driving speed decreased with decreasing distance to the give-way line and the drivers cognitive load was highest while approaching and driving through the
junctions. It is concluded that the applied dual-task method is sensitive to the
variation in drivers cognitive load caused by variations in the demands of the driving task.
]. Introduction
Does driving in different traffic environments induce measurable variations in
drivers cognitive load? Following Shiffrin and Schneider (1977) and Schneider
and Shiffrin (1977), two qualitatively different types of information processing
strategies can be distinguished. Controlled processing is a temporary sequence of
nodes activated under control of, and through attention by, the subject .
Controlled processing is capacity-limited and is usually serial. It is flexible, but
being capacity-limited its ef ciency is highly dependent on load. In contrast
automatic processing denotes the automatic activation of a sequence of nodes by a certain stimulus configuration . Consistent practice is of crucial importance to the development of automatic processing. Once established, automatic processing proceeds without attentional control and without stressing the
capacity limitations of the system.
Driving skill has been associated with automatic processing developed
through driving practice (Summala 1988), but the exibility in drivers responses
and the variability of traf c environments suggest that driving in real traf c may
require controlled processing. Consequently, variations of traf c environments
may be expected to induce measurable variations in drivers cognitive load.
2. Previous studies
Measurements of variations in drivers processing capacity by dual-task methods have been conducted by a number of authors (Brown 1965, 1967, 1968, Brown and Poulton 1961, Wiegand 1974, see also Ogden et al. 1979 and Hicks and Wierwille 1979). The present study used mental calculation as a secondary task
for the measurement of drivers cognitive load. The time taken by the driver to complete a calculation task was measured and related to positions on
prespecified driving routes.
The study is a continuation of a previous study described by Harms (1986). It aimed at testing the generality of the previous results by repeating the measurements in driving environments similar to those studied previously and
by adding measurements of cognitive load in driving environments being
different from those.
The previous study (Harms 1986) included three different driving routes.
Each driving route consisted of a highway section and a village section. On each
driving route the mean speed was lower and the mean calculation time was
greater on the sections of the driving routes lying within the borderlines of a
village area than it was on the adjacent highway sections. Across successive lOO-m intervals of each route, a negative correlation was found between mean
driving speed and mean calculation time. Within the borderlines of the village
areas, high cognitive load in lOO-m intervals was associated with a high number
of reported accidents in the same intervals. No such relationship was found
between driving speed and number of reported accidents. 3. Experiment 1
Experiment 1 was undertaken to test the generality of the effects found in the
previous study (Harms 1986). It was performed two years later on two of the
same driving routes that had been used for the previous study. In the time period
between the two experiments, the sections of the driving routes lying within the
borderlines of the village areas had been reconstructed in accordance with
principles of milieu-adapted through traf c (Herrstedt 1988). The reconstruction aimed to reduce the driving speed of the through traf c in the village areas and to improve the way through traf c interacted with the internal village traf c. The legal speed limit on the highways 80 km/h was the same for both experiments but nationwide the legal speed limit in built-up areas had been lowered from 60 km/h to 50 km/h in the time period between the two experiments.
3.1. Method
3.1.1. Subjects: Nineteen professional drivers recruited from a private salvage
organization participated in the driving experiment. Nine served in Area 1 and
ten in Area 2.
3.1.2. Driving task: Both driving routes included highway driving and driving
through a village area. The routes had xed locations for starting and stopping on
the highway. Route lengths were 5-8 km in Area l which included l-7 km in the
village area, and 3-7 km in Area 2 which included 12 km in the village area. The
drivers were instructed to drive as they usually would do and to perform the
calculation tasks at their own pace. All subjects performed one test trial before the rst experimental session.
3.1.3. Calculation task: The drivers cognitive load was measured by the time
taken to complete a calculation task. The task was to subtract a smaller number
from a greater number in a spoken two-digit number. A random sequence of the
numbers from 20 to 99 was stored on a tape. The two-digit numbers were
device stopped the tape after playing a stimulus number and restarted the tape
after the termination of the subject s verbal answer. The presentation of each
stimulus number followed the termination of the answer to the previous one with
a delay of approximately 500 ms.
3.1.4. Apparatus: The experimental car (Open Kadett 1.3, 1982) was equipped with two tape recorders: one (Sony TCM-134) played the random two-digit number tape over the driver s headphones (Sennheiser HME 410C, with microphone); the other tape recorder (Sony TC-DSM) was used solely for
recordings. The rst tape recorder started and stopped automatically when
playing the numbers, and the other recorded continuously throughout the
driving session. Drivers verbal responses were recorded on one track, questions
(two-digit numbers) and signals for successive 2-6-m intervals of driving were
recorded on the other track.
Coding included time registration of recorded position signals, stimuli and
responses. Driving speed was calculated for each 2~6-m interval, and calculation
times (stimulus-off/response-on intervals) were computed and located to the
position nearest the stimulus-off time. Analysis of driving speed and calculation
time was based on 70 runs with a total of 10 700 registered calculation times in
Area 1 and 93 runs with a total of 13 880 calculation times in Area 2.
3.2. Results
As shown in gure 1, mean driving speed was lower in the village area than on
the highway on both driving routes, but mean calculation time was higher in the
villages than on the highways. The speed reduction between highway and village
areas was seen for all subjects. By sign test the effect was found to be signi cant
(p<0-001). The increase in mean calculation time found for 17 of the 19 subjects was also found to be signi cant (p < 0-01).
As can also be seen in gure 1, the results obtained in Experiment l were
consistent with those of the previous experiment (Harms 1986), but two
differences may be noted. First, within the village areas, driving speed was lower
in the present study than in the previous one. In Area 1, mean driving speed in the village area decreased from 16-3 to 14-2 m/s (59 to 51 km/h) between the two
studies; in Area 2, mean driving speed in the village area decreased from 14-6 to
12-3 m/s (53 to 44 km/h). Both the mean driving speed and the speed difference
between the previous study and Experiment 1 were fully consistent with the
observed mean speeds of passenger cars in the same village areas and time
periods in studies using automatic speed registration (see Borges et al. 1987 and
Borges et al. 1988). Second, mean calculation times were lower in the present study than in the previous one. This effect was found both on the highways and
in the village areas. It was probably due to an undesired miscalibration of the
time registration apparatus between the two studies.
Variance of calculation times varied considerably between subjects. To take
account of this variation, detailed analyses of calculation times were undertaken
after normalizing reaction times for individual subjects (i.e., converting them to
z-scores for each subject individually) before averaging over subjects.
Figure 2 shows the mean driving speed (m/s) and the mean z-score for 34
successive 100-m intervals of the driving route in Area 1. Figure 2 shows that
driving speed was high on the highway, lower near the borderline between the
AREA 1 AREA 2 I _ I I I 22 | 1200 22 I 1200
Vl
|
|
/ _ ; I W I;
:
f
I
E _, E V é 18 ; | 41000 % ä 18l ; | " 1000 gå.!&
f
'
*:
&
U);
' _
r:
8 16 / | 5 C) 16 '/ : å-
/
|
0
/
|
0
> < > <3: E //
'
LU E //
__ | uJ D 14 ; I 800 [I D 14_ ? I -800 I:; :
; :
?
'
?
'
/
H
v
I
H
v
500
/
H ' v
I
H
v
500
Figure l. Mean driving speed and mean reaction time to the calculation task on the highways (H) and in the village areas (V) of Area 1 and Area 2.
Results of the previous study (Harms 1986) are indicated by open columns, hatched
columns indicate the results of Experiment l.
highway and the village, and lowest in the central part of the village. Calculation
times were low on the highway section, higher near the borderline between the
highway section and the village, and highest in the central part of the village.
Roughly speaking the pattern of z-scores was a mirror image of the pattern of
driving speeds. The product moment correlation between mean driving speed and calculation time (mean z-score) was O-56 (compared to -O-61 for the
same driving route in the previous study).
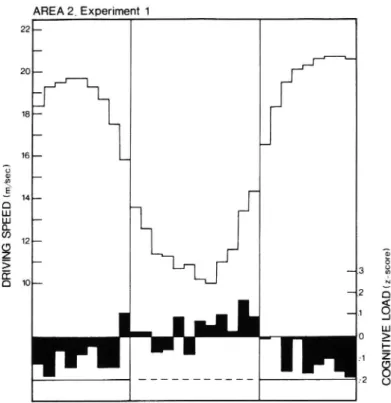
Figure 3 shows the mean driving speed and the mean z-score for successive
intervals of Area 2. As can be seen the general pattern of results was similar to the
pattern for Area 1. The product-moment correlation between driving speed and
calculation time in Area 2 was O-60 (compared to O-76 for the same driving
route in the previous study).
3.3. Discussion
Taken as a whole, the results obtained in both the previous study and in
Experiment 1 are consistent with the assumption that variation in traffic
environments induce measurable variations in drivers cognitive load. Drivers
cognitive load was higher in the village areas than on the highway sections of the
driving routes whereas driving speed was considerably lower in the village areas
than on the highways. The difference in the legal speed limit between these
sections of the driving routes may have determined the speed level in a general
way, but the variations in driving speed between the IOO-m intervals of the
driving routes indicated that environmental variation also in uenced the driving
AREA1, Experiment 1 24 22 20 18 16 D R I V I N G S P E E D (m /s ec ) '_ 'N O CO GN IT IV E L O A D (z sc ore)
l
-Figure 2. Mean driving speed and mean cognitive load (z-scores) for each lOO-m interval of the driving route in Area 1.
The solid line denotes the highway section of the driving route; the dashed line denotes the driving route through the village.
Calculation times increased on the sections of the driving routes within the
borderlines of a village area. This result was obtained in both the previous study,
undertaken before the reconstruction of the driving routes, and in Experiment 1.
The ndings suggest that the complexity of the driving environment in the
village areas, i.e., the density traf c signs, the variety of traf c ow patterns and
the number and types of road users, induced a high load on the drivers
limited-capacity processing system although the driving speed was low in these areas. The driving environments on the highways allowed both a higher speed and a
higher calculation rate than did those in the village areas.
The consistent results obtained on the three different driving routes in the
previous study and on both of the driving routes in Experiment 1 strongly
suggest that the dual-task method used was sensitive in measuring variations in
drivers cognitive load in response to the demands of the driving task.
4. Experiment 2
Experiment 2 tested the assumption that variations in cognitive load are
general effects of variation in the demands of the driving task that can also be
found in other traf c environments. It was predicted that variations in driving
speed and cognitive load similar to the variations found when driving through
156 L. Harms AREA 2, Experiment 1 22» DR IV IN G SP EE D (m /s ec ) 10 C O G N I T I V E L O A D (z -s co re )
Figure 3. Mean driving speed and mean cognitive load (z-scores) for each lOO-m interval of the driving route in Area 2.
The solid line denotes the highway sections of the driving route; the dashed line denotes the driving route through the village.
a village area, would also be found on driving routes leading through rural junctions.
Free sight before the give-way line at rural junctions may provide the driver
with suf cient information to continue driving without pausing at the give-way
line, unless the passage of other vehicles must be awaited. The give-way line is
normally passed at a low driving speed whether the driver passes unhindered through a junction or pauses. However, it may be questioned whether a driver s speed reduction or even a stop at the give-way line can prevent an increase in
cognitive load due to the increase in the task demands associated with driving
through a junction.
4.1. Method
The method was essentially the same as that used in Experiment 1.
4.1.1. Subjects: Fourteen non-professional drivers from a local administration
office volunteered for the driving experiment.
4.1.2. Driving task: The driving routes selected for the experiment were minor
roads passing through two 4-way rural junctions. They were approximately 2 km
apart on the same highway. At both junctions the view was clear before passing
left-tum manoeuvres, right-tum manoeuvres or driving straight through the
junctions.
Analyses of mean driving speed and mean reaction times to the calculation task included a total of 98 passages through Junction 1 with a total of 1010 reaction times and 133 passages through Junction 2 with a total of 1321 reaction times. Of the total of 231 passages, 64 were left-turn manoeuvres, 76 were right-turn manoeuvres, and 91 were runs straight through a junction.
4.2. Results
The analyses of mean driving speed and mean calculation time (z-scores) at the
two junctions were limited to three SO-m intervals of the driving route before the
give-way line, the SO-m interval including the give-way line and three 50-m intervals after the give-way line. Mean driving speeds and mean calculation time
(z-scores) were computed for each subject individually before averaging over
subjects.
18 PJ_UNCT|ON 1
JUNCTION 2
DR IV IN G SP EE D (m /s ec l '.3 CO GN IT IV E L O A D Izsc or e) I I I I I I I I I I I I I I I 175 125 75 25025 75 125 175 125 75 25025 75 125 175Figure 4. Mean driving speed and mean cognitive load (z-scores) in junction 1 and junction 2.
The distance to the give-way line is indicated in metres. The give-way line is indicated by zero.
As can be seen from gure 4 mean driving speed decreased with decreasing
distance to the give-way line in both junctions. The lowest driving speed was
measured in the SO-m interval including the give-way line. Mean calculation time was inversely related to driving speed, as was the case in the previous study
158 L. Harms
found in the SO-m interval including the give-way line and in the preceding SO-m
interval, where the drivers had a clear view. This effect greater calculation time
in these two interval compared to other interval observed was found for 1 1 of the 14 subjects ( p < 0-05 by sign test).
18
F
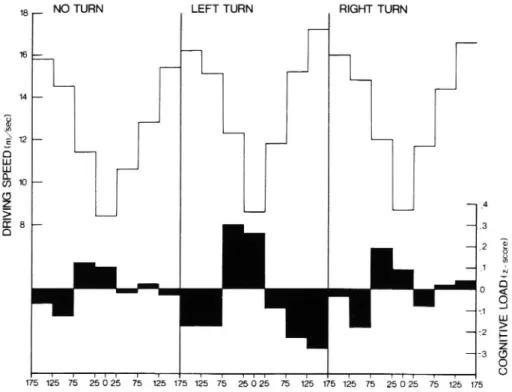
NO TURN LEFT TURN RIGHT TURN12 10 D R l V l N G S P E E D (n t/ se c) CO GN IT IV E L O A D (z -s core ) I I I I I I I I I I T I I I I I I I I I I I 175 125 75 25025 75 125 175 125 75 25025 75 125 175 125 75 25025 75 125 175
Figure 5. Mean driving speed and mean cognitive load (z-scores) for the three different
driving manoeuvres (no-turn, left-turn and right-turn).
The distance to the give-way line is indicated in metres. The give-way line is indicated by zero.
As shown in gure 5 the mean z-score for the two critical intervals (the
interval including the give-way line and the immediately preceding interval) was
considerably higher for left-tum manoeuvres than for either right-turn or no-turn
manoeuvres.
With right-hand traffic, left-turn manoeuvres are usually considered more
demanding at junctions than are both right-turn and no-turn manoeuvres, and
mean cognitive load was highest for left-tum manoeuvres. However, as might
have been expected from the fact that traf c situations varied between drives through the junctions, this effect was not consistent across drives. It was based
on a few runs with very long calculation times associated with left-turn
manoeuvres.
5. General discussion
The results obtained in both the previous study (Harms 1986) and in the current
two experiments showed that variations in drivers cognitive load in response to
method. In both the previous study and in the current experiments the variations
in drivers cognitive load were related to the demands of the driving task caused
by variations in the driving environment of the observed driving routes.
In all the experiments an inverse relationship was found between driving
speed and cognitive load, as measured by the drivers calculation times. Presumably, low task demands on highways allowed the drivers to both perform the calculation task at a high rate and to drive at a high speed. Processing
demands arising from the traf c environments of village areas and rural
junctions were higher and caused a substantial increase in the drivers cognitive load although the drivers actually reduced their speed in those environments.
The difference between the legal speed limit in the villages and on the
highways may have contributed to the pattern of results obtained. Without legal
speed limits the drivers might have maintained a higher driving speed on the
highways and this might have increased their cognitive load on the highway
sections of the driving routes. Presuming that the speed in the complex
environments of village areas and at the junctions would have been at the same
level, it may be assumed that the inverse relationship between driving speed and
cognitive load would have been modi ed or even that it might have disappeared.
On the other hand, it is questionable whether variations in drivers cognitive
load in real traf c can be compensated thoroughly by speed reductions. Traf c
environments may cause a high cognitive load even if the driving speed is extremely low.
The relationship between cognitive load and number of registered accidents
was not investigated in the current study. Findings from the previous study
(Harms 1986) suggested that variations in drivers cognitive load were related to
driving safety.
Both the previous study and the current study referred to variations in the
driving environment that indicated a difference in the driving task. The method
was sensitive to the in uence of these differences on drivers cognitive load. The
dual-task method may even prove to be useful for general assessments of the in uence of driving environments on drivers cognitive load.
Acknowledgements
The experimental studies were conducted at the Danish Council of Traf c Safety Research. The publication of the results was supported with grants from the
Nordic Committee on Road Safety Research (NKT). Thanks also to anonymous
reviewers for helpful criticism and advice.
References
BORGES, P., ANDERSEN, P. S., HERRSTEDT, L. and FJELDSTED, P. 1987, Consequence
evaluation of enviromentally adapted through road in Vinderup, Report 52, Road
Data Laboratory, Danish Road Directorate.
BORGES, P., ANDERSEN, P. S., HERRSTEDT, L. and FJELDSTED, P. 1988, Consequence
evaluation of environmentally adapted through road in Skaerbzek, Report 63. Road
Data Laboratory, Danish Road Directorate.
BROWN, I. D. 1965, A comparison of two subsidiary tasks used to measure fatigue in car
drivers, Ergonomics, 8, 467 473.
BROWN, I. D. 1967, Measurements of control skills vigilance and performance on a
160 Variation in drivers cognitive load
BROWN, 1. D. 1968, Some alternative methods of predicting performance among professional drivers in training, Ergonomics, 1, 13 21.
BROWN, I. D. and POULTON, E. C. 1961, Measuring the spare mental capacity of car drivers by a subsidiary task, Ergonomics, 1, 31-40.
HARMS, L. 1986, Drivers attentional response to environmental variations: a dual-task
real traf c study. In A. G. Gale et al. (eds) Vision in Vehicles, I (North-Holland)
pp 131 138.
HERRSTEDT, L. 1988, Environmentally adapted through-road in Vinderup effect
evaluation, Proceedings from the 14. ARRB Conference, part 2, Traf c, Canberra, 1988, pp 85 97.
HICKS, T. G. and WIERWILLE, W. W. 1979, Comparison of ve mental workload
assessment procedures in a moving base driving simulator, Human Factors, 1, 129 143.
OGDEN, G. D., LEVINE, J. R. and EISNER, E. J. 1979, Measurement of workload by secondary tasks, Human Factors, 5, 529 548.
SCHNEIDER, W. and SHIFFRIN, R. M. 1977, Controlled and automatic human information
processing 1. Detection, search and attention, Psychological Review, 1, 1-66.
SHIFFRIN, R. M. and SCHNEIDER, W. 1977, Controlled and automatic human information processing II. Perceptual learning, automatic attending and general theory,
Psychological Review, 2, 127-190.
SUMMALA, H. 1988, Risk control is not risk adjustment: the zero risk theory of driver behaviour and its implications, Ergonomics, 4, 491 507.
WIEGAND, D. 1974, Die quantitative Messung der psychischen Beanspruchung während des Farhrens durch eine simultane Nebentätigkeit, Zeitschrift ir Experimentelle und Angewandt Psychologie, 4, 679-690.
Manuscript received 24 April 1990.