www.vti.se/publications
Carmen Kettwich Carina Fors
Driver gaze behaviour at cycle crossings in
daylight and at night
VTI rapport 733A Published 2011
Publisher: Publication:
VTI rapport 433A Published: 2011 Project code: 40755 Dnr: 2007/0618-26
SE-581 95 Linköping Sweden Project:
Road-user support in night-time traffic
Author: Sponsor:
Carmen Kettwich Carina Fors
The Swedish Transport Administration
Title:
Driver gaze behaviour at cycle crossings in daylight and at night
Abstract (background, aim, method, result) max 200 words:
The aim of the present study was to evaluate a method for assessment of drivers’ gaze behaviour and to study gaze and driving behaviour at cycle crossings after right turns.
Twenty-one participants were equipped with a head-mounted eye tracking system and were instructed to drive along a predetermined test route in an urban area, in daylight and at night. Five cycle crossings after right turn were passed. At the last cycle crossing during the second driving session, a cyclist was approaching the crossing. After each driving session, the participants filled in a questionnaire.
Gaze behaviour just before and at the cycle crossing was analysed. The participants tended to look towards the cycle path more in daylight than at night. When a cyclist was approaching the crossing, the participants looked at her earlier in daylight than at night.
Using a head-mounted eye tracking system worked well for analysis of gaze behaviour towards well-defined objects. The system worked well in daylight as well as at night. A disadvantage is that the system reduces the drivers’ ability to turn their head.
Keywords:
Night-time traffic, driver, visual behaviour, cycle crossings, right turns
Utgivare: Publikation:
VTI rapport 433A Utgivningsår: 2011 Projektnummer: 40755 Dnr: 2007/0618-26 581 95 Linköping Projektnamn: Trafikantstöd i mörkertrafik Författare: Uppdragsgivare: Carmen Kettwich Carina Fors Trafikverket Titel:
Bilförares blickbeteende vid cykelöverfarter i mörker och i dagsljus
Referat (bakgrund, syfte, metod, resultat) max 200 ord:
Syftet med studien var dels att utvärdera en metod för undersökning av bilförares blickbeteende, dels att studera blick- och körbeteende vid cykelöverfarter efter högersväng.
I studien deltog 21 personer. Deltagarna utrustades med ett huvudmonterat ögonrörelsesystem och fick därefter köra en förutbestämd rutt i Linköpings tätort två gånger, i dagsljus och i mörker. Hälften av deltagarna körde dagsljusbetingelsen först, medan den andra hälften körde mörkerbetingelsen först. Fem cykelöverfarter efter högersväng passerades. Vid den sista cykelöverfarten i den andra och sista kör-ningen (dvs. i dagsljus för hälften av deltagarna och i mörker för andra hälften) närmade sig en cyklist överfarten samtidigt som försöksdeltagaren. Efter varje körning fick deltagarna fylla i en enkät. Blickbeteendet strax innan och vid cykelöverfarterna analyserades. Deltagarna tenderade att titta mer mot cykelvägen i dagsljus än i mörker. När en cyklist närmade sig cykelöverfarten tittade deltagarna tidigare på henne i dagsljus än i mörker.
Att använda ett huvudmonterat ögonrörelsesystem visade sig fungera bra då man är intresserad av att studera blickbeteende mot ett väldefinierat objekt. Systemet fungerade bra både i dagsljus och i mörker. En nackdel är att huvudställningen kan påverka försöksdeltagarnas möjligheter att röra på huvudet.
Nyckelord:
Mörkertrafik, fordonsförare, blickbeteende, cykelöverfart, högersväng
Preface
This report presents the results of the last part of the project called “Road user support in night-time traffic”, which has been financed by the Swedish Road Administration (from April 2010 known as the Swedish Transport Administration). The project aims to investigate road users’ experiences and needs in night-time traffic, with a focus on urban areas. The first part of the project was a literature review and the second part was a focus group study. The results from these first two parts led to two field experiments. The first experiment was about visibility at cycle crossings and the second – which is presented in this report – was about drivers’ gaze and driving behaviour at cycle crossings.
Carmen Kettwich, Carina Fors, Lars Eriksson, Sara Nygårdhs, Sven-Olof Lundkvist and Lena Nilsson planned the study. Carmen Kettwich and Carina Fors carried out the experiment, analysed the data and wrote the report. Harry Sörensen equipped the instrumented vehicle and Katarina Olsson acted as a cyclist.
Peter Aalto has been the contact person at the Swedish Transport Administration. Linköping November 2011
Lena Nilsson Project manager
Quality review
Review seminar was carried out on 13 September 2011 where Anna Niska, VTI, reviewed and commented on the report. Carina Fors has made alterations to the final manuscript of the report. Research director Jan Andersson examined and approved the report for publication on 21 November 2011.
Kvalitetsgranskning
Granskningsseminarium genomfört 2011-09-13 där Anna Niska, VTI, var lektör. Carina Fors har genomfört justeringar av slutligt rapportmanus. Projektledarens närmaste chef Jan Andersson, VTI, har därefter granskat och godkänt publikationen för publicering 2011-11-21.
Table of contents
Summary ... 5 Sammanfattning ... 7 1 Introduction ... 9 1.1 Aim ... 10 1.2 Related publications ... 10 2 Method ... 11 2.1 Participants ... 11 2.2 Instrumented vehicle ... 112.3 Eye tracking system ... 11
2.4 Test route and cycle crossings ... 13
2.5 Experimental design ... 14 2.6 Procedure ... 14 2.7 Questionnaires ... 16 2.8 Photometric measurements ... 17 2.9 Analysis ... 17 3 Results ... 20 3.1 Method evaluation ... 20 3.2 Gaze behaviour ... 21 3.3 Driving behaviour ... 28 3.4 Questionnaires ... 29
4 Discussion and conclusions ... 34
4.1 Method ... 34 4.2 Results ... 36 4.3 Further research ... 37 4.4 Conclusions ... 37 References ... 39 Appendices
Appendix 1 Cycle crossings Appendix 2 Questionnaires
Driver gaze behaviour at cycle crossings in daylight and at night by Carmen Kettwich and Carina Fors
VTI (Swedish National Road and Transport Research Institute) SE-581 95 Linköping Sweden
Summary
Previous studies have indicated that the risk of cyclists being involved in an accident increases at night, and that the visibility at cycle crossings is poor. The aim of the present study was to evaluate a method for assessment of drivers’ gaze behaviour and to study gaze and driving behaviour at cycle crossings after right turns.
Twenty-one drivers participated in the study. The participants were equipped with a head-mounted eye tracking system and were then instructed to drive along a
predetermined test route in the town of Linköping, both in daylight and at night. Five cycle crossings after right turn were passed. At the last cycle crossing during the second and last driving session, a cyclist was approaching the crossing. After each driving session, the participants filled in a questionnaire. The questionnaire that was filled in after the second session was about the participants’ experiences of cycle crossings, among other things.
Gaze behaviour just before and at the cycle crossing was analysed. The participants tended to look towards the cycle path more in daylight than at night. When a cyclist was approaching the crossing, the participants looked at her earlier in daylight than at night. The differences in speed and braking distance between daylight and at night were small. The majority of the participants thought, to some extent, that the visibility at cycle crossings needs to be improved. The most preferred measures were intense street lighting, road sign (with or without flashing lights), reflective material on posts and reflective raised pavement markers.
Using a head-mounted eye tracking system worked well for analysis of gaze behaviour towards well-defined objects. The system worked well in daylight as well as at night. A disadvantage is that the system reduces the drivers’ ability to turn their head.
Bilförares blickbeteende vid cykelöverfarter i mörker och i dagsljus av Carmen Kettwich och Carina Fors
VTI
581 95 Linköping
Sammanfattning
Tidigare studier har visat att cyklister har en ökad olycksrisk i mörker samt att synbar-heten vid cykelöverfarter är dålig. Syftet med den aktuella studien var dels att utvärdera en metod för undersökning av bilförares blickbeteende, dels att studera blick- och kör-beteende vid cykelöverfarter efter högersväng.
I studien deltog 21 personer. Deltagarna utrustades med ett huvudmonterat ögonrörelse-system och fick därefter köra en förutbestämd rutt i Linköpings tätort två gånger, i dagsljus och i mörker. Hälften av deltagarna körde dagsljusbetingelsen först, medan den andra hälften körde mörkerbetingelsen först. Fem cykelöverfarter efter högersväng passerades. Vid den sista cykelöverfarten i den andra och sista körningen (dvs. i dags-ljus för hälften av deltagarna och i mörker för andra hälften) närmade sig en cyklist överfarten samtidigt som försöksdeltagaren. Efter varje körning fick deltagarna fylla i en enkät. Enkäten som fylldes i efter andra körningen handlade bland annat om del-tagarnas upplevelser av cykelöverfarter.
Blickbeteendet strax innan och vid cykelöverfarterna analyserades. Deltagarna tendera-de att titta mer mot cykelvägen i dagsljus än i mörker. När en cyklist närmatendera-de sig cykel-överfarten tittade deltagarna tidigare på henne i dagsljus än i mörker. Skillnaderna i hastighet och bromsavstånd för dagsljus och mörker var små.
En majoritet av deltagarna tyckte att synbarheten av cykelöverfarter efter högersväng i någon mån behöver förbättras. De åtgärder som föredrogs var förstärkt belysning, märke (med eller utan blinkande lampor), reflekterande material på stolpar samt väg-banereflektorer.
Att använda ett huvudmonterat ögonrörelsesystem visade sig fungera bra då man är intresserad av att studera blickbeteende mot ett väldefinierat objekt. Systemet fungerade bra både i dagsljus och i mörker. En nackdel är att huvudställningen kan påverka för-söksdeltagarnas möjligheter att röra på huvudet.
1 Introduction
Visibility is severely restricted under night driving conditions. More than 90% of the information required for driving is obtained through the visual system (Fastenmeier, 1994). The latter can be severely degraded at night. Nevertheless most car drivers are not aware of their visual impairment at night (Owens & Tyrrell, 1999). Thus risky situations may arise, for example when pedestrians or cyclists crossing the road are not detected in sufficient time.
Visual processes can be divided into central and peripheral vision. Central vision is mainly used for target detection and identification, whereas the peripheral vision is associated with lane keeping and lateral control (Mourant & Rockwell, 1972; Summala, Nieminen et al., 1996). Some main functions of target detection, like the perception of contrast, distance and depth, are severely restricted at night, whereas peripheral vision is less affected (Leibowitz & Owens, 1977). Amongst other things, gaze behaviour
depends on velocity (Weise & Durth, 1997), traffic volume, road geometry and surface as well as time of day (Diem 2004; Gut, 2011).
In urban areas, street lighting is often present, which partly compensates for the absent daylight. But even on roads with street lighting, visual conditions can be poor, either because of insufficient street lighting (Lundkvist & Nygårdhs, 2007) or because of other light sources that cause glare or make the environment visually cluttered (Murray, Plainis et al., 1998; Sayer & Mefford, 2004). Furthermore, the use of retroreflective tags and/or lighting among vulnerable road users is rather low (Thulin & Kronberg, 1998; Lindahl & Stenbäck, 1999).
Cyclists tend to have a higher risk of having an accident during the dark hours than in daylight (Johansson, Wanvik et al., 2009). A risky situation for cyclists is when they are crossing a road where motor vehicles are coming from behind and turn right just before they cross the cycle path (Räsänen & Summala, 1998; Gavrila, Marchal et al., 2003). In these situations, the driver of the motor vehicle should give the cyclist an opportunity to pass, according to Swedish traffic rules. In other words, the rules do not prescribe that the driver of the motor vehicle should give way to the cyclist, which is a more clear formulation. But, on the other hand, if the driver hits a cyclist in this situation, he will most likely be found to be guilty. A plausible reason why these accidents occur is that the driver does not notice the cyclist and/or the cycle crossing until it is too late. The present study is the fourth and last part of a project called Road-user support in night-time traffic. The overall aim of the project was to investigate road-users’ needs and problems in night-time traffic and to propose and evaluate road design and/or equipment for better visibility. In the first part, a literature review was carried out, which focused on road-users’ needs, experiences and problems in night-time traffic in urban areas (Fors & Lundkvist, 2009). The second part was a focus group study with cyclists, older drivers and older pedestrians (Fors & Nygårdhs, 2010). The first two studies indicated that most problems in urban areas at night were related to vulnerable road-users and their visibility, security and accessibility. Based on that together with the fact that the Swedish government at that time had proposed new rules for cycle
crossings, it was decided that the third part of the project would focus on visibility of cyclists and at cycle crossings. The rule proposal suggested that drivers of motor vehicles should give way to cyclists at cycle crossings, and in that case, visibility is essential. The third part of the project was a field test where the visibility of cyclists were compared to the visibility of cycle crossings (Nygårdhs, Fors et al., 2010). The results showed that cyclists were detected at a longer distance than the cycle crossing
markings, and that the visibility of the cycle crossing markings was poor. In the fourth and last part of the project, the original plan was to study alternative designs of cycle crossings in order to improve visibility. However, at that time, the rule proposal regarding cycle crossings had been withdrawn and the discussion about revising the rules for cyclists was postponed. Because of that, it was concluded that it would be inopportune to investigate alternative designs of cycle crossings for the moment. Instead, the project took a slight change in direction and it came to focus on something that is of great relevance in the context of road design, namely driver gaze behaviour. This is of interest for two reasons. First, investigating gaze behaviour can give ideas on how to design safe and visible cycle crossings. Second, the method of measuring gaze behaviour may be very useful in future studies on road equipment and visibility. In the previous field test, the participants sat as passengers in a car and pushed a button when they saw a cyclist dummy or a cycle crossing. This is a fairly simple and cost-effective method which can be used for relative comparisons of the visibility of objects.
However, it is not a very realistic situation, since in real life, drivers are not told to look for certain objects and they are also engaged in the driving task. Measuring natural gaze behaviour can be an alternative method or a complement in visibility studies. The present study is partially a methodological study where the method of measuring natural gaze behaviour using an eye tracking system was evaluated.
1.1 Aim
The aims of the study were:
Explore drivers’ gaze and driving behaviour at cycle crossings located after right turns, in daylight conditions and at night, with and without an approaching cyclist
Evaluate the use of a head-mounted eye tracking system for field studies on gaze behaviour and visibility.
Since one aim of the study was to test and evaluate the method, no inferential analyses were conducted. All results are only presented as descriptive statistics.
1.2 Related
publications
In addition to the present report, the project has resulted in three reports and one peer-reviewed paper:
Fors, C. and Lundkvist, S-O. (2009). Night-time traffic in urban areas – a literature review on road user aspects. VTI rapport 650A. Linköping, Sweden Fors, C. and Nygårdhs, S. (2010). Trafikanters upplevda behov och problem i mörkertrafik i tätort – En fokusgruppsstudie med cyklister, äldre bilförare och äldre fotgängare. VTI notat 5-2010. Linköping, Sweden
Nygårdhs, S., Fors, C., Eriksson, L. and Nilsson, L. (2010). Field test on visibility at cycle crossings. VTI rapport 691A. Linköping, Sweden
Nygårdhs, S. and Fors, C. (2010). Field test on visibility at cycle crossings at night. Eur. Transp. Res. Rev. 2(3). 139–145.
Parts of the present study were presented at the annual meeting of the Human Factors and Ergonomics Society Europe Chapter in Leeds, UK, in October 2011.
2 Method
2.1 Participants
Twenty-one participants (ten females) were recruited through the institute’s database of voluntary participants, through advertisement at a nearby university and through
personal contacts. The participants were in the age of 25–46 years, had had a valid driving license for at least six years, drove at least once a week and could drive without wearing glasses. Only non-professional drivers were included in the study. The
participants received a compensation of SEK 800.
2.2 Instrumented
vehicle
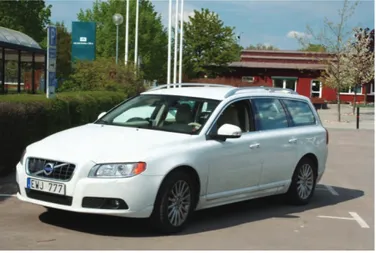
The instrumented vehicle was a Volvo V70 of model year 2009, Figure 1. The car had a manual gear box. Speed and pedal positions were obtained from the CAN network and recorded by a VBOX data logger (Racelogic, UK). The VBOX itself provided GPS position and GPS based speed.
Figure 1 Instrumented vehicle.
2.3
Eye tracking system
A head-mounted eye tracking system with the model name SMI iView X (SensoMoto-ric Instruments, Germany) was used in order to study the gaze behaviour, Figure 2. Front scenes as well as eye movements are recorded by small video cameras mounted on the headset. The principle of this type of eye tracking system is that the eye is illuminated by infrared radiation, which is reflected back to an infrared sensitive video camera. Since the pupil absorbs most infrared radiation, there will be a high contrast between the pupil and the iris. The centre of the pupil is identified by an image processing algorithm and gaze direction is then calculated from the pupil position. In order not to block the person’s field of view, the eye camera sees the eye through a transparent mirror that is positioned in front of the eye.
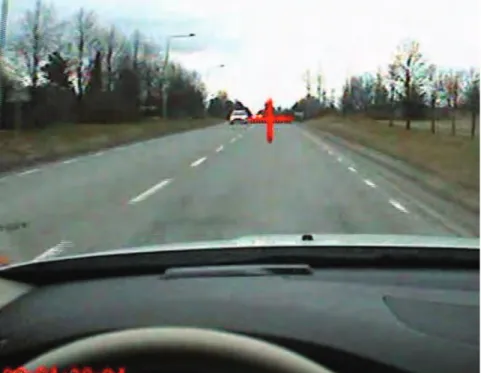
Gaze direction is indicated in the front scene video by a red cursor, Figure 3. Gaze data is also stored in a text file, which can be used for later off-line analysis. The sampling rate is 25 Hz for the video and 50 Hz for the text file. The eye tracker computer was placed in the back seat, where the test leader sat, Figure 4.
An eye tracking experiment starts by mounting the headset in a way so that the eye camera sees the eye, without any part of the system blocking the participant’s field of
view. The test leader can help the system identifying the pupil by changing contrast thresholds and defining an area of interest in the eye image. The system must then be calibrated, which is done by asking the participant to hold her head still and to look at certain spots in the field of view. The setting-up and calibration procedure is usually accomplished within a few minutes.
Figure 2 Head-mounted eye tracking system.
Figure 3 Snapshot of the SMI front scene. The red cursor indicates the driver’s gaze direction.
Figure 4 Eye tracking equipment.
2.4
Test route and cycle crossings
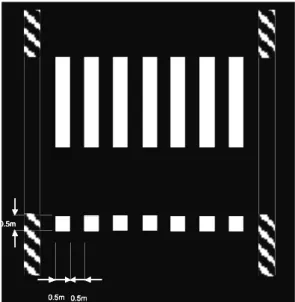
The test route was located in the southern parts of Linköping. The route was about 19 km long and it took about 40 min to drive. There were five cycle crossings along the route. The first four crossings were not marked as cycle crossings – they were just cycle paths crossing the road – while the last one was a correctly marked cycle crossing, Figure 5. Swedish regulations for road markings and road equipment can be found in Vägar och gators utformning (The Swedish Road Administration, 2004).
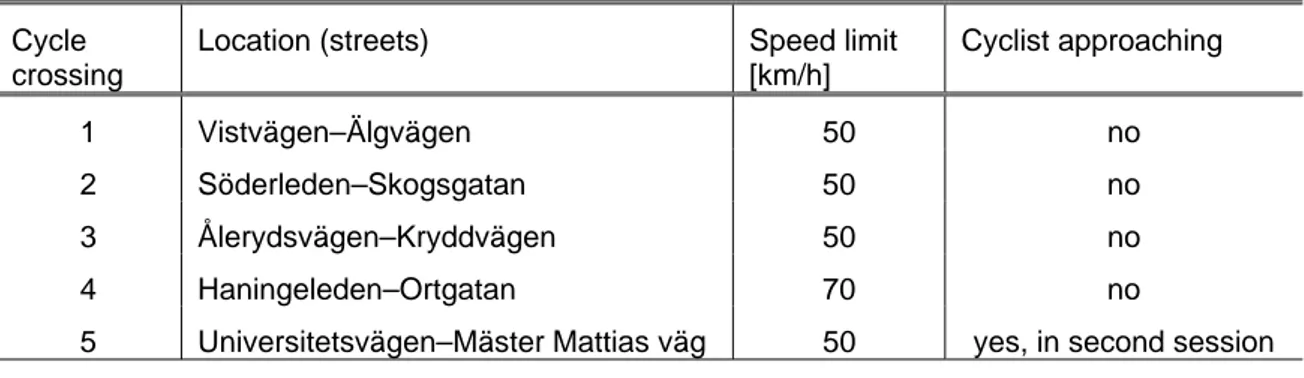
All five cycle crossings were located immediately after a right turn, Figure 6. All of them were non-controlled crossings and the posted speed limit was either 50 km/h (four crossings) or 70 km/h (one crossing). Except these requirements, no particular criteria were used when selecting the cycle crossings. Table 1 lists the location and speed limit of the five cycle crossings. Pictures and descriptions of the five cycle crossings can be found in Appendix A. 0.5m 0.5m 0.5m 0.5m 0.5m 0.5m 0.5m 0.5m 0.5m
Figure 5 Cycle crossing (marked by white squares) combined with a pedestrian crossing.
2.5 Experimental
design
A within group design was used, where each participant completed two driving sessions on the same test route: one in daylight and one at night. The order of the sessions was counterbalanced, i.e. half of the participants conducted the daylight session first. In the second driving session a cyclist was approaching the last cycle crossing from the same direction as the participant (as in Figure 6), Table 1. This means that half of the partici-pants experienced the cyclist in the daylight condition and the other half in the night-time condition. The cyclist experiment was thus a between group study within the main experiment.
The order of the five cycle crossings was the same for all participants and sessions, for practical reasons.
Table 1 The location and speed limit of the five cycle crossings.
Cycle crossing
Location (streets) Speed limit
[km/h] Cyclist approaching 1 Vistvägen–Älgvägen 50 no 2 Söderleden–Skogsgatan 50 no 3 Ålerydsvägen–Kryddvägen 50 no 4 Haningeleden–Ortgatan 70 no
5 Universitetsvägen–Mäster Mattias väg 50 yes, in second session
2.6 Procedure
The participants came to VTI at two occasions: one during daytime and one during night-time, either on the same day or with a few days between. All daytime sessions were held in the late morning or in the early afternoon in order to avoid rush-hour traffic. The night-time sessions were held between 20:30 and 00:00.
The experiment was conducted in the spring (April–May), in dry weather. Figure 6 Cycle crossing after right turn.
At the first occasion, the participants were given written and oral information about the experiment. They were told to drive along a pre-determined route with help of a GPS navigator and that the aim of the study was to compare driving behaviour in daylight and darkness. The participants were not informed about the experimental purpose of the study, i.e. investigation of gaze and driving behaviour at cycle crossings. The GPS was used in order to draw focus from the real purpose and also to give the participant driving directions, since the test leader in the back seat occasionally was occupied monitoring the eye tracking system.
When the participant had taken seat in the car, the eye tracking unit was mounted and calibrated. The driving session started with a training route of about 10 min, where the participant could get used to the car, the GPS and the eye tracking unit. In the end of the training route, there was a short stop where the test leader started the logging equip-ment, and then the real test began. The test leader did not talk to the participant during the driving session, unless the GPS instructions were unclear or the driver took the wrong way.
After the first driving session, the participants were asked to fill out a questionnaire with background questions and general questions about the driving session (Questionnaire 1, see Section 2.7).
The procedure was repeated at the second occasion, except that at the last cycle
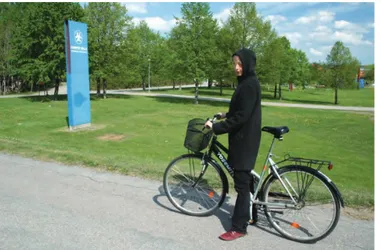
crossing, there was a cyclist approaching the crossing. The test leader phoned the cyclist (without saying anything) when the car was about 400 m from the crossing so that the cyclist could get prepared. The cyclist was positioned about 60 m from the crossing and started to cycle towards the crossing when the car was about 200 m from the crossing, position 1 in Figure 7. The distances were selected so that the car and the cyclist would reach the crossing at about the same time, position 2 in Figure 7. Since the participants drove with different speeds, the cyclist strived to adapt her speed to the car. The cyclist turned right just before the crossing so that there would be no risk of a collision. The driving session ended less than a minute after the cyclist event.
The cyclist was dressed in dark clothes, Figure 8. In night-time sessions, the bicycle lighting was turned on (white light in the front, red light in the back).
The participants were asked to fill out another questionnaire (Questionnaire 2, see Section 2.7) after the second driving session. This questionnaire also included questions about cycle and pedestrian crossings.
Figure 7 The cyclist scenario. The car (red) and the cyclist (green) were supposed to reach the crossing at the same time.
Figure 8 Cyclist dressed in dark clothes. At night-time, the bicycle lighting was turned on (white light in the front, red light in the back.
2.7 Questionnaires
2.7.1 Questionnaire 1
Questionnaire 1 was filled out after the first driving session. A summary of the most relevant questions is given below. The complete questionnaire can be found in Appendix B (in Swedish).
Background questions Age and gender
Years with a driving license
Mileage (last year, urban/rural/motorway, daylight/darkness, total) Experience of using a GPS
Questions about the driving session Familiarity of the test route
Experience of following the GPS instructions (comprehension, stress) Experience of the eye tracking system (annoying, affecting visual field). 2.7.2 Questionnaire 2
Questionnaire 2 was filled out after the second driving session. A summary of the most relevant questions are given below. The complete questionnaire can be found in
Appendix B (in Swedish).
Questions about the driving session
Experience of following the GPS instructions (comprehension, stress) Experience of the eye tracking system (annoying, affecting visual field) Road equipment and road users present at cycle crossing 5.
Questions about vulnerable road users
Traffic rules at pedestrian and cycle crossings
Visibility of uncontrolled pedestrian and cycle crossings
Treatments for better visibility at pedestrian and cycle crossings.
2.8 Photometric
measurements
Night-time illuminance of the cycle path was measured just before each cycle crossing. Illuminance is defined as the luminous flux incident on a surface and measured in lux (lx). Two levels of illuminance were of interest; Ehigh, which is the average of three spot
measurements on the brightest part of the cycle path, i.e. as close as possible to a lamp-post, and Elow, which is the average of three spot measurements in between to
lamp-posts, Figure 9. The positions of the lamp-posts were different at different crossings.
2.9 Analysis
The collected data from the eye tracking system, the CAN logger, the light measure-ments and the questionnaires were mainly analysed descriptively.
Two zones were defined where gaze and driving parameters were analysed. Zone 1 started about 125 m before the crossing and was about 115−120 m long, Figure 9. Zone 2 started where zone 1 ended, i.e. 5−10 m before the crossing and ended just after the turn. The reason why the distances are given as approximate values is that a well-defined object (e.g. a lamp-post or a sign) that was easy to identify in the video films was selected for each crossing as a starting point for the analysis. The location of these objects in relation to the crossing differed somewhat between the crossings.
Figure 9 Measurements of illuminance Ehigh and Elow on the cycle path. Yellow dots =
lamp-posts, blue dots = measurement positions. Zone 1 and zone 2 define the two areas where gaze behaviour was analysed.
2.9.1 Gaze behaviour
The gaze behaviour in each zone and cycle crossing was examined with regard to: Head movement and gaze towards the cycle path (yes or no)
Only gaze towards the cycle path (yes or no).
Additionally, the following gaze parameters were analysed for cycle crossing 5 when a cyclist was present:
Dwell time [ms] (sum of durations of all fixations and saccades that hit the area of interest (cyclist))
First fixation duration [ms] (duration of the first fixation that hit the area of interest (cyclist))
Maximum duration length [ms] (duration of longest gaze that hits the area of interest (cyclist))
Glance count (number of glances to the area of interest (cyclist)). A fixation is the maintenance of the gaze towards an area of interest. They can last between 80 ms and several seconds. The movement from one fixation to another is called saccade. These are very quick movements of the eye, where no information gathering is possible (Schweigert, 2002).
2.9.2 Driving behaviour
Speed profiles in zone 1 were calculated for each crossing, and speed during daytime was compared to speed at night-time. In addition, for crossing 5, speed with cyclist was compared to speed without cyclist.
Also the distance at which the driver started to brake when approaching the crossing was calculated and compared in a similar way as speed.
2.9.3 Missing data
Data from one participant at cycle crossing number one during the daylight session was excluded because of a road work in the crossing. Eye tracking data from the night-time session was completely missing for one participant because of technical failure.
3 Results
3.1 Method
evaluation
The participants’ experiences of the eye tracking system were investigated by two questions in the questionnaire: “Do you think that the eye tracking equipment had an influence on your way of driving?” and “Do you think that the eye tracking equipment had an influence on your way of looking and taking in information?” The questions were asked after both driving sessions. Fourteen of the 21 participants answered yes to at least one of the questions on at least one of the occasions. From the free text
comments following the questions, it appears as there is an overlap in the interpretation of the two questions. Some participants answered yes to the first question, and then erased their answer and instead answered yes to the second question. Others have answered yes to both questions and given the same free text comment for both
questions. Therefore, the answers from the two questions are analysed together. Eight participants wrote in the free text comments that the head unit made it difficult to turn their head, particularly to the left. Some added that they turned their head less than they usually do, or that they were afraid turning their head because they thought the
equipment would move if they did (they were instructed not to touch the equipment while driving). Two participants thought that the head unit prevented them from holding their head as they usually do, either because the equipment blocked the view or because the head restraint could not be used. Four participants thought that the equipment obscured the view in some way. Two participants mentioned that occasionally, there were disturbing reflections in the mirror. Four participants wrote that the head unit caused headache.
In order for the eye tracking system to work properly, there must be a clear contrast between the iris and the pupil (in the video image of the eye), and there must be a reflection from the system’s infrared radiation in the eye. The opportunities to obtain a good tracking – or a tracking at all – depend on the characteristics of the participant (shape of the head, eye colour etc.) as well as the environmental conditions. For example, participants wearing glasses often lead to tracking problems and therefore, only drivers that could drive without glasses were recruited. The present study was conducted in varying light conditions: daylight, darkness, street lighting, and sometimes sunlight. The eye tracking worked well for most participants. In most cases, the system could be set and calibrated in a few minutes, but in a few cases it took a rather long time (up to 40 min) to adjust the head unit and the software settings. Bright sunlight directed towards the participant’s face caused most of the tracking problems. Often the tracking was completely lost when the participant’s face was hit by sunlight, either because the participant’s eyes were partly closed or because the contrast between the iris and the pupil decreased. At the cycle crossings, usually a good tracking was obtained, since the crossings (by a mere chance) were oriented in a way that the sunlight did not hit the participants.
Technically, the eye tracking system worked well, except in one session where no eye tracking data could be saved due to a communication problem between the computer and the head unit.
The participants got driving directions from a GPS navigator. This worked pretty well, except on a few locations where the directions were unclear. In these cases, the
participants got directions from the test leader. On a few occasions, some participants took the wrong way. This happened twice at a cycle crossing. The test leader then instructed the participant to turn around so that the cycle crossing was passed according
to the predetermined driving directions. In other cases, the shortest/simplest way back to the test route was chosen. In the questionnaires, there were two questions about the GPS: “What was it like driving with the GPS?” and “Did you feel stressed by the GPS?” The participants found it relatively easy to follow the GPS instructions. After the first session the average rating was 5.6 on a 7-grade scale where 1 corresponded to “very difficult” and 7 corresponded to “very easy”. After the second driving session, the rating was slightly higher, 6.3, which might be explained by the free text comments, where some participants stated that it was simpler the second time, either because they better understood the GPS navigator or because they remembered the route from the first driving session. The level of stress was low. The average ratings were 6.3 and 6.5, after the first and second session respectively, on a 7-grade scale where 1 corresponded to “very stressed” and 7 corresponded to “not stressed at all”.
Since the night sessions were conducted late at night, there was a risk that sleepiness would have an influence on the results. Therefore, in the questionnaires, the participants were asked to rate their sleepiness level during the driving session. The scale that was used was the Karolinska Sleepiness Scale (Åkerstedt & Gillberg, 1990), which is a 9-grade scale where 1 corresponds to “extremely alert”, 5 corresponds to “neither alert nor sleepy” and 9 corresponds to “very sleepy, much effort to stay awake, fighting sleep”. In the daytime sessions, the sleepiness level was 3.9 on average and at night it was 5.1. One participant rated her sleepiness to 8 during the night session. All other ratings were in the interval 2–6.
The cyclist event at the last cycle crossing in the second driving session worked well in most cases. On one occasion, the cyclist misunderstood the instructions and was
therefore not ready when the car was approaching. That particular event was excluded from the analysis. In all other cases, the cyclist event was accomplished as planned. However, since the participants drove with different speed, the cyclist’s position varied when the participant reached the crossing. In a few cases, the cyclist mistook another car for the experimental car, and therefore started to cycle a little bit too early or too late. In all cases (except for the one where the cyclist was missing), the cyclist was close enough to the crossing in order for an attentive and rule-obeying driver to observe her and to consider her presence while turning to the right.
3.2 Gaze
behaviour
3.2.1 Cycle crossings without cyclist
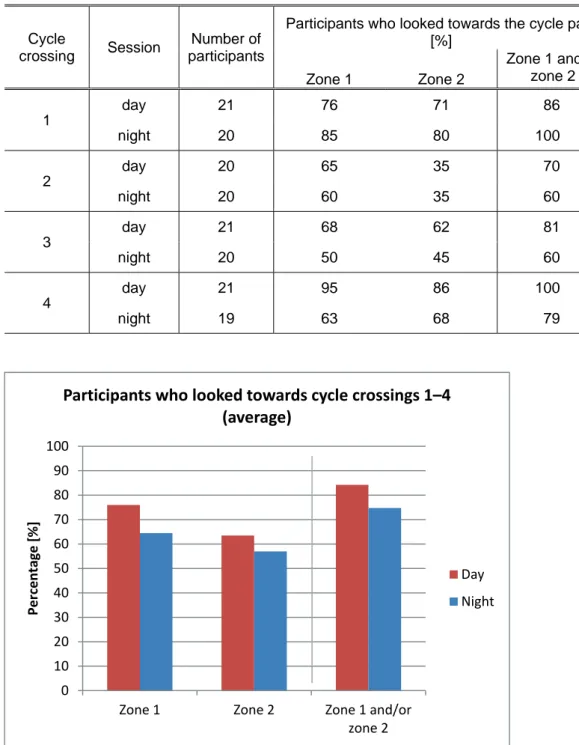
Gaze behaviour was investigated stepwise. First of all cycle crossing 1–4, where no cyclist was present, was analysed. Table 2 shows for zone 1 and 2 the percentage of participants who looked towards the cycle path during daytime and at night.
In case of no cyclist present, participants tended to look at the cycle path less in zone 2 than in zone 1 (exception cycle crossing 4). More participants looked towards the cycle path in daylight than at night, except for cycle crossing 1. Figure 10 shows the average percentage of participants who looked towards the cycle path in daylight and at night, in the two zones and in total (i.e. either in zone 1 or zone 2, or in both zones). At night, about 25% of the participants did not look towards the cycle paths at all. In daylight, the proportion was lower – about 15% of the participants did not look towards the cycle paths, neither in zone 1 nor in zone 2.
Table 2 Percentage of participants who looked towards the cycle path.
Cycle
crossing Session
Number of participants
Participants who looked towards the cycle path [%] Zone 1 Zone 2 Zone 1 and/or zone 2 1 day 21 76 71 86 night 20 85 80 100 2 day 20 65 35 70 night 20 60 35 60 3 day 21 68 62 81 night 20 50 45 60 4 day 21 95 86 100 night 19 63 68 79
Figure 10 Percentage of participants who looked towards the cycle path in daylight and at night, in zone 1 and zone 2. Average for cycle crossings 1–4.
Gaze behaviour was analysed with regard to whether the participants moved their head or not while looking towards the cycle path. Figure 11–Figure 14 show head move-ments (HM) and gaze in the two zones for each cycle crossing. Also Ehigh, Elow and
pictures of the cycle crossings are shown in the figures.
The participants tended to look at cycle paths mainly without moving their head in zone 1. In zone 2 it is vice versa; only a few looked at the cycle path without moving their head. 0 10 20 30 40 50 60 70 80 90 100
Zone 1 Zone 2 Zone 1 and/or
zone 2 Percentage [%] Participants who looked towards cycle crossings 1–4 (average) Day Night
Cycle crossing 1
Posted speed limit: 50 km/h Ehigh = 23.0 lx
Elow = 4.1 lx
Figure 11 Results for cycle crossing 1. The bar chart shows the percentage of participants who looked towards the cycle path with and without head movements (HM), during day and night, respectively.
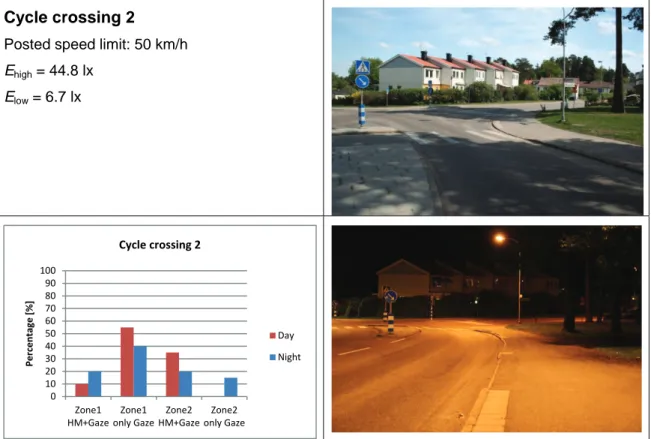
Cycle crossing 2
Posted speed limit: 50 km/h Ehigh = 44.8 lx
Elow = 6.7 lx
Figure 12 Results for cycle crossing 2. The bar chart shows the percentage of participants who looked towards the cycle path with and without head movements (HM), during day and night, respectively.
0 10 20 30 40 50 60 70 80 90 100 Zone1 HM+Gaze Zone1 only Gaze Zone2 HM+Gaze Zone2 only Gaze Per cent age [%] Cycle crossing 1 Day Night 0 10 20 30 40 50 60 70 80 90 100 Zone1 HM+Gaze Zone1 only Gaze Zone2 HM+Gaze Zone2 only Gaze Per cent age [%] Cycle crossing 2 Day Night
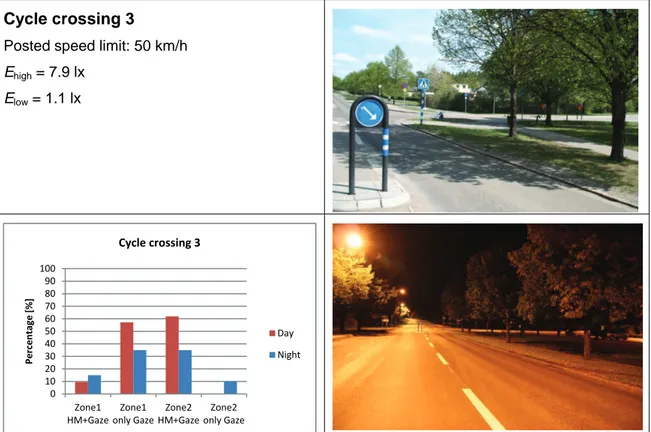
Cycle crossing 3
Posted speed limit: 50 km/h Ehigh = 7.9 lx
Elow = 1.1 lx
Figure 13 Results for cycle crossing 3. The bar chart shows the percentage of participants who looked towards the cycle path with and without head movements (HM), during day and night, respectively.
Cycle crossing 4
Posted speed limit: 70 km/h Ehigh = 2.5 lx
Elow = 1.4 lx
Figure 14 Results for cycle crossing 4. The bar chart shows the percentage of participants who looked towards the cycle path with and without head movements (HM), during day and night, respectively.
0 10 20 30 40 50 60 70 80 90 100 Zone1 HM+Gaze Zone1 only Gaze Zone2 HM+Gaze Zone2 only Gaze Per cent age [%] Cycle crossing 3 Day Night 0 10 20 30 40 50 60 70 80 90 100 Zone1 HM+Gaze Zone1 only Gaze Zone2 HM+Gaze Zone2 only Gaze Per cent age [%] Cycle crossing 4 Day Night
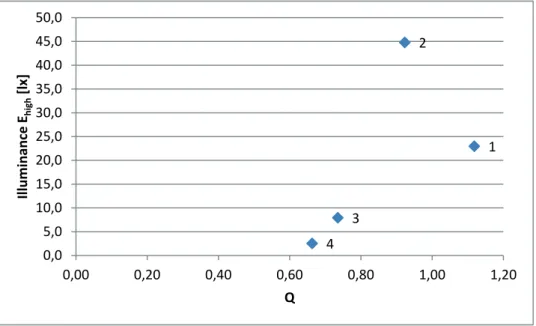
The illuminance at the cycle path varied a lot between the four cycle crossings. Crossings 1 and 2 had relatively high illuminances compared to crossings 3 and 4, which can be explained by the fact that the lamp-posts at crossings 1 and 2 were situated along the cycle path. At crossing 3 and 4, the cycle paths were illuminated by stray light from lamp-posts situated along the road. In Figure 15, the illuminance Ehigh is
plotted against Q, where Q is defined as:
% 1
% 1
Figure 15 Illuminance and ratio of the participants who looked towards the cycle path at night and in daylight in zone 1, at the four cycle crossings (1–4).
The reason for presenting Q, instead of just presenting the percentage of participants who looked towards the cycle path at night, is that the influence of the infrastructure (road width and curvature, etc.) will be reduced. Except for cycle crossing 1 (the rightmost marker in Figure 15, Q increases with the illuminance. In other words, more participants tended to look towards a cycle path with higher illuminances.
3.2.2 Cycle crossing with cyclist
Nine participants had a cyclist next to crossing 5 in the daylight condition and eleven in the night-time condition. Table 3 shows the percentage of the participants who looked towards the cycle path and/or the cyclist. Eight out of nine participants detected the cyclist in zone 1 during daytime. At night only seven out of eleven test persons gazed at the cyclist in zone 1. All participants looked towards the cycle path either in zone 1 or in zone 2 or in both zones, in daylight as well as at night, regardless of whether the cyclist was present or not.
1 2 3 4 0,0 5,0 10,0 15,0 20,0 25,0 30,0 35,0 40,0 45,0 50,0 0,00 0,20 0,40 0,60 0,80 1,00 1,20 Illuminance Ehi gh [lx] Q
Table 3 Percentage of participants who looked towards the cycle path at crossing 5.
Session Cyclist Number of
participants
Participants who looked towards the cycle path [%] Zone1 Zone2 Zone 1 and/or zone 2 day without 12 83 100 100 with 9 89 100 100 night without 9 88 88 100 with 11 64 100 100
Figure 16 depicts the percentage of all participants who looked at the cycle path and/or cyclist nearby crossing 5. In zone 2, all participants turned their heads and looked at the cyclist, in daylight as well as at night.
Cycle crossing 5
Posted speed limit: 50 km/h Ehigh = 14.1 lx
Elow = 13.3 lx
Figure 16 Results for cycle crossing 5. The bar chart shows the percentage of
participants who looked towards the cycle path and the cyclist, respectively, with and without head movements (HM), during day and night.
Dwell time, maximum duration length, first fixation duration and glance count were only analysed for zone 1 when a cyclist was present, see Figure 17. Dwell times and maximum duration lengths are longer and the average number of glances is lower at
0 10 20 30 40 50 60 70 80 90 100 Zone1 HM+gaze Zone1 only Gaze Zone2 HM+gaze Zone2 only Gaze Pe rce n tag e [%] Cycle crossing 5 Day without bike Day with bike Night without bike Night with bike
night compared to daytime. The first fixation durations do not differ much between day and night. Furthermore the standard deviation of dwell time (day: 743 ms; night: 883 ms), first fixation duration (day: 147 ms; night: 268 ms), maximum duration length (day: 222 ms; night: 306 ms), and glance count (day: 1.0; night: 1.4) is larger at night.
Figure 17 Dwell time, first fixation duration, maximum duration length and glance count of the cyclist in zone 1 for crossing 5 (minimum, quartile 25, median, quartile 75 and maximum) 0 500 1000 1500 2000 2500 3000 Day Night Dwell Time [ms] Cycle crossing 5, zone 1 0 100 200 300 400 500 600 700 800 Day Night First Fixation Duration [ms] Cycle crossing 5, zone 1 0 200 400 600 800 1000 Day Night Maxiumum Duration Len gt h [ms] Cycle crossing 5, zone 1 0 1 2 3 4 5 Day Night Glance Count Cycle crossing 5, zone 1
3.3 Driving
behaviour
The speed profiles and braking distances for crossing 1−4 are shown in Figure 18. For crossing 3 and 4, the speed was somewhat higher during daytime than at night. For crossing 1, 2 and 4, the drivers braked somewhat later during daytime than at night.
Figure 19 shows speed profiles for crossing 5, for day and night, and with and without cyclist. All four speed profiles have a similar pattern, but close to the crossing, the speed tends to decrease more when a cyclist is present than when no cyclist is present. The drivers also braked earlier when a cyclist was present, especially during daytime.
Figure 18 Average speed profiles in zone 1 during daytime (red) and at night (blue) for crossing 1−4. The shaded areas correspond to the standard deviation. The vertical lines mark the average distance where the drivers start to brake. Note that the posted speed limit is 50 km/h at crossing 1–3 and 70 km/h at crossing 4, and that the x-scale is different for crossing 4.
Figure 19 Average speed profiles for crossing 5, for day (red) and night (blue), with (dashed line) and without (continuous line) cyclist.
3.4 Questionnaires
The participants were on average 32.9 years old (range 25–46) and had had a driving license for 13.9 years (range 6–27). Their mileage was 9,000 km per year (range 1,500– 20,000) and the proportion of night-time driving of their total mileage was 28% (range 5–60). Fifteen out of the 21 participants went cycling at least once a month. Nineteen had used a GPS navigator before the test occasion. The majority of participants were not familiar with the area where the test route was located.
3.4.1 Traffic rules
After the second driving session, the participants’ knowledge of traffic rules related to vulnerable road users was tested based on three specific traffic situations (see
Appendix B for pictures explaining the three situations), Table 4. Traffic rules for pedestrians and cyclists can be found in pamphlets from the Swedish Transport Agency (The Swedish Transport Agency, 2011b; The Swedish Transport Agency, 2011a).
120 100 80 60 40 20 0 0 10 20 30 40 50 60 70
Distance from crossing (m)
S peed ( km /h) Cycle crossing 5 Day, cyclist Day, no cyclist Night, cyclist Night, no cyclist
Table 4 The participants’ answers to traffic rule questions (pictures explaining the three situations in Appendix B).
Question Answers Correct %
What applies when a car driver is approaching an uncontrolled pedestrian crossing where a pedestrian is about to cross the road?
The car driver has to give way to the pedestrian* 21
100
The pedestrian has to give way to the car driver 0
What applies when a car driver is approaching an uncontrolled cycle crossing where a cyclist is about to cross the road?
The car driver has to give way to the cyclist 12
43
The cyclist has to give way to the car driver* 9
What applies when there is a cycle crossing immediately following a right turn, where a car driver is turning and a cyclist is about to cross the road?
Turning car drivers should drive with a low speed and give cyclists an opportunity to pass*
21
100
Cyclists have to give way to the car driver 0
*) Correct answer
Notable is that more than half of the participants did not know that cyclists have to give way to car drivers at uncontrolled cycle crossings (on straight roads).
3.4.2 Visibility of uncontrolled pedestrian and cycle crossings
Figure 20 shows the participants’ experiences of visibility of pedestrian and cycle crossings in general. Night-time visibility is rated lower than daytime visibility. Visibility of cycle crossings is rated lower than visibility of pedestrian crossings. Figure 21 shows the participants’ views on whether visibility at pedestrian and cycle crossings needs to be improved. The participants thought, to some extent, that visibility needs to be improved, particularly at cycle crossings (after right turns). There is,
Figure 20 The participants’ experiences of visibility of pedestrian and cycle crossings in general (mean ± std).
Figure 21 The participants’ views on whether visibility at pedestrian and cycle crossings needs to be improved (mean ± std).
3.4.3 Treatments for better visibility at pedestrian and cycle crossings
The participants were asked about their views on different treatments for better visibility at night. Figure 22 and Figure 23 show the results for pedestrian crossings on straight roads and cycle crossings after right turns, respectively. Treatments with the highest ratings were – both for pedestrian and cycle crossings – intense street lighting, reflecting material on sign posts and road signs with lights that flash when a
pedestrian/cyclist is about to pass. Also raised pavement markers got high ratings. In addition, for cycle crossings, the road sign “cycle crossing” got a high rating (road sign was not an alternative for pedestrian crossings, since they are always present today). Some participants added comments to their answers. Two pointed out that symbols painted on the road surface and raised pavement markers will not be visible with snow on the road. General comments were “It is extremely important to remind drivers that there is a cycle crossing after the [right] turn”, “[Treatments] must not draw to much
focus from the driving” and “I think that I am very attentive when turning and therefore, I do not think treatments are needed”.
Figure 22 Participants’ views on treatments for improved visibility at pedestrian crossings on straight roads (mean ± std).
Figure 23 Participants’ views on treatments for improved visibility at cycle crossings after right turns (mean ± std).
4 Discussion
and
conclusions
The aim of the study was twofold: to investigate car drivers’ gaze and driving behaviour at cycle crossings located after right turns and to evaluate the method of using an eye tracking system for studying visibility.
4.1 Method
Previous visibility studies at VTI have been done using photos or field tests where the participants have been passengers in a car and pushed a button when they saw a certain object (Lundkvist & Nygårdhs, 2007; Nygårdhs, Fors et al., 2010). In the present study, a new method was tested, where the participants’ natural gaze behaviour was registered by an eye tracking system while they were driving, without being instructed to look for specific objects. The advantage of the latter method is that it imitates a real driving situation better than the other methods. A drawback is that it is not possible to know for sure if/when a participant has detected a certain object. The fact that a person has her/his gaze directed towards an object does not necessarily mean that the person has seen and identified the object. There is also usually an inaccuracy in the measured gaze direction, which might make it difficult to interpret the data, particularly for objects far away. In the present study, it was found that the cyclist event was very suitable for gaze analysis, since the cyclist was a well-defined and distinct object towards a relatively homo-geneous background. Also in cases where there was an offset in gaze direction (i.e. the measured and the real gaze direction differed because of incorrect or inaccurate
calibration), it was relatively easy to determine if/when the participant looked at the cyclist. However, gaze parameters, like dwell time, first fixation duration, maximum duration length and glance count, were only calculated for zone 1. No such analysis was done for zone 2, because of poor gaze data quality (see below) and due to slight
synchronization differences of the cyclist and the participant.
Analysing gaze behaviour before and at cycle crossings (without a cyclist present) was more complicated, for several reasons. First of all, a cycle crossing is not a very well-defined object, particularly not when markings are missing, which was the case in four out of the five cycle crossings. The analysis method that was chosen was therefore to investigate whether the participants looked towards the cycle path. In the actual crossings, it is interesting to analyse in more detail what the participants looked at, for example if and how they looked at road signs, road markings, other vehicles etc. However, it turned out to be difficult to do such an analysis, since the drivers moved their heads and eyes a lot at the crossings, which resulted in a partly blocked (by e.g. the car roof) video image, lost tracking and motion blur. In the analysis software that comes with the eye tracking system, areas of interest can be defined and then the software can calculate e.g. for how long time the person is looking in that area. Unfortunately, that function could not be used in the crossings, since the area of interest changed
continuously.
An obvious disadvantage of using an eye tracking system in this kind of study, is that a great part of the participants thought that the equipment had an influence on their way of driving and/or taking in visual information. In the cases where the participants thought that the equipment blocked parts of the visual field or where reflections occurred in the mirror, it might have been possible to adjust the equipment in a way so that these problems had been avoided. But many participants also thought that the equipment made it difficult to turn their head, which unfortunately is harder to do something about and this limits the use of the system. It can be concluded that this type
of eye tracking system is best suited for situations where the driver does not have to turn the head (particularly not to the left) and that it might be a good idea to avoid having the equipment mounted on the head in complex traffic environments (e.g. on the way to a test route) for safety reasons. In order to reduce problems with headache, it is recom-mended to keep the experimental time short and to make sure the headset is not too tightened.
Four out of the five cycle crossings in the study were not marked as cycle crossings and thus, one might argue that the results may not apply to real cycle crossings. The reason for using unmarked cycle crossings is that there are very few correctly marked cycle crossings in Linköping. However, in a previous study it was found that the visibility of cycle crossing markings is very poor (Nygårdhs, Fors et al., 2010) and it is reasonable to believe that cycle crossings often are perceived from other visual cues, such as cyclists, cycle paths or pedestrian crossings. In the present study, glances towards the cycle path were analysed.
Using a GPS navigator for giving the participants driving directions worked mostly well, but the test leader had to assist sometimes. If one wants to perform a study where the participants must rely on the GPS only, a longer training route is probably needed. A risk when using a GPS is that it might have an influence on gaze behaviour. In the present study, that was assumed to have very little influence on the results, since a relative comparison between day and night was made.
Sleepiness was not a considerable issue, neither during daytime nor at night. However, one participant rated his/her sleepiness to 8 during the night session, which is unsuitably high, with regard to traffic safety as well as to the analysis and interpretation of the results. A way of reducing problems with sleepiness might be to instruct the participants to sleep properly the night before the experiment and maybe to have a nap in the after-noon.
The cyclist event worked relatively well. When planning the study, several variants of a cyclist event were discussed. In an ideal case, there would have been a cyclist
approaching at more than one cycle crossing, in order to get more data. However, that idea was abandoned for practical reasons. Having several cyclists placed at different locations would require considerable resources in the form of persons, housings where the cyclists could spend the waiting time and fine-tuning of the routines for when and where the cyclist should start cycling. At cycle crossing 5, it was possible to add a cyclist event without too much effort, since that crossing is very close to VTI. The cyclist could wait at VTI until the car with the participant was only a few minutes away. The cyclist then stationed herself at a predetermined position and waited until the car came into sight. In some cases, it was difficult for the cyclist to arrive to the crossing at the same time as the car, since the participants drove with different speeds. Posted speed limit is 50 km/h but many drivers think that the speed limit is higher on that road, which will result in a great variation in speed. From that perspective, it might have been better to choose another crossing for the cyclist event. Sometimes there were several cars approaching the crossing at the same time, which made it difficult for the cyclist to know when to start cycling. This could be avoided by marking out the car in some way. Despite the difficulties mentioned, the cyclist event was still considered successful and it should be possible to use the method in further studies.
4.2 Results
The present study was partly a methodological evaluation and therefore, the amount of data is relatively small. No inferential analyses have been conducted and consequently, no generalizable results are available. However, the figures and diagrams presented in Chapter 3 are still worth discussing.
The participants tended to look more towards the cycle path in daylight than during night-time, when no cyclist was present. A reasonable explanation is that the cycle path is harder to detect in low light conditions but it can also be related to expectancies, i.e. that the drivers are more attentive since they are expecting more cyclists during day-time. An exception is cycle crossing 1, where the participants looked towards the cycle path approximately to the same extent during daytime and at night. Right after this crossing, there is a petrol station with bright advertising signs, on the right hand side of the road. Conspicuous objects tend to catch eyes, so it is possible that the participants actually looked at the petrol station and not at the cycle path.
In crossing 1–4, only about half of the participants turned their head towards the cycle path in the crossing, while in crossing 5 (in the first session, where no cyclist was present), almost all participants did. A difference between crossing 1–4 and 5 is that only crossing 5 is correctly marked as a cycle crossing which might explain the
difference in behaviour. Another possible explanation is that the visibility is very good at this crossing, both during daytime and at night. There are no obscuring trees or shrubberies, or any conspicuous buildings or signs around the crossing. The cycle path also has a relatively high illuminance at night. From this single study, it is impossible to draw any conclusions on whether the cycle crossing markings have an influence on driver behaviour in crossings.
It can be seen that gaze and driving behaviour in general varies between the crossings, which can be expected since the roads and road environments look different at different locations. Similar results were found in the previous field study on visibility at cycle crossings, where there was a great variability in visibility distance (Nygårdhs, Fors et al., 2010). A great number of factors, some of which are not possible to measure or analyse, will have an influence on visibility and gaze behaviour. There is, however, a measurable and also very central factor when it comes to visibility, and that is the illuminance. According to Swedish recommendations, the lighting class of cycle paths should be S2 or S3 (European standard SS-EN 13201-2), which correspond to minimum illuminances of 3 and 1.5 lx, respectively. The lighting along the cycle paths at cycle crossings 3 and 4 does not fulfil the recommendations, which probably can be explained by the fact that these cycle paths are only illuminated by stray light from lamp-posts situated along the road. The use of street lighting along the road but not along the cycle path can be discussed. Cyclists are likely to benefit much more from street lighting than drivers, for several reasons. In addition to the cyclists’ perceived safety, security and comfort which can be expected to increase with increasing illumination (Niska, 2011), appropriate illumination of cycle paths will be advantageous also for drivers since it probably will help them detect the cycle path and to become aware of cycle crossings and cyclists. The results from the present study support this reasoning. A majority of the participants looked towards the cycle path before they arrived at the actual crossing. In the previous field study, where the visibility distance of cyclists was compared to that of cycle crossing markings, the average visibility distance of the markings was found to be less than 20 m (Nygårdhs, Fors et al., 2010). Therefore, it is reasonable that the
partici-pants in the present study saw the cycle path before they saw the cycle crossing, and not the opposite.
From the results of the present field test, it is not possible to draw any conclusions on whether the visibility of cycle crossings needs to be improved. However, from the questionnaire, it was found that a majority of the participants, to some extent, thought that the visibility of cycle crossings (after right turns) needs to be improved. The most popular treatments for better visibility were intense street lighting, followed by reflec-tive material on sign posts, road signs and reflecreflec-tive raised pavement markers.
The present study is done from the driver’s perspective. When discussing alternative treatments for better visibility, also the cyclist’s perspective should be considered. Perhaps visibility is not the major issue for cyclists. Instead, safety and security are often in focus when discussing cycling (Fors & Nygårdhs, 2010; Niska, 2011) and that includes more than just visibility. In future studies on cycle crossings, it is important to evaluate them also from the cyclist’s perspective.
Another issue related to cycle crossings – which was also brought up in the previous focus group discussion (Fors & Nygårdhs, 2010) – is the unclear traffic regulations regarding vulnerable road users, particularly cyclists. An example is the regulation for cycle crossings after right turns, where drivers should not “give way to cyclists” but rather “give the cyclist an opportunity to pass” (The Swedish Transport Agency,
2011a). The unclear regulations are also illustrated by the fact that more than half of the participants did not know that cyclists should give way to drivers at cycle crossings on straight roads.
4.3 Further
research
In the autumn of 2010, the Swedish government initiated a new investigation of traffic rules for cyclists. When that work is finished (at the latest in May 2012), there may be reason to reconsider the visibility at cycle crossings and to continue the work that has been initiated in the present project.
If the new rules for cyclists raise the need for improved visibility at cycle crossings, it would be interesting to evaluate the treatments that got the highest ratings in the present study, i.e. intense street lighting, reflective material on sign posts, road signs and
reflective raised pavement markers. Such an evaluation should include not only visibility but also acceptance and whether a certain treatment leads to fewer accidents. For new kinds of treatments, such as flashing lights or raised pavement markers, it is also important to investigate life cycle cost and durability, in order to see whether it is reasonable to use them.
4.4 Conclusions
Head-mounted eye tracking can be used in field experiments for investigation of gaze behaviour in situations where well-defined objects are of interest (e.g. a pedestrian or a sign)
Head-mounted eye tracking is not very suitable in situations where the drivers are expected to turn their heads a lot
The video camera based eye tracking system worked well in night-time conditions and daylight
The visibility of the cycle path is probably of importance in order for drivers to become aware of the cycle crossing
The participants tended to look towards the cycle path more often in daylight than at night
The participants tended to look towards the cyclist earlier in daylight than at night
The participants thought, to some extent, that the night-time visibility at cycle crossings after right turns needs to be improved
The most preferred treatments for better visibility at cycle crossings were: intense street lighting, reflective material on sign posts, road signs (with and without flashing lights) and reflective raised pavement markers.
References
Diem, C. (2004). Blickverhalten von Kraftfahrern im dynamischen Straßenverkehr. Darmstadt: Herbert Utz Verlag.
Fastenmeier, W. (1994). Verkehrstechnische und verhaltensbezogene Merkmale von Fahrstrecken – Entwicklung und Erprobung einer Typologie von Straßenverkehrssitua-tionen. Dissertation.
Fors, C. & Lundkvist, S.-O. (2009). Night-time traffic in urban areas – a literature review on road user aspects. Linköping, Sweden: Swedish National Road and Transport Research Institute (VTI rapport 650).
Fors, C. & Nygårdhs, S. (2010). Trafikanters upplevda behov och problem i mörker-trafik i tätort – En fokusgruppsstudie med cyklister, äldre bilförare och äldre fot-gängare. Linköping, Sweden: Swedish National Road and Transport Research Institute (VTI notat 5-2010).
Gavrila, D.M., Marchal, P. & Meinecke, M.-M. (2003). Vulnerable road user scenario analysis (SAVE-U Deliverable 1-A).
Gut, C. (2011). Untersuchung des Blickverhaltens von Kraftfahrzeugführern in Kurven bei Nacht. Karlsruhe: Karlsruher Institute of Technology. Student thesis.
Johansson, Ö., Wanvik, P.O. & Elvik, R. (2009). A new method for assessing the risk of accident associated with darkness. Accident Analysis and Prevention 41: 809–815. Leibowitz, H.W. & Owens, D.A. (1977). Nighttime driving accidents and selective visual degradation. Science 197(4302): 422–423.
Lindahl, E. & Stenbäck, I. (1999). Provundersökning av cyklisters synbarhet i tätort oktober–november 1998. Borlänge: The Swedish Road Administration (Vägverket publikation 1999:1).
Lundkvist, S.-O. & Nygårdhs, S. (2007). Upptäckbarhet av fotgängare i mörker vid övergångsställen. Linköping, Sweden: Swedish National Road and Transport Research Institute (VTI notat 5-2007).
Mourant, R.R. & Rockwell, T.H. (1972). Strategies of visual search by novice and experienced drivers. Human Factors 14(4): 325–335.
Murray, I.J., Plainis, S., Chauhan, K. & Charman, W.N. (1998). Road traffic accidents: The impact of lighting. The Lighting Journal(May/June): 42–46.
Niska, A. (2011). Cykelvägars standard – En kunskapssammanställning med fokus på drift och underhåll. Linköping, Sweden: Swedish National Road and Transport Research Institute (VTI rapport 726).
Nygårdhs, S., Fors, C., Eriksson, L. & Nilsson, L. (2010). Field test on visibility at cycle crossings. Linköping, Sweden: Swedish National Road and Transport Research Institute (VTI rapport 691A).
Owens, D.A. & Tyrrell, R.A. (1999). Effects of luminance, blur, and age on nighttime visual guidance: A test of the selective degradation hypothesis. Journal of Experimental Psychology: Applied 5(2): 115–128.
Räsänen, M. & Summala, H. (1998). Attention and expectation problems in bicycle-car collisions: an in-depth study. Accident Analysis and Prevention 30(5): 657–666.
Sayer, J.R. & Mefford, M.L. (2004). The roles of retroreflective arm treatments and arm motion in nighttime pedestrian conspicuity. Ann Arbor, MI, USA: The University of Michigan Transportation Research Institute (UMTRI 2004-21).
Schweigert, M. (2002). Fahrerblickverhalten und Nebenaufgaben. München, Germany: Technischen Universität München. Dissertation.
Summala, H., Nieminen, T. & Punto, M. (1996). Maintaining lane position with peripheral vision during in-vehicle tasks. Human Factors 38(3): 442–451.
The Swedish Road Administration (2004). Vägar och gators utformning. Borlänge, Sweden: The Swedish Road Administration (Vägverket publikation 2004:80). The Swedish Transport Agency (2011a). Cykelöverfarter. Norrköping, Sweden: The Swedish Transport Agency (Broschyr PV 10107).
The Swedish Transport Agency (2011b). Övergångsställen. Norrköping, Sweden: The Swedish Transport Agency (Broschyr PV 09304).
Thulin, H. & Kronberg, H. (1998). Gåenderesor och cykelresor i olika trafikmiljöer. Linköping, Sweden: Swedish National Road and Transport Research Institute (VTI notat 47-1998).
Weise, G. & Durth, W. (1997). Straßenbau – planung und entwurf. Berlin, Germany: Verlag Bauwesen.
Åkerstedt, T. & Gillberg, M. (1990). Subjective and obejctive sleepiness in the active individual. International Journal of Neroscience 52: 29–37.