Page | 1
Efficiency of LTTng as a Kernel and
Userspace Tracer on Multicore
Environment
Master Thesis in Software Engineering
School of Innovation, Design and Engineering
Mälardalen University
Västerås, Sweden
June, 2010
Romik Guha Anjoy Soumya Kanti Chakraborty
romik.03305@gmail.com soumyakanti.chakraborty@gmail.com
Supervisors:
Alf Larsson, Ericsson AB and Daniel Flemström, Mälardalen University
Examiner:
Page | 2
Preface
This document is a Master Thesis in the field of Software Engineering. The work described here has been accomplished at the Industrial Research and Innovation Laboratory (IRIL), School of Innovation, Design and Engineering, Mälardalen University in Västerås and at Ericsson AB in Stockholm in a time span between January 2010 and June 2010.
We are grateful to Mathieu Desnoyers and Pierre-Marc Fournier from the ltt-dev team for providing us with valuable information about LTTng and for fixing the reported bugs quickly. We are also grateful to Francois Chouinard from Ericsson Canada and the eclipse-dev team for helping us.
We are thankful to Sten Ekman for his Innovation Science& Management course which equipped us with skills to deal with the research work efficiently. We are also thankful to Daniel Sundmark for reviewing the initial draft of our thesis document and providing his valuable feedback.
Special thanks go to our supervisor Daniel Flemström who dedicated much time supervising us and pointing us in the right directions. Alf Larsson, our supervisor at Ericsson AB, also deserves special thanks for his invaluable feedback, insight and orientations in the field.
Examiner at Mälardalen University
Daniel Sundmarkdaniel.sundmark@mdh.se
Supervisor at Mälardalen University
Daniel Flemströmdaniel.flemstrom@mdh.se
Supervisor at Ericsson AB
Alf LarssonPage | 3
Abstract
With the advent of huge multicore processors, complex hardware, intermingled networks and huge disk storage capabilities the programs that are used in the system and the code which is written to control them are increasingly getting large and often much complicated. There is increase in need of a framework which tracks issues, debugs the program, helps to analyze the reason behind degradation of system and program performance. Another big concern for deploying such a framework in complex systems is to the footprint of the framework upon the setup. LTTng project aims to provide such an effective tracing and debugging toolset for Linux systems. Our work is to measure the effectiveness of LTTng in a Multicore Environment and evaluate its affect on the system and program performance. We incorporate Control and Data Flow analysis of the system and the binaries of LTTng to reach for a conclusion.
Page | 4
Thesis Summary
The Goal of the thesis is to analyze the performance of LTTng kernel and Userspace tracer in a multicore environment under various load configurations. Control and Data Flow analysis of the system and the application binaries is carried out to evaluate the performance measurements of the tracing tool. With Control Flow analysis, we annotate source code of application binaries, measure the internal CPU cycles usage, perform a call graph analysis to draw a picture about the necessary calls made by the program and the tool during testing. Data Flow analysis helps us to find out the memory performances of the tracing utility and its memory leaks under different load configurations.
The experiments we performed in course of finding the efficiency of LTTng kernel tracer and the userspace tracer are:
Experiment 1 – Determination of load configuration parameters for System Under Test (SUT)
Experiment 2 – Measuring the efficiency of LTTng Kernel Tracer
Experiment 3 – Measuring the efficiency of LTTng Userspace Tracer
Experiment 4 – Measuring the impact on System as well as Traced Application when LTTng Kernel Tracer and Userspace Tracer are executed together
Experiment 5 – Running load program and tbench on LTTng Kernel with Non Overwrite and Flight Recorder tracing modes
Experiment 6 – Running UST tracing on load and tbench program each instrumented with 10 markers under different load configurations
Experiment 7 – Running the Kernel tracer with the help of Valgrind under various load configurations generated by load program (system load) and tbench (process and network load)
Experiment 8 – Running the load and tbench application instrumented with 10 markers under UST (Userspace Tracing) with the help of Valgrind
The findings from these experiments have enabled us to conclude on the following points:
The impact of LTTng kernel tracer on kernel operations against vanilla kernel is 1.6%
There is almost negligible difference between the performances of LTTng kernel tracer in Non Overwrite mode and in Flight Recorder mode
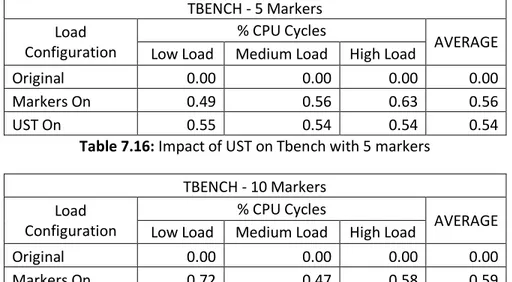
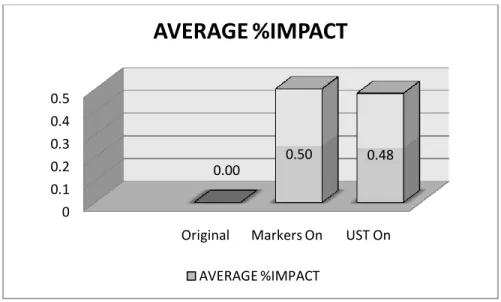
The LTTng userspace tracer and the compiled markers both have an effect of around 0.50% on the performance of the userspace application against the original copy of the applications without markers
The impact of UST on userspace applications marginally increase with the increase in the number of instrumentations compiled in, though the pattern of increase for all load configurations are not similar
Page | 5
LTT Control and Trace Daemon have minimal cache miss and Branch Misprediction rate in order of 10-4 percent
Branch Mispredictions of both LTTng Kernel Tracer and UST decreases significantly with increase in load. Memory handling thus becomes more efficient with load increase
LTT kernel Tracing Daemon is much more memory efficient than UST Daemon
Memory loss though is of insignificant number but is more for UST tracing. UST also has problem of not freeing a chunk of memory after completion of execution
The impact of LTTng kernel tracer and UST together is quite similar to LTTng kernel tracer and there is no additional impact on the percentage of CPU cycles needs to perform kernel operations
Page | 6
Contents
1. INTRODUCTION ... 14 1.1 ORGANIZATION OF THESIS ... 15 2. PROBLEM FORMULATION ... 16 2.1 PROBLEM STATEMENT ... 17 2.2 PROBLEM ANALYSIS ... 17 3. BACKGROUND ... 19 3.1 TRACING ... 20 3.2 EMBEDDED SYSTEMS ... 213.2.1 Classes of Embedded Systems ... 21
3.2.2 Challenges in Embedded Systems Design... 21
3.2.3 Real Time Architecture Constraints ... 22
3.3 MULTICORE SYSTEMS ... 24
3.3.1 Migration from Single Core to Multicore ... 24
3.3.2 Parallelism in Multicore Processing ... 25
3.3.3 Types of Multicore ... 26
3.3.4 Inter-core Communication ... 28
3.3.5 Multicore Design Approaches ... 28
3.3.6 Problems in Multicore Systems... 28
3.4 LTTNG ... 29 3.4.1 Overview ... 29 3.4.2 Features of LTTng ... 29 3.4.3 LTTng Tracer Architecture ... 30 3.4.4 LTTng Design ... 31 3.4.5 LTTng Userspace Tracer ... 34 3.4.5.1 UST Architecture ...34 3.4.5.2 UST Libraries ...35 3.4.5.3 Time Synchronization ...35
3.4.5.4 UST Data Collection ...35
3.4.6 LTT Viewer (LTTV) ... 35
3.4.7 Use of LTTng ... 35
3.4.8 How to use LTTng?... 36
3.5 CONTROL AND DATA FLOW ANALYSIS ... 37
3.5.1 Control Flow Analysis ... 37
3.5.2 Data Flow Analysis... 38
4. RELATED WORK ... 39
4.1 OVERVIEW ... 40
Page | 7
4.3 STATE OF THE ART ... 41
5. EXPERIMENT SETUP... 43
5.1 SYSTEM CONFIGURATION ... 44
5.1.1 Hardware Configuration ... 44
5.1.2 Software Configuration ... 44
5.2 TOOLS AND UTILITIES ... 45
5.2.1 Load Generation Tools ... 45
5.2.1.1 load ...45
5.2.1.2 tbench ...45
5.2.2 System Activity Measurement Tools ... 46
5.2.2.1 Sysstat ...46
5.2.3 Control Flow and Data Flow Analysis Tools ... 47
5.2.3.1 OProfile ...48
5.2.3.2 Valgrind ...49
5.2.3.3 gprof2dot.py...51
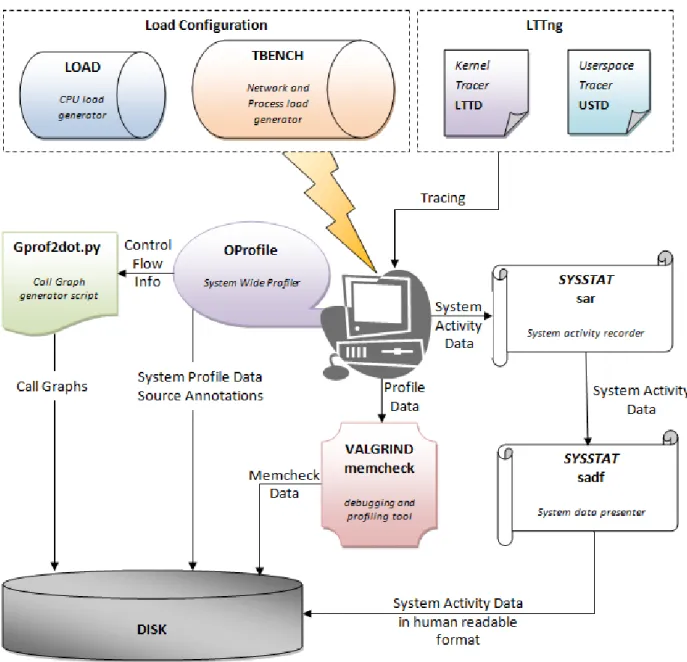
5.3 TEST SYSTEM SETUP ... 52
5.3.1 Tools Setup ... 52 5.3.2 Load Configuration ... 53 5.3.3 Test Automation ... 53 5.3.4 Performance Measurement ... 54 5.3.5 Result Analysis ... 54 6. EXPERIMENT METHODOLOGY ... 56 6.1 LOAD CONFIGURATION ... 57
6.1.1 Experiment 1 – Determination of load configuration parameters for System Under Test (SUT) ... 57
6.2 CONTROL FLOW ANALYSIS ... 58
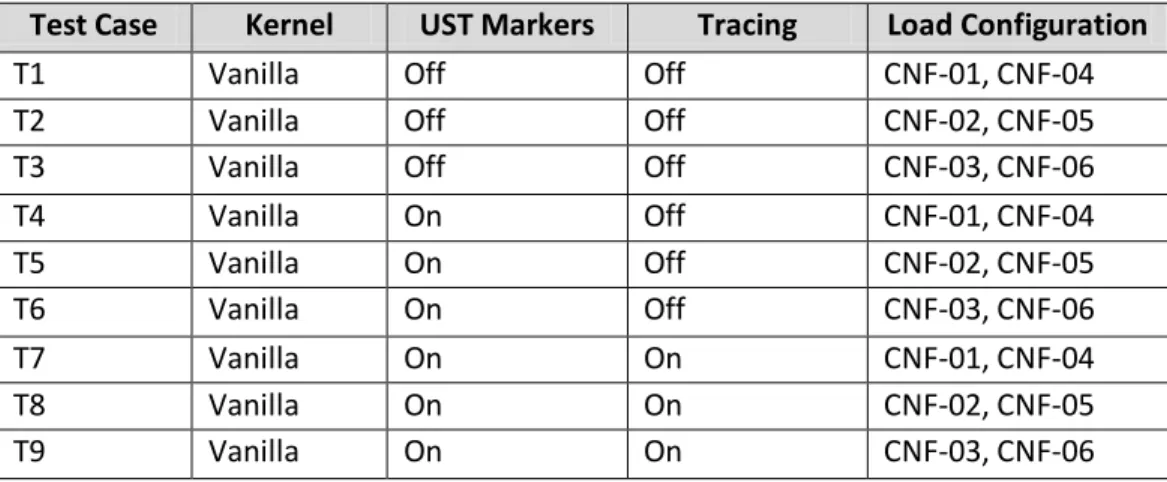
6.2.1 Experiment 2 – Measuring the efficiency of LTTng Kernel Tracer ... 58
6.2.2 Experiment 3 – Measuring the efficiency of LTTng Userspace Tracer ... 59
6.2.3 Experiment 4 – Measuring the impact on System as well as Traced Application when LTTng Kernel Tracer and Userspace Tracer are executed together ... 59
6.3 DATA FLOW ANALYSIS ... 61
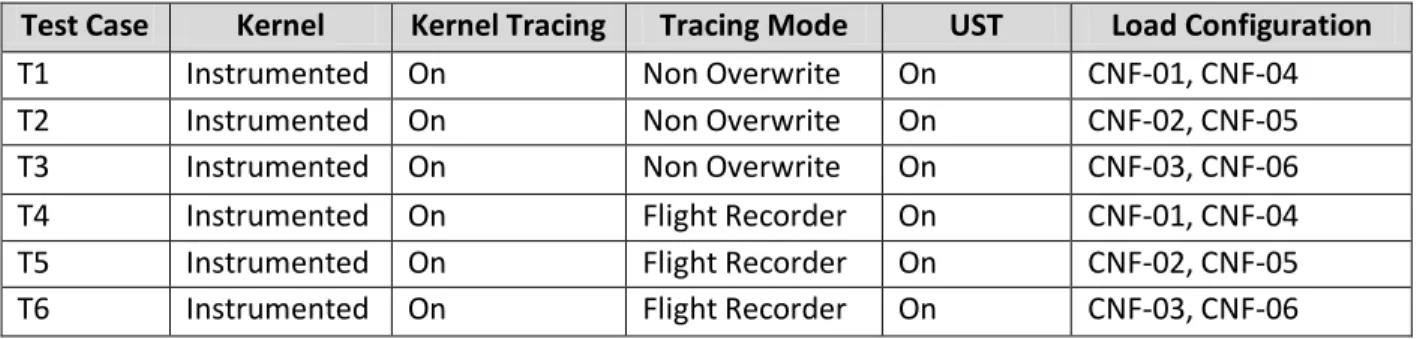
6.3.1 Experiment 5 – Running load program and tbench on LTTng Kernel with Non Overwrite and Flight Recorder tracing modes ... 61
6.3.2 Experiment 6 – Running UST tracing on load and tbench program each instrumented with 10 markers under different load configurations ... 61
6.3.3 Experiment 7 – Running the Kernel tracer with the help of Valgrind under various load configurations generated by load program (system load) and tbench (process and network load) ... 62
6.3.4 Experiment 8 – Running the load and tbench application instrumented with 10 markers under UST (Userspace Tracing) with the help of Valgrind ... 63
7. RESULTS ... 64
7.1 LOAD CONFIGURATION ... 65
7.1.1 Load Configuration parameters for System Under Test (SUT) ... 65
7.2 CONTROL FLOW ANALYSIS ... 66
7.2.1 Efficiency of LTTng Kernel Tracer with Load utility ... 66
Page | 8
7.2.3 Efficiency of LTTng Kernel Tracer ... 68
7.2.4 Footprint of LTTng Kernel Tracer Daemon (LTTD) ... 69
7.2.5 Call Graph Analysis for LTTng Kernel Tracer ... 70
7.2.6 Efficiency of LTTng Userspace Tracer with Load utility ... 73
7.2.7 Efficiency of LTTng Userspace Tracer with Tbench utility ... 74
7.2.8 Efficiency of LTTng Userspace Tracer ... 75
7.2.9 Footprint of LTTng Userspace Tracer Daemon (USTD) ... 79
7.2.10 Call Graph Analysis of LTTng Userspace Tracer ... 81
7.2.11 Combined Impact of LTTng Kernel and Userspace Tracer ... 84
7.3 DATA FLOW ANALYSIS ... 89
7.3.1 L2 Caches Misses during execution of LTT Control Module with respect to various load configurations generated by load program and tbench ... 89
7.3.2 L2 Cache Misses of LTT Daemon with respect to various load configurations generated by load program and tbench ... 90
7.3.3 Branch Mispredictions exhibited by LTT Control module with respect to various load configurations generated by load program and tbench ... 91
7.3.4 Branch Mispredictions of LTT Daemon with respect to various load configurations generated by load program and tbench ... 93
7.3.5 Analysis of Memory Leak of LTT Control and LTT Daemon program during execution with respect to various load configurations generated by load program and tbench ... 94
7.3.6 L2 Cache Misses for UST Daemon during tracing of load and tbench program (10 markers) under various load configurations ... 94
7.3.7 Branch Misprediction for UST Daemon during tracing of load and tbench program (10 markers) under various load configurations ... 96
7.3.8 Analysis of Memory Leak of UST Tracer during execution with respect to various load configurations generated by load program and tbench ... 98
8. DISCUSSION ... 99
8.1 LIMITATIONS OF THE PERFORMED EXPERIMENTS ... 100
8.2 CHOICE OF CONTROL AND DATA FLOW ANALYSIS TOOLS ... 101
8.3 BENEFITS OF THE RESEARCH ... 103
9. CONCLUSION ... 104
10. FUTURE WORK ... 106
11. REFERENCES ... 107
APPENDIX A – EXPERIMENT RESULTS... 109
11.1 CONTROL FLOW ANALYSIS ... 109
11.1.1 Experiment 2 – Measuring the efficiency of LTTng Kernel Tracer... 109
11.1.2 Experiment 3 – Measuring the efficiency of LTTng Userspace Tracer... 112
11.1.3 Experiment 4 – Measuring the impact on System as well as Traced Application when LTTng Kernel Tracer and Userspace Tracer are executed together ... 117
11.2 DATA FLOW ANALYSIS ... 121
11.2.1 Experiment 5 – Running load program and tbench on LTTng Kernel with Non overwrite and Flight recorder tracing modes. ... 121
Page | 9 11.2.2 Experiment 6 – Running UST tracing on load and tbench program each instrumented with 10 markers under different load configurations. ... 123 11.2.3 Experiment 7 – Running the Kernel tracer with the help of Valgrind under various load
configurations generated by load program (system load) and tbench (process and network load). ... 123 11.2.4 Experiment 8 – Running the load and tbench application instrumented with 10 markers under UST (Userspace Tracing) with the help of Valgrind ... 125 APPENDIX B – LOAD PROGRAM SOURCE ... 127
Page | 10
Index of Tables
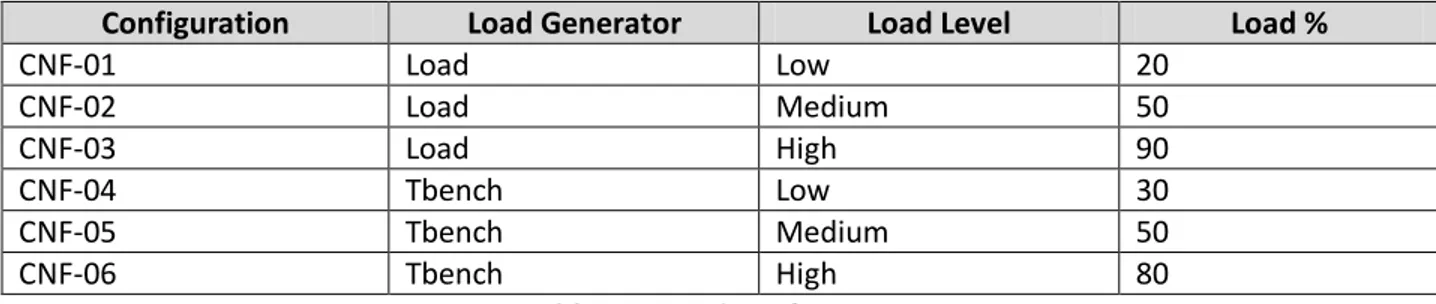
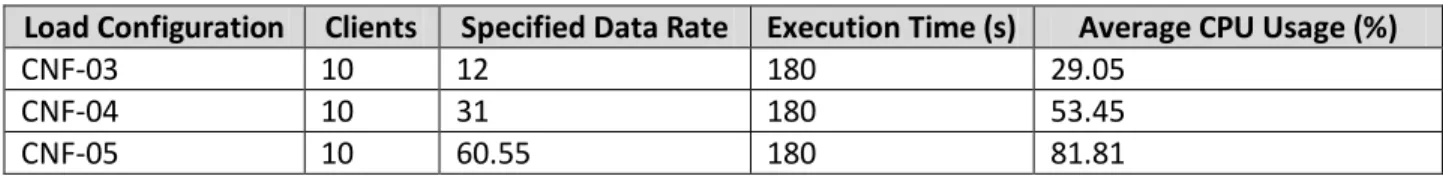
Table 5.1 Load Configuration Table 6.1 Load Configuration
Table 6.2 Load Configurations to be determined Table 6.3 Test Cases for Experiment 2
Table 6.4 Test Cases for Experiment 3 Table 6.5 Test Cases for Experiment 4 Table 6.6 Test Cases for Experiment 5 Table 6.7 Test Cases for Experiment 6 Table 6.8 Test Cases for Experiment 7 Table 6.9 Test Cases for Experiment 8
Table 7.1 Results for Load Configuration of load utility Table 7.2 Results for Load Configuration of tbench utility
Table 7.3 Impact of LTTng kernel tracer on kernel operations (Load) Table 7.4 Impact of LTTng kernel tracer on kernel operations (Tbench) Table 7.5 Impact of LTTng kernel tracer on kernel operations (Average) Table 7.6 Footprint of LTTD (Load)
Table 7.7 Footprint of LTTD (Tbench) Table 7.8 Footprint of LTTD (Average)
Table 7.9 Libraries and functions for LTTng Kernel Tracer (Load) Table 7.10 Libraries and functions for LTTng Kernel Tracer (Tbench) Table 7.11 Impact of UST on Load with 1 marker
Table 7.12 Impact of UST on Load with 5 markers Table 7.13 Impact of UST on Load with 10 markers Table 7.14 Impact of UST on Load (Average) Table 7.15 Impact of UST on Tbench with 1 marker Table 7.16 Impact of UST on Tbench with 5 markers Table 7.17 Impact of UST on Tbench with 10 markers Table 7.18 Impact of UST on Tbench (Average)
Table 7.19 Impact of UST on userspace applications (Average) Table 7.20 Impact of UST based on number of markers Table 7.21 Footprint of USTD (Load)
Table 7.22 Footprint of USTD (Tbench) Table 7.23 Footprint of USTD (Average)
Table 7.24 Libraries and functions for LTTng Userspace Tracer (Load) Table 7.25 Libraries and functions for LTTng Userspace Tracer (Tbench)
Table 7.26 Impact of LTTng kernel tracer and UST on kernel operations for 1 marker in load Table 7.27 Impact of LTTng kernel tracer and UST on kernel operations for 5 markers in load
Page | 11 Table 7.28 Impact of LTTng kernel tracer and UST on kernel operations for 10 markers in load Table 7.29 Average Impact of LTTng kernel tracer and UST on kernel operations (Load) Table 7.30 Impact of LTTng kernel tracer and UST on kernel operations for 1 marker in tbench Table 7.31 Impact of LTTng kernel tracer and UST on kernel operations for 5 markers in tbench Table 7.32 Impact of LTTng kernel tracer and UST on kernel operations for 10 markers in tbench Table 7.33 Average Impact of LTTng kernel tracer and UST on kernel operations (Tbench) Table 7.34 Average Combined Impact of LTTng kernel tracer and UST on kernel operations Table 7.35 L2 Cache Miss (lttctl) for load program
Table 7.36 L2 Cache Miss (lttctl) for tbench application Table 7.37 Average L2 Cache Miss (lttctl)
Table 7.38 Cache Miss (lttd) for load program Table 7.39 Cache Miss (lttd) for tbench program Table 7.40 Cache Miss (lttd)
Table 7.41 Branch Mispredictions (lttctl) for load program Table 7.42 Branch Mispredictions (lttctl) for tbench Table 7.43 Branch Mispredictions (lttctl)
Table 7.44 Branch Mispredictions (lttd) for load program Table 7.45 Branch Mispredictions (lttd) for tbench Table 7.46 Branch Mispredictions (lttd)
Table 7.47 Memory Leak for LTT Control (Kernel Tracer) Table 7.48 L2 Cache Miss for UST Daemon
Table 7.49 L2 Cache Miss (ustd & lttd)
Table 7.50 Branch Mispredictions for UST Daemon Table 7.51 Branch Mispredictions (ustd & lttd)
Page | 12
Index of Graphs
Graph 7.1 Impact of LTTng kernel tracer on kernel operations (Load) Graph 7.2 Impact of LTTng kernel tracer on kernel operations (Tbench)
Graph 7.3 Average Impact of LTTng kernel tracer on kernel operations for different load configurations Graph 7.4 Average Impact of LTTng Kernel Tracer
Graph 7.5 Call Graph Analysis of LTTng Kernel Tracer on Load Graph 7.6 Call Graph Analysis of LTTng Kernel Tracer on Tbench
Graph 7.7 Impact of UST on userspace applications for different load configurations Graph 7.8 Average Impact of UST on userspace applications
Graph 7.9 Impact of UST based on number of markers for different load configurations Graph 7.10 Average Impact of UST based on number of markers
Graph 7.11 Impact of load on USTD
Graph 7.12 Impact of the number of markers on USTD
Graph 7.13 Libraries and functions for LTTng Userspace Tracer (Load) Graph 7.14 Libraries and functions for LTTng Userspace Tracer (Tbench) Graph 7.15 Impact of LTTng kernel tracer and UST on kernel operations (Load) Graph 7.16 Impact of LTTng kernel tracer and UST on kernel operations (Tbench)
Graph 7.17 Average Combined Impact of LTTng kernel tracer and UST on kernel operations Graph 7.18 Overall L2 Cache Miss Rate for LTT Control
Graph 7.19 Overall L2 Cache Miss Rate for LTT Daemon Graph 7.20 Overall Branch Misprediction for LTT Control Graph 7.21 Overall Branch Misprediction for LTT Daemon Graph 7.22 L2 Cache Miss for UST Daemon
Graph 7.23 L2 Cache Miss (ustd vs. lttd)
Graph 7.24 Branch Mispredictions for UST Daemon Graph 7.25 Branch Mispredictions (ustd vs. lttd)
Page | 13
Index of Figures
Figure 4.1 Homogeneous Multicore Environment Figure 4.2 Heterogeneous Multicore Environment Figure 4.3 Distributed Memory Multicore Environment Figure 4.4 Shared Memory Multicore Environment Figure 4.5 Hybrid Memory Multicore Environment Figure 4.6 LTTng Tracer Architecture
Figure 4.7 LTTng Tracer Components Figure 4.8 LTTng Channel Components Figure 4.9 UST Architecture
Figure 4.10 Example of Call Graph
Figure 4.11 Example of Annotated Source Figure 5.1 tbench call graph output Figure 5.2 Test System Setup Figure 5.3 Result Analysis Figure 8.1 Valgrind Error Figure 8.2 Acumem Error
Page | 14
1.
Introduction
Ericsson as a company is rapidly growing in telecom sector with deployment of advanced technologies and increase in its user base. Slowly due to the pressure of the industry and hunger for more performance, Ericsson has moved into multicore processors and PowerPC architectures. Multicore architectures help to reduce footprint through virtualization, replacing many small processor boards and packing it into one slot and thus giving better and higher performance per slot and much more value for money. In a huge multicore system, it’s often difficult to track problems, issues and performance degradations. Many problems occur only once and do not repeat its behavior, and it’s a pain for the developers to look for it in large multiprocessor and multicore systems. LTTng provides a highly efficient set of tracing tools for Linux which is used for resolving performance issues and troubleshooting problems. Ericsson is in need for such a tool which can help it’s developers to backtrack and debug the problems and errors in the system. The research question catered in our thesis is to test the efficiency of LTTng as a kernel and userspace tracer in a multicore environment. As even nanoseconds of delay can cause performance degradations for telecommunication systems, we need to gauge the footprint of LTTng over a multicore system and in case the tool has pretty low overhead, Ericsson can deploy it on the system for helping its developers to effectively backtrack the performance loopholes.
Page | 15
1.1
Organization of Thesis
The thesis document is organized in several chapters:
The chapter Problem Formulation introduces the problem statement of our thesis work. Then it divides the problem into several sub-problems and finally tries to offer a solution to the bigger problem by solving the smaller problems.
The chapter Background provides the background knowledge on the technologies on which our thesis work is based. It explains the basics of tracing and then provides an insight of embedded systems and multicore systems. Then it provides detailed information about LTTng kernel and userspace tracer architecture and functionality. Finally this chapter wraps up with the description of the lab environment on which our experiments have been executed.
The chapter Related Work starts off with an overview of our goal. Then it explains our search methodology. Finally, it concentrates on citation of the previous work done that was useful to us to proceed in the correct direction and helped us making the correct decisions throughout our thesis work. It also describes similar work done in past.
The chapter Experiment Setup describes in detail the use of technologies in our experiments. These technologies include the hardware and software configurations and tools, utilities and scripts used to perform the experiments.
The chapter Experiment Methodology describes the experiment methods in detail that are to be performed on LTTng kernel tracer and userspace tracer.
The chapter Results presents the analysis of results that are obtained by performing the experiments mentioned in the experiment methodology chapter.
The chapter Discussion mainly focuses upon the constraints of experiments executed and the issues faced during the research period. The issues discussed concentrates upon the unavailability of tools and time limitation of the thesis standing as the main barriers. Last part of the Discussion aims to evaluate the benefits of this research to the community and the industry.
The chapter Conclusion focuses on the important findings from the experiments performed in course of this research work and tries to draw a conclusion from the findings.
The chapter Future Work throws light on the possibilities of continuing our research work. These also include extending our research by overcoming the limitations we faced.
Page | 16
2.
Problem Formulation
This chapter introduces the problem statement of our thesis work. Then it divides the problem into several sub-problems and finally tries to offer a solution to the bigger problem by solving the smaller problems.
List of technical terms
LTTng Linux Trace Toolkit Next Generation TCF Target Communication Framework
Page | 17
2.1
Problem Statement
Modern day systems are becoming more complex which invites the need of an effective and high performance trace mechanism. LTTng being developed as a next generation tracing utility for Linux supports both kernel space and user space tracing and claims to perform high performance tracing with a very low overhead on the system. LTTng has the capability to dump the trace data either to the disk or to the network.
The primary question that our research is going to address is:
How efficient is LTTng as a kernel as well as userspace tracer on a multicore environment?
2.2
Problem Analysis
To quantify the efficiency of tracing utility it’s very necessary to size down the fingerprints of the tool on the system or on the other applications running in it. To measure the fingerprint on the system various data and control flow analysis on LTTng modules should be carried out. This will help us to get a broader picture for the fingerprint involving details of how it affected the system or the user programs.
Thus the first and preliminary refinement of our research question stands as:
1. How does LTTng affect the control flow and data flow in kernelspace as well as userspace on a
multicore environment?
LTTng has a trace viewer called LTTV which helps to view the trace generated by LTTng in a GUI environment thus helping the end user to view the system trace effectively with control flow charts and resource viewers. For multicore AMP systems the efficiency of LTTng can be increased if the tracing can be controlled remotely from another system and also if it can stream the trace over network effectively. Thus our research question can be refined to the below question:
2. How to efficiently stream the trace data for multicore systems to remote host (Eclipse)? Eclipse team is in process to develop LTTng integration tool.
Page | 18 The above mentioned sub problems are elaborated below which ultimately leads us to the final aim of the thesis.
How does LTTng affect the control flow and data flow in kernelspace as well as userspace on a multicore environment?
Control Flow analysis involves the use of a profiler to scan through the function and system calls of the events in the multicore environment. Data Flow study on the events focus on the Cache Behavior and Data Path analysis. All together these both help us to reach to the conclusion regarding the effect of LTTng on a multicore system.
How to efficiently stream the trace data for multicore systems to remote host (Eclipse)?
The general approach will be to use a network protocol called Target Communication Framework (TCF) for streaming the trace data to Eclipse. We will measure the efficiency of LTTng in streaming huge amount of trace data, gathered from different cores, over the network to Eclipse. The results will enable us to narrow down on an optimal architecture to stream the LTTng trace on a multicore system.
The results of the sub-problems will enable us to comment on the efficiency of LTTng as a kernel as well as userspace tracer on multicore environment.
All the above discussion on the problem statement and analysis marks the need of a brief background study on tracing, embedded systems, multicore environment, LTTng, Control Flow and Data Flow analysis. We also discuss in the forthcoming Related Work chapter about similar work and experiments carried out by other researchers and also some other useful work which helps us to get a correct direction to proceed forward with our study and analysis.
Page | 19
3.
Background
This chapter provides the background knowledge on the technologies on which our thesis work is based. It explains the basics of tracing and then provides an insight of embedded systems and multicore systems. Then it provides detailed information about LTTng kernel and userspace tracer architecture and functionality. Finally this chapter wraps up with the description of the lab environment on which our experiments have been executed.
List of technical terms
PC Personal Computer
ASIP Application Specific Instruction Set ASIC Application Specific Integrated Circuit CPU Central Processing Unit
I/O Input / Output
AC Alternating Current
DMA Direct Memory Access GPP General Purpose Processor AMP Asymmetric Multiprocessing SMP Symmetric Multiprocessing
LTTng Linux Trace Toolkit Next Generation
UST Userspace Tracer
LTTV LTT Viewer
RCU Read Copy Update
OMAP Open Multimedia Application Platform
MIPS Microprocessor without Interlocked Pipeline Stages NMI Non-Maskable Interrupt
PID Process ID
GUI Graphical User Interface IBM International Business Machine
Page | 20
3.1
Tracing
Tracing is a mechanism to identify and analyze the behavior of a system. Tracing is a technique of
recording low level events that frequently occur in a system along with the timestamps and attributes of the events [SHE99]. A tool that performs tracing on a system is known as tracer. A tracer records a huge number of events that occur in a system in a period of time and generates large amounts of data known as traces. The size of a trace may vary from a few megabytes to several gigabytes [LTT10].
A tracer generally records operating system kernel events that include [LTT10]:
Interrupt Requests
System Calls
Scheduling Activities
Network Activities
A tracer may also be capable of recording events that are generated by an application.
Equally important is to present the trace data in a meaningful way to the user. A trace analyzer or trace viewer is an application that produces graphs and statistics from the trace data generated by the tracer [LTT10].
Tracing helps in the following activities [LTT10][SHE99]:
Debugging: A tracer helps to identify performance bugs and bottlenecks in complex parallel systems and real time systems.
Monitoring: A tracer helps to maintain and analyze statics of events and their timestamps, attributes and flow of control from one event to another. These data may be utilized in a lot of different activities.
Tracing a system involves the following steps [SHE99]:
Instrumentation: Instrumentation is the modification of source code of an application where instructions are added to the program that helps to generate trace data.
Measurement: Recording different aspects of execution of an application such as resources consumed, mapping of these resources to the application routines and statements.
Analysis: Analysis of the performance data that is generated in the subsequent phases of
Page | 21
3.2
Embedded Systems
As technology is climbing new heights we need more and more systems which are standalone and can work without human intervention. An embedded system is a microprocessor-base system that is built to control a function or range of functions and is not programmed by the end user in the same way that a PC [Sér02]. Often embedded systems also handle time critical applications which require utmost time precision. It can respond, monitor and control the external environment using sensors and actuators and is based upon application level processors. One of the major considerations when designing an embedded system is the consumption of power, which should always be less whether it is battery driven or wall powered. Manufacturing cost is an important aspect to be maintained during design of Embedded Systems.
3.2.1 Classes of Embedded Systems
Embedded Systems can be typically categorized into two different subclasses [NR98]. They are:
Embedded Controllers: Embedded Controllers are those which are dedicated to control particular functions and are thus reactive to external environmental events. Control systems react to external stimuli by changing its internal state and producing desired result. Home appliances can be cited as a example for Embedded Controllers.
Embedded Data Processing Systems: Embedded data processing systems are also called
transformational systems as they are dedicated to communication and data processing. They
are data flow dominated real time systems that execute a special function within a predefined time window. These systems require much higher performance than the embedded controllers and thus require powerful microprocessors like ASIP (Application Specific Instruction Set) and circuits like ASIC (Application Specific Integrated Circuit). Audio/Video Application and Wireless Communicators can be cited a example for this
3.2.2 Challenges in Embedded Systems Design
In case of design requirements embedded systems face several challenges [Sér02][Tam05]. They are: 1) Physical size and weight restrictions: It varies greatly with the application. The high
performance processing systems tends to be much larger and heavier than the slower systems. At system level design higher cache memory needs bigger circuit boards and at CPU level the board size increases if there is increase in number of pines.
Page | 22 2) Performance: The main performance metrics are instructions per second, interrupt response
characteristics, context switching overhead and I/O performance.
3) Power Consumption: It should always be low in case of battery driven equipments. For direct AC powered systems the power consumption should be kept minimal to reduce heat generation or increase of cooling requirements.
4) Cost of the embedded system: Manufacturing cost includes cost of components and assembly. Non-recurring engineering cost which includes personnel and other cost of system designing. 5) Reliability: Embedded systems can be subjected to extreme operative conditions like in military
or automotive sectors. The embedded system should be properly functional at extreme conditions and deliver results within its time boundaries.
3.2.3 Real Time Architecture Constraints
Embedded systems have two important performance rules to be maintained, predictability and
determinacy. In many occasions embedded systems work in real time environments in which it must
finish operation by certain deadlines failing to which can cause major disasters or in some cases degradation of performance. There are many architectural features which are considered as inappropriate for hard real time embedded systems [KP90][Sér02] and are discussed below -
Cache Memory provides the biggest source of unpredictability and non-determinacy. The problem is with scheduling the instruction cache misses because the time required to process a cache miss is a magnitude slower than processing a cache hit. If smaller percentage of cache miss is present during the execution, it dedicatedly reduces the speed of operation. Thus hard real time embedded system hardware is designed with fast static memory chip that renders cache management hardware superfluous. There is also dependability on the variable execution time of the instructions, as depending upon the input data, different instruction sets take variable number of clock cycles for the execution. With write buffers CPU can perform write operation to the memory without waiting for the memory cycle to occur. Processor must be stalled in case the write buffer overflows and there are no subsequent free bus cycles. There should also be additional stalls in case the memory read corresponds to a memory location that is yet to be updated by the write buffer. The interaction which takes place between cache misses, write buffer and data fetching causes loss of both predictability and determinacy of the Embedded System.
Interrupt Response Latency increases with deep instruction pipelines. An instruction takes several clock cycles to pass through pipelines and perform its job. The pipeline also needs some handling of delays in memory access or data dependencies which results in either software generated instructions rearrangement or hardware generated pipeline halts which results in unpredictability and non-deterministic behavior. Multiple instructions can be issued in a single clock cycle by the microprocessor. The number of instructions that can be issued together depends on the type of instructions, the
Page | 23 available hardware resources and execution history of the program. Thus these all factors make it very difficult to calculate single instruction executed time.
Branch Target Buffers is a mechanism in which the program execution history is used for caching instructions at branch targets for faster access. Branch target buffers are used with the context of branch prediction strategies in which compiler guesses which branch is to be taken by the instruction causing to fetch the next instruction or branch goal before the outcome of the ongoing instruction. The challenge occurs to calculate the branch completion time as it depends on the matching of branch target buffer value and the compiler guess.
Prefetch Queues affects the predictability of an operation because the time required for completion of the instruction cycle is solely determined by the fact that whether the preceding instructions were slow enough to allow the Prefetch queue to accumulate new instructions. Thus to determine execution time of one instruction cycle, it is required to determine the clock (depends upon data dependent path, cache misses etc) for several preceding instruction cycles so that there are free memory cycles or not for the Prefetch queue to fill.
Page | 24
3.3
Multicore Systems
In the computer industry, the customers always expect faster and more powerful systems. There is a persistent need of increase in performance in the computer industry, be it embedded systems or desktop computing.
Multicore processing comes into the picture as a key to continuous improvement of performance according to the consumers’ expectations. The cope up with the consumers’ expectations is a real challenge not only for the semiconductor industry but also for the software industry.
3.3.1 Migration from Single Core to Multicore
The multicore systems can increase the performance of multi-threaded applications significantly by increasing the processing power but with a relatively low latency. The migration from single core systems to multicore systems requires considerable changes to the system as well as to software. Therefore, the factors that have driven the semiconductor industry to migrate from single core to multicore systems should be worth the additional work that is required to be done.
The most prominent driving factors [SLES09] for the migration from single core to multicore are:
Performance
A way to increase the performance of a single core system is to increase the core frequency. But, pushing up the core frequency does not always increase the performance of the system in the same proportion. The techniques like parallelism and pipelining does not always scale with the frequency. It is not always easy for a single core processer to handle Parallel Processing timeline issues. If the frequency of the core does not match with frequency of off-chip memory and I/O subsystems the core may have to wait for the off-chip busses to transfer data. This particular phenomenon is called memory wall.
Power Consumption
The power consumption for a core to operate is proportional to the frequency of the core. Therefore, doubling the frequency of a core to gain performance increases the power consumption by four times. The equation presented below shows the relation between power and frequency.
Page | 25 To overcome the processor and off-chip memory and I/O subsystems frequency lag, large fast on-chip caches have been implemented which increases power consumption. An efficient cooling system will consume power, whereas if the generated heat is substantially less the core can reside even without a cooling mechanism.
Simplicity in Design
Multicore architecture enables less complicated or no cooling mechanisms and better performance with smaller caches. These contribute to simpler board design rather than increasing the frequency of a single core.
Cost
Multicore architecture enables less complicated or no cooling mechanisms and better performance with smaller caches. These contribute to comparatively lesser costs rather than increasing the frequency of a single core.
3.3.2 Parallelism in Multicore Processing
Parallelism is an important feature for modern day computing. Most of the modern systems are
equipped with parallelism. The different types of parallelism [SLES09] that are implemented in multicore processing are:
Bit Level Parallelism
Instruction Level Parallelism
Data Parallelism
Task Parallelism
Bit Level Parallelism enables the hardware to operate on larger data. For example, if an 8-bit
core is performing computation on a 16-bit data, it will need two instruction cycles to complete the computation. Therefore by increasing the word length from 8 to 16 will enable the processor to do the computation in one instruction cycle. Currently we have 64-bit word length to perform computation on large data in a single instruction cycle.
Instruction Level Parallelism is the method of identifying the instructions that does not depend
on one another and processing them simultaneously.
Data Parallelism is the technique of processing multiple data in a single instruction cycle. In
multicore architecture, performance improvement depends on different cores being able to work on the data at the same time.
Task Parallelism is the method to distribute the applications, processes and threads to different
Page | 26
3.3.3 Types of Multicore
The multicore systems can be categorized into two distinct types based on the core topology [SLES09]: Homogeneous Multicore System
A homogeneous multicore system consists of identical cores that execute the same instruction set.
Figure 4.1: Homogeneous Multicore Environment
Heterogeneous Multicore System
A heterogeneous system consists of cores that are not identical. Here, different types of cores execute different instruction sets.
Figure 4.2: Heterogeneous Multicore Environment
The multicore systems can be categorized into the following types based on the memory topology [SLES09]:
General Tasks
Type 1 Core Type 1 Core Type 1 Core Type 1 Core Type 1 Core Type 1 CoreGeneral Tasks
Type 1 Core Type 1 CoreData Processing
Type 2 Core Type 2Core Type 2 CorePage | 27 Distributed Memory Multicore System
In distributed memory multicore systems each core has a private memory. The communication between the cores takes place over a high speed network.
Figure 4.3: Distributed Memory Multicore Environment
Shared Memory Multicore System
In shared memory multicore systems there is a common memory which is shared by all cores in the system.
Figure 4.4: Shared Memory Multicore Environment
Hybrid Memory Multicore System
In hybrid memory multicore systems there is a common memory which is shared across all cores in the system. Each core also has its own private memory as well.
Figure 4.5: Hybrid Memory Multicore Environment
Private Memory Private Memory Private Memory Private Memory Core Core Core Core Shared Memory Core Core Core Core Private Memory Private Memory Private Memory Private Memory Core Core Core Core Shared Memory
Page | 28
3.3.4 Inter-core Communication
In a multicore system it is very important for the individual cores to communicate within themselves. In most multicore systems the cores can be connected to each other with the help of high speed buses or
coherent communication fabric [SLES09].
The common network topologies in which the cores can be interconnected are bus, mesh, ring or crossbar. The cores may also share caches or memory as a part of inter-core communication.
3.3.5 Multicore Design Approaches
The multicore system architecture focuses mostly on data and task parallelism. Multicore design approaches vary depending on the data management and handling of tasks [SLES09]. They are:
Asymmetric Multiprocessing (AMP)
Symmetric Multiprocessing (SMP)
In asymmetric multiprocessing design each core operates independently and performs dedicated tasks. Each core has its own logically or physically separated memory and can run operating systems independent of the other cores. The operating system running on different cores communicate with a help of hypervisor. The cores can either be homogeneous or heterogeneous in type.
In symmetric multiprocessing design all the cores share the same memory, operating system and other resources. The operating system takes care of the distribution and tasks and resources across the cores. The cores should be homogenous in type in order to support symmetric multiprocessing.
3.3.6 Problems in Multicore Systems
However, a few problems still exist in multicore systems [MUC09]. The memory performance does not match the core performance thus creating a bottleneck, which results in starvation of cores. It is not easy to create algorithms having independent tasks to execute on different cores simultaneously.
Page | 29
3.4
LTTng
3.4.1 Overview
LTTng is an effective tracing platform that has been developed to take over its previous version, the Linux Trace Toolkit [LTT00]. The LTTng Project provides effective kernel space and user space tracing solutions for Linux platforms for performance monitoring and debugging. The LTTng Project comprises of the following tracing tools [LTT10]:
LTTng Kernel Tracer
LTTng Userspace Tracer (UST)
LTT Viewer (LTTV)
3.4.2 Features of LTTng
LTTng was developed keeping in mind the requirements that a new generation tracing application should provide [DD06]. The most distinctive features [LTT10] sported by the latest release of LTTng are:
Integrated tracing of kernel space and user space: LTTng provides a way of tracing the kernel as well as the applications that are present in the user space simultaneously. The LTTng userspace tracer can be used along with the kernel tracer for effective debugging and performance monitoring.
High performance yet Low Impact: LTTng provides effective tracing probes without any system calls and a good instrumentation coverage for kernel tracing that helps to get a detailed analysis of the performance of the system. LTTng has very low observer effect on the traced system. This is essentially done using userspace RCU, atomic data structures to have really lockless
algorithms and cache optimization. Inactive instrumentation has almost negligible performance
impact on the system. Active instrumentation points have a very low performance impact.
Timestamp precision: LTTng provides effective clock synchronization technique for maintaining timestamp precision for events.
Security: LTTng has been designed keeping in mind that it has to be deployed in Linux production systems where security is an issue. The flow of data between kernel and userspace might not be acceptable in production environment. Therefore, use of per-CPU buffers for reading and writing by kernel or a user process keeps it fit for use in production environment.
Portable: LTTng is portable to various system architectures. The latest release of LTTng kernel tracer supports x86-32, x86-64, PowerPC 32/64, ARMv7 OMAP3, MIPS, sh, sparc64, s390. The latest release of LTTng userspace tracer supports x86-32 and x86-64.
Page | 30
Scalable: The LTTng tracer supports multiple CPU cores and a wide range of CPU frequencies with very little impact in performance.
Flexible and extensible: LTTng provides the flexibility to add custom instrumentation. It also provides an easy to use interface for trace analysis which is also extensible for adding new functionalities for trace analysis.
Reentrancy: LTTng provides complete NMI-reentrancy to ensure that NMI nesting does not cause deadlocks in the system.
3.4.3 LTTng Tracer Architecture
To perform extensive analysis of traces the trace data is extracted from the kernel. The tracing process has been divided into two phases, tracing phase and post processing phase [DES09]. Between the tracing phase and the post processing phase, Input/output represents the extraction of trace data to disk or network. Figure 4.6 presents the LTTng architecture with the two phases.
Page | 31 The tracing phase is carried out in the target system, which uses processor, memory and I/O resources. Initially the kernel is patched by inserting the instrumentation in the kernel. When the kernel reaches an instrumentation point, it verifies if the instrumentation point is activated, it calls the tracing probes attached to that instrumentation site. The probes write the trace event data into circular buffers in a synchronized manner. Trace data can be extracted in two different modes [DES09]:
Flight Recorder Mode: Trace data is not extracted when the circular buffers are full. Eventually, when the trace is stopped that latest data in the buffers is extracted. This mode of tracing in called flight recorder mode.
Non-Overwrite Mode: Trace data is extracted whenever the circular buffers are full. Therefore, trace data is not lost. This mode of tracing is called non-overwrite mode.
I/O operations required to write the trace data to the disk or network are costly, therefore not done by the probes. There are specialized threads for performing the I/O operations. It can be done while the tracing is being done as well as when the trace session is over.
To minimize the effect on the system’s performance while extracting large amount of trace data a zero-copy approach has been taken at LTTng design level while data extraction. A zero-copy approach ensures that no trace data is copied between memory locations in the tracing phases. This also ensures an effective use of memory bandwidth.
The recording of the events in the post processing phase is done by collecting a timestamp value from the traced processor and then the probe writes the timestamp value to the event header. The timestamp is a time-source that is synchronized between all the traced processors.
The tracing phase and post processing phase may be performed in the same environment or it might be in different environments. Therefore, the trace output is a self described binary file for easy extraction and portability.
3.4.4 LTTng Design
The kernel code can be instrumented in two ways:
Static Instrumentation at source code level using Linux kernel markers and tracepoints
Dynamic instrumentation using Kprobes
When an active instrumented code is reached during the execution of the kernel, the LTTng probe is called. The probe reads the trace session and writes the events into channels. Figure 4.7 portrays the different components of LTTng kernel tracer and their interactions [DES09].
Page | 32 Figure 4.7: LTTng Tracer Components [DES09]
Trace Session: A trace session consists of the trace configuration and a set of channels that are to be used by the trace session. A trace session can have several channels attached to it. The trace configuration consists of the following data:
Trace session is active or not
The event filters to be applied
Channel: A channel is an information pipe between the writer and the reader. It acts a buffer to transport data efficiently. A channel consists of one buffer per CPU eliminate false sharing and at the same time having a cache locality. A few properties can be configured at the time of trace session creation. The configurable properties of channels are:
Page | 33
Tracing mode
Buffer size
Buffer flush period
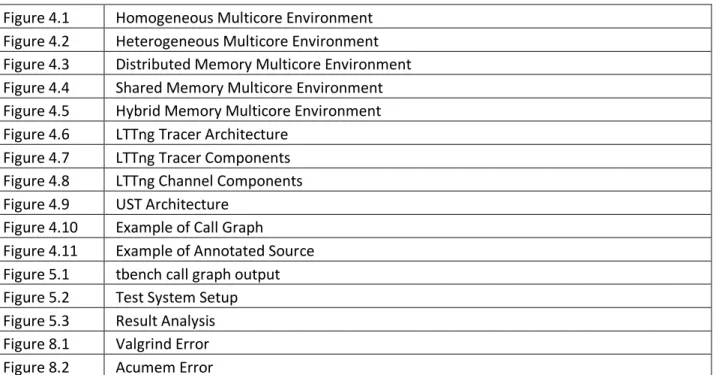
A channel in turn is composed of several sub-buffers and in each sub-buffer slots are reserved by the LTTng probes to write the event data into them. The lttd extracts each sub-buffer separately to the disk or network. The components of a channel are displayed in Figure 4.8.
Slot: A slot is a part of sub-buffer reserved for exclusive write access by the LTTng probe. The data written by the probe to each slot is the sub-buffer header, event header or payload.
Figure 4.8: LTTng Channel Components [DES09]
DebugFS: DebugFS is a virtual file system which provides an interface to extract data from kernelspace to userspace. The trace session and channel data structures are represented as DebugFS virtual files so that lttctl and lttd can interact with them.
lttctl: The command-line application lttctl is an interface that interacts with the DebugFS in order to control the kernel tracing. The lttctl is responsible for the following:
Configuration of the trace session before tracing is started
Start tracing
Stop tracing
lttd: The userspace daemon lttd is responsible to interact with the DebugFS an extract the channels data to disk or network. The lttd does not have in interaction with the trace session directly.
Page | 34
3.4.5 LTTng Userspace Tracer
LTTng provides a highly efficient kernel tracer but lacks a userspace tracer with similar performance. The LTTng userspace tracer (UST) is basically ported from the LTTng static kernel tracer to userspace, and is a work in progress.
3.4.5.1
UST Architecture
The userspace tracer has the following design level goals that should reflect in its architecture [FDD09]:
UST is completely independent of the kernel tracer during trace time. The UST trace and the kernel trace can be correlated during the analysis time.
UST is completely reentrant
UST supports tracing of event handlers and multithreaded applications in userspace.
To achieve better performance and low impact UST does not have system calls.
UST employs zero-copy, therefore data is never copied.
UST is able to trace code in executables as well as shared libraries
The instrumentation point whether it is a marker or a tracepoint, should support unlimited number of arguments.
UST does not require any compiler or linker support to generate trace data.
UST produces a compact and coherent trace format for analysis.
Figure 4.9 shows the architecture of UST:
Page | 35
3.4.5.2
UST Libraries
The programs must be linked with two libraries in order to get traced. The libraries are [FDD09]:
Userspace tracing library – libust
Userspace RCU library – liburcu
3.4.5.3
Time Synchronization
The LTTng userspace tracer does on have any dependency on the LTTng kernel tracer or vice versa [FDD09]. However, in order to do a combined analysis of the userspace and kernel traces it is necessary that the event timestamps of both the traces should be from the same time-source. The UST currently runs only on x86_32, x86_64 and ppc32 architectures [FDD09].
3.4.5.4
UST Data Collection
A userspace process called ustd collects data for all the processes that are being traced. The ustd opens a socket named ustd in the same directory as the traced application and wait for the command to collect the traced data from a certain buffer for a PID. On command ustd creates a consumer thread that eventually writes the trace data into the trace file [FDD09].
3.4.6 LTT Viewer (LTTV)
The LTT Viewer is a common GUI based trace analysis tool for kernel tracer as well as userspace tracer. LTTV is a trace viewer and is independent of LTTng tracer. It can open and filter traces based on different plugins.
As LTTV is easily extensible, developers can extend the functionality of LTTV by developing plugins. To get better performance results LTTV is written in C and uses glib and GTK graphical library.
3.4.7 Use of LTTng
LTTng has been used by some organizations for debugging and performance monitoring. IBM used LTTng successfully to solve some of their distributed filesystem related issue. Autodesk used LTTng to solve some real time issues in their application development. Siemens used LTTng to do some internal debugging and performance monitoring. The Linux distributions Montavista, Wind River, STLinux and
Page | 36
3.4.8 How to use LTTng?
LTTng kernel tracer has good instrumentation coverage, which are basically code changes to insert LTTng probes into a kernel. Therefore, the LTTng instrumentation set is distributed as a kernel patch series. LTTng has the flexibility to build the kernel instrumentation inside the kernel as well as build them as modules. Another package called ltt-control contains the lttctl and the lttd userspace applications needed for tracing.
LTTng userspace tracer comes as a package called ust that installs userspace tracer in a system. The ust package depends on the userspace-rcu library, which has to be installed before the ust package.
LTTV acts as a trace viewer and analyzer for both LTTng kernel and userspace trace files. LTTV comes as a separate lttv package and does not have any dependency on LTTng kernel or userspace tracer. But the lttv depends on the trace format the LTTng tracer produces. Therefore, the lttv package should be compatible with the LTTng kernel and userspace tracer trace format to be able to view trace files.
Page | 37
3.5
Control and Data Flow Analysis
3.5.1 Control Flow Analysis
In the context of this thesis report we define control flow as the order or pattern in which the application program calls or executes various other applications or snippets of code (like functions and procedures). Control Flow analysis helps to optimize the work flow execution of application programs and to determine functions and system calls which takes more amount of time [LPGF08]. If the execution of any program is getting more delayed than usual, the control flow analysis can easily help to find out the reason for the delay. For the whole system and the running application programs the control flow analysis can be done by a system profiler who takes time based samples of all the applications depending upon its footprint on the system and displays it at the end of sampling. From such sampling we can generate call graph which diagrammatically represents the functions and the system calls that the application made during its time of execution.
An example of a call graph which gets generated during the program execution is shown in Figure 4.10.
Figure 4.10: Example of Call Graph
The call graph in Figure 4.10 shows how the application program tbench makes calls to functions and programs during its sample run. We can also see how much time is spent in each of the functions and
Page | 38 system calls. We can either optimize the program checking in which function it spends more time and refractor it or otherwise can trace the delay of execution of the particular application program.
3.5.2 Data Flow Analysis
Data Flow analysis also helps to optimize the program to run better and faster than usual with effective use of system and memory. By annotating the source code of the application program we can get the lines of code which are using more number of CPU cycles and thus can be modified. One of the biggest performance measurement criteria in a multicore system is effective usage of memory and the CPU resources [ACU09]. The reason behind a line of code taking more CPU cycles can be improper memory management, irresponsible cache usage or improper data structures being used. Thus with certain tools we can gauge the usage of cache, rectify the temporal and spatial locality problem, hide the latencies involved in memory access and thus adding more Prefetch instructions. Increasing the cache line utilization of an application program decreases its execution timings and thus optimizes it further. We know that different ways of data representation and data access pattern can affect the performance of an application program. Thus Data and Control Flow analysis detects issues in application source code and also helps in optimizing the source program.
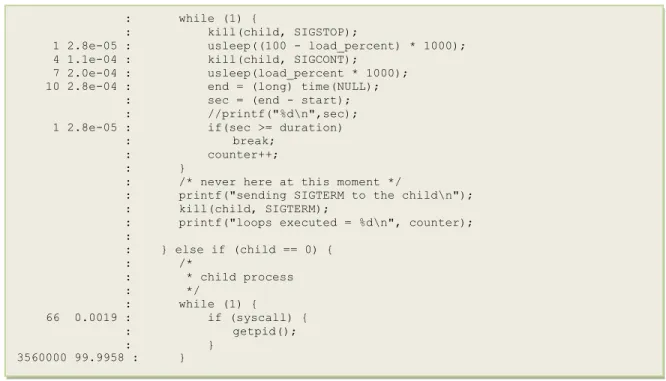
An example of annotated source code of an application program is shown in Figure 4.11.
Figure 4.11: Example of Annotated Source
The annotated source code provides the details of how many samples were taken for the particular line of code and its percentage of the total samples for that line. If the sample count for a particular line/block of code is more then it shows that it spends more CPU cycles than other lines of code.
: while (1) {
: kill(child, SIGSTOP);
1 2.8e-05 : usleep((100 - load_percent) * 1000); 4 1.1e-04 : kill(child, SIGCONT);
7 2.0e-04 : usleep(load_percent * 1000); 10 2.8e-04 : end = (long) time(NULL); : sec = (end - start); : //printf("%d\n",sec); 1 2.8e-05 : if(sec >= duration) : break;
: counter++; : }
: /* never here at this moment */
: printf("sending SIGTERM to the child\n"); : kill(child, SIGTERM);
: printf("loops executed = %d\n", counter); : : } else if (child == 0) { : /* : * child process : */ : while (1) { 66 0.0019 : if (syscall) { : getpid(); : } 3560000 99.9958 : }
Page | 39
4.
Related Work
This chapter starts off with an overview of our goal. Then it explains our search methodology. Finally, it concentrates on citation of the previous work done that was useful to us to proceed in the correct direction and helped us making the correct decisions throughout our thesis work. It also describes similar work done in past.
List of technical terms
LTTng Linux Trace Toolkit Next Generation
I/O Input / Output
CPU Central Processing Unit
RCU Read Copy Update
ASCI Accelerated Strategic Computing Initiative
RAM Random Access Memory
SATA Serial Advanced Technology Attachment RPM Revolutions Per Minute
Page | 40
4.1
Overview
LTTng comes with a set of efficient tracing tools for Linux which helps in solving performance and debugging issues involving multi threads and processes. LTTng aims to provide low disturbance and architecture neutral tracing tools which helps to track the pains in the system without involving much overhead.
Our goal mainly focuses on effectively gauging the fingerprint of LTTng as a tracing tool in a multicore Environment. There have been quite similar researches undergone before in getting either the effectiveness of tracing or the efficiency of LTTng in different architectures and environments which are described and explained in this chapter.
4.2
Search Methodology
LTTng was developed by Mathieu Desnoyers and was presented in his PhD thesis [DES09], so his thesis was the base for searching all the initial papers relating to LTTng and various other tracers which are there at present in the Linux Systems. The [LTT10] carries lots of invaluable papers from various conferences and journals which are somehow related to LTTng. As the thesis goal involved us to determine the performance measures for LTTng in a multicore environment, so the “multicore system” keyword search in Databases like IEEE and ACM gave us a lot of results and references to scientific journals. We got the information for the QorIQ™ P4080 Multicore processor board from the manufacturer’s website which contained documents explaining the whole structure and features of P4080. Our next objective was to do Control Flow and Data Flow Analysis of the System and LTTng respectively and thus we went through the details of what those terms actually meant and what are the details that can be found out from that. Keyword “Control Flow Analysis” and “Data Flow Analysis” when searched in Google Scholar ™ lead to multiple papers leading to either IEEE or ACM or different university Lecture sessions. The Cited papers in those papers also contained the tools for doing Control and Data Flow Analysis and from there we got profiling tools like OProfile, TAU, Gprof, Valgrind and many others in which we chose OProfile for Control Flow based upon the results and its effectiveness of working in different architectures. The other part of our thesis goal focuses in Streaming of the LTTng Trace to Eclipse over the TCF Framework. We got research material regarding TCF Framework from Google Scholar ™ which pointed us to Eclipse website and LTT Tools plugin page. All the scientific research papers and books referred to here are from Google Scholar ™, IEEE and ACM Databases.
![Figure 4.8: LTTng Channel Components [DES09]](https://thumb-eu.123doks.com/thumbv2/5dokorg/4730233.125128/33.918.199.720.346.661/figure-lttng-channel-components-des.webp)