J
Ö N K Ö P I N GI
N T E R N A T I O N A LB
U S I N E S SS
C H O O LJÖNKÖPING UNIVERSITY
W h a t ’s i n i t f o r Yo u ?
A Study of Perceived Customer Value among IKEA’s Business Customers
in the Kitchen Market
Bachelor’s thesis within Business Administration Author: Grom, Karin
Janhans, Louise Johansson, Emmelie Tutor: Müllern, Tomas Jönköping January 2006
Kandidatuppsats inom företagsekonomi
Titel: What’s in it for You?En studie av uppskattad kundvärde bland IKEAs företagskunder på köksmarknaden
Författare: Grom, Karin
Janhans, Louise
Johansson, Emmelie
Handledare: Tomas Müllern
Datum: Januari 2006
Ämnesord Customer Value, Business-to-Business Relationship
Sammanfattning
Företag har börjat koncentrera sig mer på kundrelationer, vilket betyder att man uppmärk-sammar kundkontakten istället för att enbart koncentrera sig på försäljningsobjektet. Det här sättet att tänka har vidareutvecklats till att företag ständigt skapar och utökar värdet för sina kunder, för att bevara dem lojala och nöjda. Värde kan skapas på olika sätt och företa-gen måste förstå vilka värdefaktorer som är ansedda som viktigast hos sina kunder. Av samma anledning har IKEA delegerat denna uppsats; för att få veta hur man skapar ett högre kundvärde. Med anledning av detta är syftet med denna uppsats att värdera och ran-ka faktorerna som sran-kapar kundvärde för IKEAs företagskunder på köksmarknaden. Med en kvantitativ metod i tanken är en marknadsundersökning fullföljd för att finna möj-ligheter och kunna lösa problem med existerande strategier. Information insamlades i över-ensstämmelse med metodkapitlet. Vidare analyserades och interpreterades de empiriska svaren med hjälp av teorikapitlet. Slutsatserna presenteras i slutet av uppsatsen.
Teorierna inom ämnet kundvärde har visat att pris, utförande och personifiering är avgö-rande faktorer bakom upplevt kundvärde. Ett starkt kundvärde kan åstadkommas när pris, utförande och personifiering är i balans och överträffar kundens förväntningar. När företa-get endast utför delar av triaden, kan inte ett fullständigt kundvärde uppnås.
Den empiriska informationen, framtagen via marknadsundersökning och kontakt med A. Larsson på IKEA, analyserades med hjälp av teorierna presenterade i uppsatsen. Med hjälp av en marknadsundersökning identifierades, värderades och rankades faktorerna bakom upplevt kundvärde. Resultaten har gjort det möjligt att se huruvida den teoretiska modellen av pris, utförande och personifiering överensstämmer med verkligheten.
Resultaten visar, i storleksordning, att pris, kvalitet och distributionsaktiviteter är de vikti-gaste faktorerna bakom kundvärde i en affärsrelation på köksmarknaden. Författarna har funnit att pris och utförande är de viktigaste faktorerna bakom uppfattad kundvärde. Per-sonifiering är också ansedd som en faktor bakom kundvärdet, men fungerar som en moti-vationsfaktor som stärker affärsrelationen.
Detta för oss till frågan; what’s in it for you? Det är viktigt att förstå att kunder och kund-grupper upplever värde på olika sätt. Detta leder till att IKEA måste betrakta vilka fakto-rerna är för dig, som företags kund, och hur dessa kan förbättras för ett stärka kundvärdet.
Bachelor’s Thesis within Business Administration
Title: What’s in it for You?A Study of Perceived Customer Value among IKEA’s Business Customers in the Kitchen Market
Author: Grom, Karin
Janhans, Louise
Johansson, Emmelie
Tutor: Tomas Müllern
Date: January 2006
Subject terms: Customer Value, Business-to-Business Relationship
Abstract
Companies have started to concentrate more on customer relationship, meaning more at-tention on customer contact, instead of concentrating on the product. Those thoughts have further developed into that companies continuously create and add value for their custom-ers, to keep them loyal and satisfied. Value can be created in different ways, and the com-panies need to understand the value factors that are considered most important among their customers. For the same reason IKEA commissioned this thesis; to know how to de-liver greater customer value. Therefore the purpose of this thesis is to evaluate and rank the factors that perceive customer value for IKEA’s business customers in the kitchen market. With a quantitative approach in mind a market research is accomplished to find opportuni-ties and solve problems of the existing strategy. Data was collected with help from a sur-vey, in accordance with the method chapter. Further was the survey analyzed and inter-preted with help from the theory in the frame of reference. The conclusions are presented in the end of the thesis.
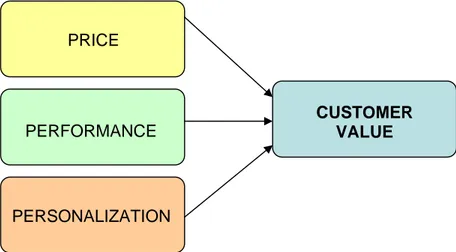
The theories within the subject of customer value show that price, performance and per-sonalization are the main factors that contribute to perceived customer value. Good cus-tomer value can be achieved when price, performance and personalization are in harmony and exceeds customer expectations. When companies only present parts of the triad, maximization of perceived customer value cannot be reached.
The empirical data, received through market research and personal communication with A. Larsson at IKEA, was analyzed with assistance of the theories. Through market research the factors that perceive customer value are identified, evaluated and ranked. The findings have made it possible to test if the model of price, performance and personalization is ac-curate in accordance to the reality.
The findings show, in ranked order, that price, quality and distribution activities are the main variables creating customer value in the business-to-business relationship in the kitchen market. The authors found that price and performance are the main drivers behind perceived customer value. Personalization is also considered contributing to customer value, but works more as a motivation factor that is strengthening the business relationship. This guides us to the question; what’s in it for you? It is of high importance to understand that customers and groups of customers perceive value in different ways. This leads to that IKEA needs to consider what factors that are in there for you, as a business customer, and how those variables can be improved for a better business relationship.
Table of Contents
1
Introduction ... 1
1.1 Problem Background... 1 1.2 Research Question ... 2 1.3 Purpose ... 22
Method ... 3
2.1 Introduction... 32.2 Qualitative versus Quantitative Research... 3
2.3 Data Collection Modes ... 4
2.3.1 Mail Surveys... 6 2.3.2 Questionnaire Design... 6 2.3.3 Sample Size ... 7 2.3.4 Questions ... 8 2.4 Trustworthiness ... 10
3
Frame of Reference ... 12
3.1 Business-to-Business Relationship... 12 3.2 Customer Value ... 13 3.2.1 Price ... 16 3.2.2 Performance... 19 3.2.3 Personalization... 233.2.4 Price, Performance and Personalization in Combination ... 27
4
Empirical framework... 29
4.1 IKEA ... 29 4.2 Background ... 31 4.3 Price ... 37 4.4 Performance... 39 4.5 Personalization... 494.6 Price, Performance and Personalization in Combination ... 53
5
Analysis ... 55
5.1 Price ... 56
5.2 Performance... 57
5.3 Personalization... 59
5.4 Price, Performance and Personalization in Combination ... 60
5.5 Theoretical Contribution ... 61
6
Conclusion ... 64
6.1 Further Research ... 65References... 66
Appendix 1... 70
Appendix 2... 74
Figures
Figure 3.1 Three parts of customer value ...15
Figure 3.2 Two parts of price ...17
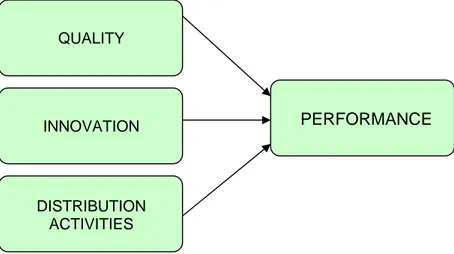
Figure 3.3 Three parts of performance ...19
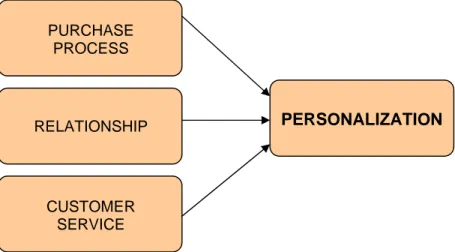
Figure 3.4 Three parts of personalization ...23
Figure 3.5 Process of constantly adding value (Seyed-Mohamed, 1990) ...24
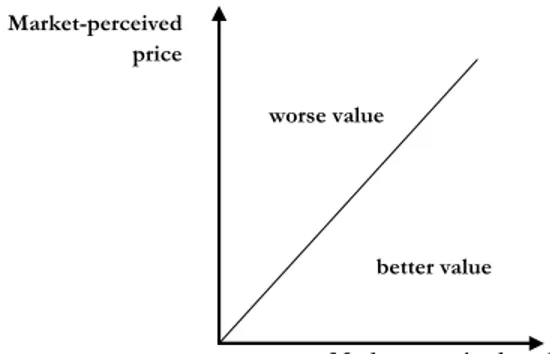
Figure 3.6 Value map (Daniels, 2000) ...27
Figure 4.1 Example of presentation of mean values ...34
Figure 4.2 Example of the line chart ...34
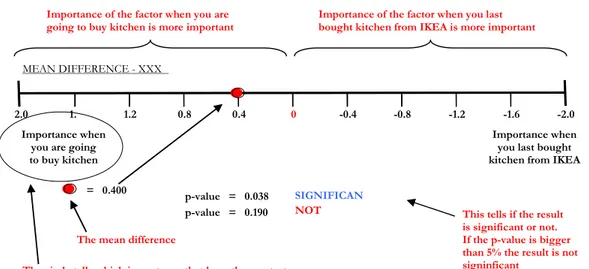
Figure 4.3 Example of mean difference ...35
Figure 4.4 Example of a confidence interval ...36
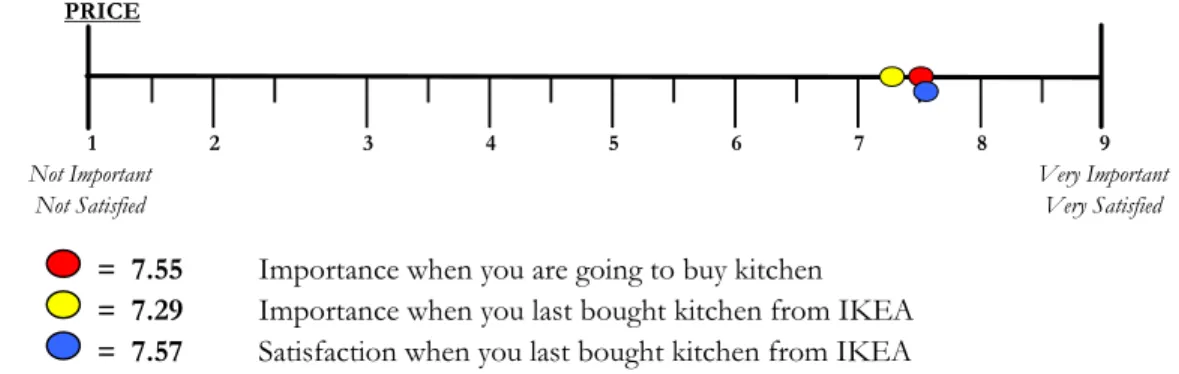
Figure 4.5 Line chart for price ...37
Figure 4.6 Mean difference – Price ...37
Figure 4.7 Mean difference – Price ...37
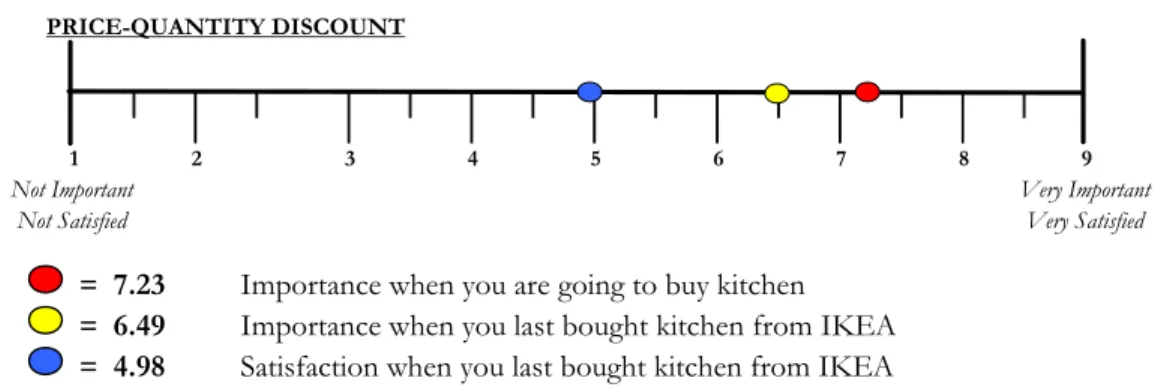
Figure 4.8 Line chart for price-quantity discount ...38
Figure 4.9 Mean difference – Price-quantity discount ...38
Figure 4.10 Mean difference – Price-quantity discount ...38
Figure 4.11 Line chart for quality ...39
Figure 4.12 Mean difference – Quality ...39
Figure 4.13 Mean difference – Quality ...40
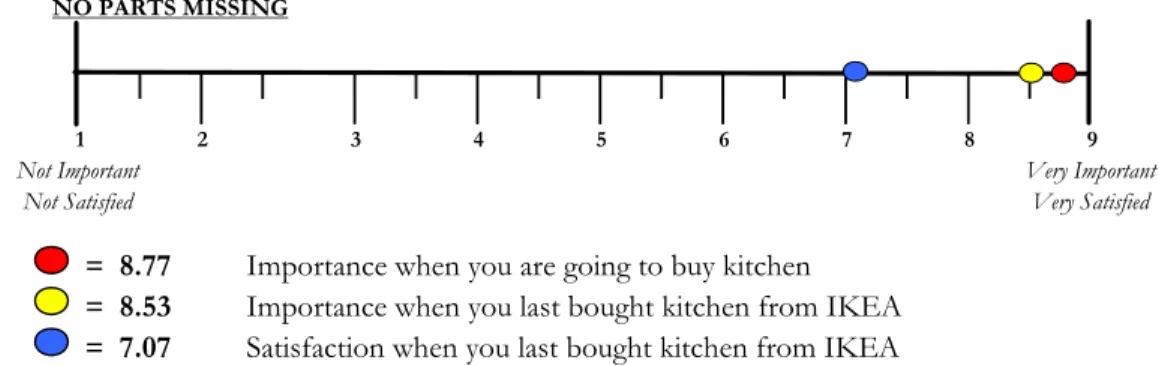
Figure 4.14 Line chart for no parts missing ...40
Figure 4.15 Mean difference – No parts missing...40
Figure 4.16 Mean difference – No parts missing...41
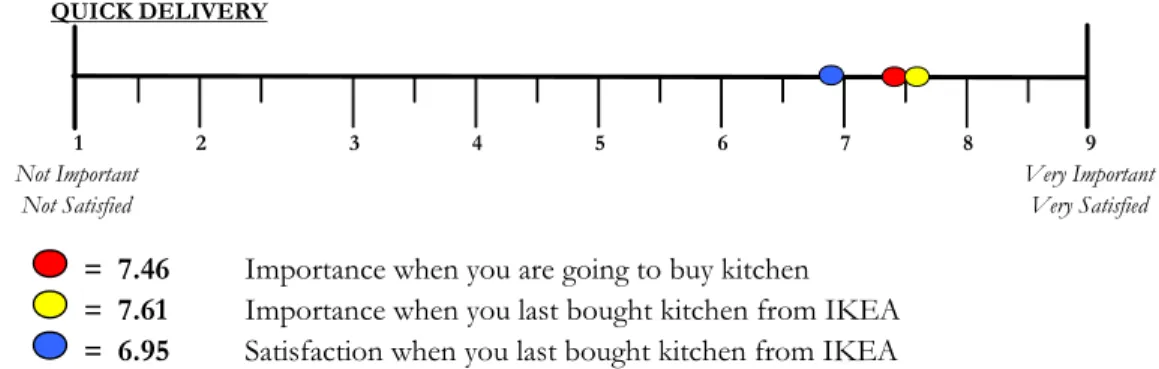
Figure 4.17 Line chart for quick delivery ...41
Figure 4.18 Mean difference – Quick delivery...42
Figure 4.19 Mean difference – Quick delivery...42
Figure 4.20 Line chart for just-in-time delivery ...42
Figure 4.21 Mean difference – Just-in-time delivery...43
Figure 4.22 Mean difference – Just-in-time delivery...43
Figure 4.23 Line chart for supplementary purchase ...43
Figure 4.24 Mean difference – Supplementary purchase...44
Figure 4.25 Mean difference – Supplementary purchase...44
Figure 4.26 Line chart for possibility to get a hold of spare parts ...44
Figure 4.27 Mean difference – possibility to get hold of spare parts ...45
Figure 4.28 Mean difference – possibility to get hold of spare parts ...45
Figure 4.29 Line chart for possibility to buy furnishing fittings ...45
Figure 4.30 Mean difference – Possibility to buy furnishing fittings ...46
Figure 4.31 Mean difference – Possibility to buy furnishing fittings ...46
Figure 4.32 Line chart for possibility to get assembled kitchen frames ...46
Figure 4.33 Mean difference – Possibility to get assembled kitchen frames ...47
Figure 4.34 Mean difference – Possibility to get assembled kitchen frames ...47
Figure 4.35 Line chart for possibility to get a fully assembled kitchen ...47
Figure 4.36 Mean difference – Possibility to get a fully assembled kitchen...48
Figure 4.37 Line chart for to plan kitchen on your own...48
Figure 4.38 Mean difference – To plan kitchen on your own...48
Figure 4.39 Mean difference – To plan kitchen on your own...49
Figure 4.40 Line chart for possibility to get help to plan the kitchen ...49
Figure 4.41 Mean difference – Possibility to get help to plan the kitchen ...49
Figure 4.42 Line chart for telephone contact with a business seller ...50
Figure 4.43 Mean difference – Telephone contact with a business seller ...50
Figure 4.44 Mean difference – Telephone contact with a business seller ...51
Figure 4.45 Line chart for business seller visiting the company ...51
Figure 4.46 Mean difference – Business seller visiting the company ...51
Figure 4.47 Mean difference – Business seller visiting the company ...52
Figure 4.48 Line chart for customer service ...52
Figure 4.49 Mean difference – Customer service ...52
Figure 4.50 Mean difference – Customer service ...53
Graphs
Graph 4.1 Company sizes of IKEA’s customers within the construction industry ...30 Graph 4.2 Percentage of the different respondent’s number of employees ...31 Graph 4.3 The sum of how the respondents get the information about IKEA’s products as
business customers ...32 Graph 4.4 The sum of how the respondents want to get information about IKEA’s products as
business customers ...32 Graph 4.5 Percentage of the total respondents of question 5a: Do you, as a business customer,
believe that IKEA’s service is better, about the same, or worse compared to other kitchen suppliers? ...33 Graph 4.6 Factors valued as most important ...53 Graph 5.1 Answer frequency in relation to IKEA’s market share of construction companies ...55
1 Introduction
This chapter introduces the reader to the concept of customer value. The introduction will start with a prob-lem background and will be followed by a research question and the purpose.
1.1 Problem
Background
During the 1980s companies started to focus more on customer service. This meant that they left the old transactional way of thinking, with the product in focus, and concentrated more on relationship thinking. Before, little emphasis had been adopted for customer ser-vice, but the relationship thinking, made the companies put more attention on customer contact and customer insight (Gentle, 2002). But, even if customer insight is seen as a key competitive asset, Stone, Bond and Foss (2004) point out that few companies understand what customers see, think and believe. Zeithaml, Bitner and Gremler (2005) also mean that many companies fail to focus on the customers and are usually trying to acquire new tomers, rather than view them as an asset they need to retain. By concentrating on new cus-tomers, companies try to bring the customers in, but not back. When customers choose another product and company it is, according to Gale (1994), because they believe they will get more value from the competitors. The company then has to find ways to deliver cus-tomer value in better ways that its competitors. Barnes (2000) means that managers have to realize that unless they create and regularly add value for their customers, they will have dif-ficulties to create reasons for the customer to stay.
Weinstein and Johnson (1999) say that customer value is an old concept. In early days buy-ers carefully evaluated the sellbuy-ers offerings, and Weinstein and Johnson (1999) mean that buyers agreed to do business only if the benefits (product received), were giving more value than the costs (items traded).
Barnes, (2000) claims that perceived customer value has been given many definitions in the marketing literature, but according to Zeithaml (1988, cited in Heinonen, 2004, p. 205) a traditional definition is
Customer value is the consumer's overall assessment of the utility of a product based on perceptions on what is received and what is given
This means, in reference to Heinonen (2004), that value is seen as the perceived benefits minus the perceived sacrifice. This is also stated by Zeithaml, Bitner, Gremler (2005), Kip-penberger (1998) and Evans (2002) who mean that value is the relationship between the give and take components. Customers buy when the received values, for example quality, satisfaction and specific benefits, are greater than the expenditures, which usually are monetary costs (Zeithaml, Bitner & Gremler, 2005).
Different customer segments perceive value in different ways. Customers combine various elements of the value proposition in order to define the value from their perspective. As a result, something that is considered valuable or an important element for one segment may not be considered valuable by another. Since value can be created in different ways, the companies have to understand what kind of value that are considered most important in their market segments (Barnes, 2000). This is the same reason why IKEA commissioned this thesis. IKEA wants to deliver more customer value among the constructing companies in the kitchen market, and by that become more competitive in the business sector (A.
Larsson, personal communication, 2005-09-09). Barnes (2000) says that it is important to identify the most important factors that deliver value, and therefore IKEA wants to deter-mine its business customers’ needs and wants (A. Larsson, personal communication, 2005-09-09).
IKEA is internationally known for their low price furniture, and their vision is to create a better day life for as many people as possible. They try to do that by offering a wide range of well-designed and functional home furnishing products at low prices (Inter IKEA Sys-tems B. V., 2003b). To be able to satisfy the differentiated demand optimally, IKEA pro-vide a large diversity of goods (Inter IKEA Systems B. V., 2003a).
According to A. Larsson (personal communication, 2005-09-09) it is crucial for companies to find factors that create value for their customers, and they need to realize that different customer segments have different value preferences. Wright (2004) points out that private customers and business customers have different preferences, and this is also something that A. Larsson (personal communication, 2005-09-09) says have been indicated at IKEA. In a business-to-business relationship, defined by Wright (2004), as a market where com-panies sell on to other comcom-panies for their own use, the main idea is, according to Kippen-berger (1998), to help the customers succeed in its business and create added value to the product.
IKEA has today more knowledge about their private customer market than the business market (A. Larsson, personal communication, 2005-09-09). Since the preferences are dif-ferent between private customers and business customers (Wright, 2004) and IKEA want to create more value for their business customers the following research question and pur-pose have been stated.
1.2 Research
Question
The following question will present the foundation of the purpose, and this will explore the relationship between the seller and the business customers.
What are the factors that IKEA’s business customers in the kitchen market perceive as cus-tomer value?
1.3 Purpose
The purpose of this thesis is to evaluate the factors that perceive customer value for IKEA’s business customers. Through the evaluation the most important factors for IKEA will be identified and ranked.
2 Method
This chapter will begin with an introduction. It will be followed by an explanation of the chosen method and the research approach. A description will also be given of how the market research was conducted.
2.1 Introduction
To be able to determine the factors that perceive customer value for IKEA’s business cus-tomers, the customers’ values have to be determined. Since IKEA wants to have deeper understanding about their customers’ opinions a market research was appropriate. A mar-keting research can regarding to Evans (2002) contribute with meaningful information about customers. This is also stated by Burns and Bush (2005), who continues to say that the information can be used in order to solve marketing problems such as determining price and how to advertise.
The American Marketing Association (AMA) definition of marketing research is:
Marketing research is the function that links consumer, customer, and public to the mar-keter through information – information used to identify and define marketing opportuni-ties and problems; generate, refine, and evaluate marketing performance; and improve the understanding of marketing as a process (Burns & Bush, 2005, p.7).
Hauge (2004) means that business-to-business marketing research employs the same re-search techniques as a marketing rere-search for private customer markets. The difference is that many business-to-business markets are characterized by a smaller sample because businesses often measure in hundreds or thousands instead of millions of customers. Busi-ness-to-business market samples are also often companies in different industries which vary in number of employees. This is also the case with IKEA, and since the interest is only for kitchen customers it is only customers within this segment that has been targeted. According to Burns and Bush (2005) marketing research can be used in four different ar-eas. First, identifying market opportunities and problems where the goal is to find oppor-tunities or problems with an existing strategy. Second, generating, refining and then evalu-ating potential marketing actions. This studies often deals with one or more of the market-ing-mix; price, promotion, product and place. Third, monitoring the marketing perform-ance. This allows a company that already has a marketing mix placed in the market to evaluate how well the mix is performing. The last area can be used to improve marketing as a process. This is conducted to expand the knowledge of marketing as a process rather than to solve a specific problem. By getting more knowledge from these studies the man-ager may be in better position to solve a specific problem within the company. In this case the marketing research will be used for the first area, to identify IKEA’s kitchen market opportunities for business customers and to examine the problems of the existing strategy that focus on the private customers.
2.2 Qualitative versus Quantitative Research
Hague (2004) means that if one should conduct a qualitative or a quantitative research de-pends on what you want to know, how you gather the needed information and how you want to conduct the research. A qualitative research is about investigating the features of a
market through in-depth studies or through focus groups. De Vaus (2002) describe further that the qualitative research methods involve participant observation and interviewing. De Vaus (2002) criticize the qualitative research method for lacking the ability to generalize and being too dependent on the subjective interpretations. Hague (2004) claims that a qualitative method with focus groups is not appropriate for a study with the intention of reaching a larger number of people. Instead, a quantitative research including a market re-search should be used in order to reach more people.
An investigation with a quantitative character is mostly composed by variables that can be statistically analyzed. The analysis is foremost concentrated on finding and confirming rela-tionships between different variables. A quantitative research is furthermore favorable when testing hypothesizes which results in practical improvements (Christensen, Anders-son, Engdahl, & Haglund, 2001).
In this study the purpose is to measure customers’ attitudes, and regarding to Hague (2004) a quantitative method is useful when measuring customer satisfaction, attitudes and com-mitment. Burns & Bush (2005) share Hague’s opinions and say that a quantitative research can be used to measure customer awareness and attitudes to different manufacturers and to understand the overall customer behavior in a market by taking a statistical sample of cus-tomers to understand the market as whole.
The quantitative research method is suitable for this study, since it provides certain types of factual and descriptive information, so called hard evidence. They can be expressed with numbers and can be statistically analyzed. The method is often regarded as providing rich data about the real life of people and situations, and being more able to understand behav-ior within its wider perspective (De Vaus, 2002).
In accordance with the discussion above, the aim is to use a quantitative research method, to be able to measure the customers’ attitudes and behaviors with help from a survey. The results will be statistically analyzed in order to find the factors that contribute to perceived customer value among the business customers in IKEA’s kitchen market. Since this study also intends to reach as many business customers as possible a quantitative research is more appropriate.
2.3 Data Collection Modes
All research methods require that there is data collected, analyzed, interpreted and pre-sented (Christensen et al., 2001). There are four basic survey modes that usually are used according to Burns and Bush (2005); person-administered surveys, computer-administered survey, mixed modes and self-administered survey.
A person-administered survey is one in which the interviewer reads questions, either face to face or over the telephone, to the respondent and record his or her answers. The draw-backs of using human interviewers are human errors, slowness and cost. The human errors are much more in a person-administered survey since it is easy to change the wording of the questions, which may change the meaning of the question (Burns & Bush, 2005).
In a computer-administered survey the computer technology plays an essential role. There are variations of computer-administered surveys. The most common is that the respondent answers the questions online on his or her computer, without an interviewer. High set-up costs and requirement of technical skills is the main disadvantages with a computer-administered survey (Burns & Bush, 2005).
Mixed-mode surveys use multiple data collection methods. One case of mixed-mode is when combined-assisted survey is used together with a personal-administrated survey. For example, since more and more people get access to the Internet, the online survey, a form of combined-assisted survey, is often combined with some other methods, such as tele-phone surveying (Burns & Bush, 2005).
A person-administered survey would be too time-consuming for this study and a com-puter-administered survey require a great amount of technical skills. A mixed mode seems to have many advantages, but a disadvantage is, according to Burns and Bush (2005), that it ads complexity to the data collection. For example, if a survey is conducted online and by telephone, the wording of the instructions must be different. Data from two sources can also be very difficult to code exactly the same way (Burns & Bush, 2005).
Self-administered survey, where respondents completes the surveys on their own (Burns & Bush, 2005), has been used in this study. The respondent reads the questions and responds directly on the questionnaire. The advantage with a self-administered survey is, according to Burns and Bush (2005) that the need for an interviewer and computer program are eliminated, and there can be savings in costs. Furthermore, the respondent can control the pace of which they respond and do not need to feel rushed. A respondent should feel re-laxed while responding, and a self-administered survey may help to affect that. Self-administered surveys also help the respondent to not feel nervous when answering ques-tions, or helping out if the topic may be sensitive, such as salary questions (Burns & Bush, 2005).
The disadvantages in a self-administered survey is that the prospective respondent have the control in his or her hand, which can result in that the respondent do not complete the survey, or answer the questions wrong regarding to misunderstanding because there are no opportunity to interact with the interviewer. There could also be a risk that the respondent will not send in the survey in time or refuse to return the survey at all (Burns & Bush, 2005). This is also confirmed by Christensen et al. (2001), who say that it can be problem with the time frame. In self-administered surveys there are higher questionnaire require-ments. Perfect and clear instructions need to be attached to the survey and the question-naire must encourage the respondent to continue answering until the questions are com-pleted (Burns & Bush, 2005). An introduction letter (Appendix 1) was sent out together with the questionnaire in order to give guidelines. The respondents also had the opportu-nity to call or e-mail those responsible for the questionnaire if there were any misunder-standing or questions about the survey. Christensen et al. (2001) mention that all questions must be seen from the respondents’ point of view, hence to reduce mistakes and misunder-standings. To handle this problem several persons tested the questionnaire. A meeting was set up with Nordiska Undersökningsgruppen, one of the largest marketing research com-panies in Scandinavia, in order to take advantage of their expertise in the field (A. Lindhe, personal communication 2005-10-28). The authors assume that this helped to exclude some misunderstanding and non-response that may have been otherwise. Anders Larsson, responsible for IKEA’s business customers in the kitchen market and the authors contact person at IKEA, also tested the questionnaire. Larsson also sent out the questionnaire to the management team at IKEA in order to find out if the questions needed to be changed.
2.3.1 Mail Surveys
In a mail survey the questions are according to Burns and Bush (2005) mailed out to pro-spective respondents, who are asked to fill them out and return them to the researcher by mail. This market survey was sent out to 818 of IKEA’s business customers on November 1st 2005. The deadline was set to November 22nd.
Burns and Bush (2005) mean that mail surveys are powerful, effective and efficient. Ac-cording to Christensen et al. (2001) another advantage of mail surveys is, compared to in-terviews, that the survey can reach a large geographical area without enormous costs. Since this survey was going to be sent out to companies all over Sweden, mail survey was appro-priate. Mail surveys are also good to use when questions about personal opinions are the focus of the investigation, since the respondent remain anonymous (Christensen et al., 2001).
Christensen et al. (2001) mean that the response frequency depends on the interest and en-gagement for the chosen subject among the respondents. The main issue is therefore to create a curiosity and engagement for the asked questions in the survey. It must be easy to understand and answer the questions. Furthermore, it is preferable if the numbers of ques-tions are limited, since too long surveys might reduce the response frequency. In addition it should not be too difficult for the respondent to send the survey back to the researcher, since then there will probably be problems with non-response. The respondents to this survey could easily send back the answers in a franked letter that were attached with the questionnaire.
2.3.2 Questionnaire Design
Christensen et al. (2001) claim that the purpose must be very clear before constructing a questionnaire. The questions for this questionnaire were constructed according to the structure of the theoretical framework in chapter 3.
When choosing the questionnaire design the researcher are, regarding to Burns and Bush (2005), facing several questions that needs to be considered.
First, in reference to Brace (2004) and Burns and Bush (2005), respondents who are not of interest for the study should be eliminated. This is important to identify as soon as possi-ble, so neither the respondent’s nor the interviewer’s times will be wasted. Examples of ex-clusion questions, presented by Brace (2004), are questions about the industry or profes-sion. This kind of question was not needed in this survey since the sample was only con-structing companies. Whenever business customer are mentioned in this thesis, it referes to the constructing companies. A clear exclusion question was placed in question 4 that asked if the respondents had bought kitchen from IKEA. If they have not bought any kitchen, the survey ended and these respondents were excluded.
Another type of exclusion question that Brace (2004) mentions, is company size. The rea-son for this question is to define the respondents’ sizes to see if one is over-represented. This kind of question is the first question in the questionnaire. The respondents can choose from pre-coded alternatives about the number of employees, according to Statistiska Cen-tralbyrån’s standard for company size classification (2005).
The main questions should first be general asked, as warm-ups, and later become more specific as said by Brace (2004), and Burns and Bush (2005). Furthermore, Brace (2004) states that it is hard to respond immediately to detailed questions. The warm-up questions
help the respondents to easier understand the subject, and recall what their perception is about the topics. In this thesis’ survey the warm-up questions are the general asked ques-tions in 2a-b, 3, 5a-c.
The survey then continues with two questions, 6 and 7, that are divided into three parts, a, b and c. First part, a, is a general question about the respondents perception when buying kitchen from any supplier. The second part, b, is the same question but asked specifically about the perception when buying kitchen from IKEA. Last, c, is a question about the sat-isfaction. These questions follow the pattern of going from general to more detailed ques-tions defined by Brace (2004). This scheme of quesques-tions allows the respondents to think about their behavior before getting into more details.
Question 8 and 9 are detailed questions, and has therefore been placed in the end of the survey. The last two questions, 10 and 11, are open-ended questions, giving the respon-dents the ability to answer more freely and detailed. These questions are good to place in the end, in order to give the option to the respondents to summarize their overall percep-tion of the survey and their perceppercep-tion of the topic (Proctor, 2003).
2.3.3 Sample Size
When doing a data collection the target group must be decided together with the sample size of the population. A total investigation, where all people in the population are taking place, is one possibility, but this is often too time-consuming and costly. This leads to that a sample is preferred (Christensen et al., 2001). Evans (2002) means that it is important to prioritize customers in the key markets, were the potential for gain is highest.
Of the business customers who buy kitchen from IKEA the constructing companies are the biggest and important segment. Since Burns and Busch (2005), Christensen et al. (2001) and Evans say that it is preferable to choose one segment of the population the construct-ing companies will be investigated in this thesis.
IKEA has a database which includes all their business customers. H. Gartner (personal communication, 2005-10-15), responsible for the database, says that 1636 constructing companies have, according to his information, bought kitchen units from IKEA. To be able to get a representative sample size, the authors asked IKEA’s management how many answers they found appropriate. They acquired response from 100 constructing companies and since it was difficult to tell how large the response was going to be, 50 percent of the 1636 constructing companies within the kitchen market were selected to ensure 100 an-swers. Furthermore, a large sample had to be selected because the target respondents are companies who have bought a whole kitchen. As mentioned in 2.3.2 the 1636 constructing companies, who have bought kitchen units, may not have bought a whole kitchen. The questionnaire was addressed to the contact person at each company. The information about the contact person was provided by H. Gartner (personal communication, 2005-10-15).
Random sampling, also called probability sampling method, has been used, which gives every member of the population an equal chance, or probability to be selected into the sample (Burns & Bush, 2005) According to Christensen et al. (2001) there must be some kind of database register of all members in the population to be able to use the probability sampling method. A database is also necessary to ensure that every person or unit have the same chance to be a part in the sample. IKEA has a large database over their business cus-tomers, and it was therefore no problem to use the probability sampling method.
Burns and Bush (2005) say that there are four different probability sampling methods; sim-ple random sampling, systematic sampling, cluster sampling and stratified sampling. When simple random sampling is used the researcher applies a random selection procedure which guarantees that each member of the population has an identical chance of being selected. In systematic sampling the researcher select a random selecting point for the first sample member. A constant skip interval is then used to select every other member. Cluster sam-pling means that the population is divided into clusters, where each cluster represents the whole population. The researcher then randomly selects a few clusters and performs a cen-sus on each one. If a population is believed to be skewed a stratified sampling is appropri-ate. A skewed population means that the population deviates a bit from what is assumed to be normal. Each subpopulation is called a stratum. When collecting the sample, random samples of each stratum is taken.
For this thesis simple random sampling or systematic sampling is most appropriate. Cluster sampling is regarding to Burns and Bush (2005) useful when there are no electronic data-base available. The kitchen customers in the constructing business are not, regarding to the authors, assumed to be skewed, and therefore stratified sampling was not used. The au-thors let H. Gartner (personal communication, 2005-10-15), responsible for IKEA’s data-base, choose if simple random sampling or systematic sampling were going to be used. The reason for letting him decide was because he knows how the database works. Furthermore, simple random sampling would work as well as systematic random sampling, and therefore H. Gartner could choose the one he found easiest to use. The sample where then selected with simple stratified sampling since this was, according to H. Gartner (personal communi-cation, 2005-10-15), least uncomplicated. Burns and Bush (2005) say that with simple stratified sampling the probability of being selected into the sample is known as equal for all members of the population. The sampling technique is expressed;
818 1636
= = 0,5
Probability of selection = Sample size Population size
This means that IKEA’s constructing companies had a 50% probability to be selected.
2.3.4 Questions
As mentioned before, the survey must be constructed after the purpose of the investigation (Christensen et al., 2001). The questions can be open-ended or categorical (Burns & Bush, 2005). The open-ended questions give the respondent a large freedom to answer with own words and formulations. According to Christensen et al. (2001) many people prefer the categorical surveys, since they have problems with expressing themselves in the open-ended method. In the categorical questions the respondent only answers due to all ready given statements. According to Burns and Bush (2005) the categorical response format questions provides pcoded response options on the questionnaire, which helps the re-spondent to answer easily and quickly. What is important with the categorical questions is that there have to be appropriate answers for all different opinions among the respondents. This can be difficult, according to Christensen et al. (2001), and therefore an additional an-swer is added. Burns and Bush (2005) call this complimentary open respond. Whatever fac-tor the respondents think are missing can be added in the additional question, called other, in this questionnaire.
Categorical response format questions have been preferred in this survey in view of the fact that Burns and Bush (2005) say that open-ended format questions are difficult to measure.
Christensen et al. (2001) say that it is difficult to measure because the respondents are asked to response in their own words, which do not make the question standardized. Since the sample is large the authors preferred a survey that was easy to measure. An open-ended questionnaire would have been too time-consuming to measure. However, since some questions could not be asked in a response format a few open-ended questions have been included in the questionnaire. Brace (2004) states that it can be good to mix these types of questions in order to maintain the involvement of the respondents. In reference to the guidelines presented by Brace (2004) the open-ended questions’ responses have been ana-lyzed by recording the responses word by word and then coding them into groups accord-ing to the similarities of the responses.
In a customer value approach of a survey there are some questions that will give the com-pany information about how people choose among competing suppliers. Those questions will show the relevance of the key factors, which are necessary and crucial for solving the problem that customers value, when they choose between the company and its competi-tors. An example of that could be to first ask a question that is generally formed, and then ask specifically what the customer feels about the specific company (Daniels, 2000), which is done in questions 6a-b and 7a-b in the questionnaire.
A discussion around the questions in Appendix 1 will follow. The original version, in Swedish, can be found in Appendix 2.
The questionnaire is written with the different factors of customer value, price, perform-ance and personalization, in mind. Since a small and a large company may have different preferences the authors found it appropriate to ask question 1 to determine the companys’ sizes.
The first main questions are for all respondents, since they deal with the overall informa-tion about the business-to-business relainforma-tionship, such as informainforma-tion exchange and the overall service from IKEA (question 2a, 2b and 3).
Question 4 asks if the company has bought kitchen from IKEA. If the answer is no, the survey ends. Since the participants in the survey might have bought some kitchen units or parts of a kitchen, there was a need for this question. There was only an interest to reach customers who have bought at least one whole kitchen from IKEA. There were 58.3% of the respondents who had bought kitchen and could continue the survey.
Question 5 is asked in order to determine if the business customers believe IKEA’s service to be better, worse or about the same compared to competitors. If the respondent an-swered either much better, better, worse or much worse they could answer an open-ended question, asking them why they believed the service to be much better/better or much worse/worse.
Question 6 has three different sections so there will be possibility to compare the different sections with each other. This will determine how well IKEA meets the requirements from the customers when they are buying one or many kitchens (questions 6b and 6c). The au-thors also want to measure if the preferences are different when buying a kitchen from IKEA or from other kitchen suppliers (questions 6a and 6b). Question 7 is constructed in a similar way since the authors want to see how the service satisfies the customers compared to what the customers find important (questions 7b and 7c). The importance of different factors’ are when buying from IKEA is also compared with the importance when the cus-tomers buy from other kitchen suppliers (questions 7a and 7b). A likert-scale from 1 to 9 is used in questions 6a, 6b, 7a and 7b, where 1 is not important and 9 is very important. In
questions 6c and 7c is 1 not satisfied and 9 very satisfied. Burns and Bush (2005) say that a likert-scale asks the respondent to indicate their degrees of agreement or disagreement on a symmetric agree-disagree scale for each of the series of statements.
Question 8 look for how the customers want to make their payments. This will indicate if the business customers want to make their payments differently than they do today. In question 9 the respondents have to choose which three factors are most important when buying kitchen. The respondent can choose between a variety of factors, representing price, performance and personalization. The valuation scale is most important, second most im-portant, and third most important.
The last two questions, 10 and 11, are open-ended questions, where the respondents can give suggestions to IKEA how they can become the optimal business partner. The respon-dents can as well give comments.
The questionnaire was three pages long, consisting of 11 questions. It was sent out on No-vember 1st 2005. IKEA’s required 100 answers, and since more than that was received dur-ing the first week, there was no need for reminders. The deadline was November 22ndand at this date there were 211 answers.
2.4 Trustworthiness
When developing an analysis, there must be validity to what are measured and what is sup-posed to be evaluated (De Vaus, 2002).
Measures need, according to De Vaus (2002), to be both valid and reliable. Although these two concepts are related they are not the same. A measure can be reliable without being valid and vice versa. Measures can never be perfectly reliable and perfectly valid, but the goal is to maximize them. It becomes the responsibility of the authors to critically review the work, in order to keep the trustworthiness of the conducted study.
Validity
It is of great importance to design the research so it can deliver the conclusions. The valid-ity of a measure depends on the definition of the concept that it is designed to measure. One of the problems in developing valid indicators is interpreting the meaning of respon-dents’ answers (De Vaus, 2001). Categorical answers are, according to Burns and Bush (2005), not as difficult to measure as open-ended questions. The open-ended questions have been documented word by word and then been coded into similar groups. All main questions are, however, in a categorical response format and the empirical findings are based upon these results.
Many factors, such as misunderstandings can damage the results (Burns & Bush, 2005). However, De Vaus (2002) mentions that the authors can increase the validity by being prepared. The authors should therefore test the survey before it is sent out. An introduc-tion letter (Appendix 1) was sent out together with the quesintroduc-tionnaire in order to increase the validity of the survey. The respondents had also the opportunity to call or e-mail the authors if there were any questions.
Internal validity is the extent to which the structure of a research questionnaire enables the researcher to draw conclusions from the results (De Vaus, 2001). The more the study method reduces optional explanations, the stronger the internal validity is. In this thesis
in-terpretations and comparisons can be made between the questions to create a base for the evaluation and the conclusion process of the customer value.
External validity refers to the extent to which results from one study can be generalized be-yond the particular study. The external validity is limited if the findings only applies on the people in that particular investigation. So the critical question is if the results are likely to apply more widely on other people not taking part in the survey (De Vaus, 2001). The ex-ternal validity can seem limited since the empirical finding is from one company’s business customers. However, the evaluation of the factors that contribute to customer value, is not specific for IKEA’s business customers in the kitchen market. The authors argue that the findings in this thesis are applicable also in other areas of interest, for example in business-to-business situations, or studies about customer value.
Reliability
Reliability means that the indicator consistently comes up with the same measurement, meaning that one research gives the same results when it is used on repeated occasions. This means if people consistently obtained the same score on repeated tests, the test would be reliable (De Vaus, 2002). Reliability also considers the evaluation method’s ability to control random errors (Christensen et al., 2001). Among the respondents of the survey it has been found that there are not any relevant numbers of outliers. Therefore, the authors claim that the responses are reliable in accordance with the discussion above.
Unreliability can arise from many different sources. A question may for example be unreli-able due to bad wording. A person may understand the question differently on different occasions (De Vaus, 2002). Also, asking questions about topics, which people have no opinion of, have insufficient information, or require too precise answers, are leading to un-reliable data (De Vaus, 2001).
The questions; to get a fully assembled kitchen from IKEA, and to get help from IKEA to plan the kitchen/-s, were incorrectly phrased in the questionnaire. The questions were sup-posed to ask how important these factors were when they buy kitchen from any kitchen supplier. However, the answer indicated, that the customer can get a fully assembled kitchen or help from IKEA. This is incorrect since the answer should have indicated that they could get a fully assembled kitchen or help from any supplier. These questions have not been presented in the empirical findings or taken into consideration in the results. The authors still believe that the results are sufficient and reliable since it was only 2 of 48 ques-tions in question 6a-c and 7a-c that had to be deleted.
In conclusion, after considering these different statements regarding trustworthiness, the authors find the survey valid and reliable for this study.
3 Frame
of
Reference
This chapter will present the theories that underline the research. The frame of reference begins with a de-scription of business-to-business relationship. Further, customer value and its main factors will be discussed.
3.1 Business-to-Business Relationship
According to Erztgaard (2004) the basic principle of a business-to-business relationship is that two companies create higher value together than they would do on their own. Building interactions for the future with recurrent transactions, with a high importance of trust and satisfied expectations, are the main factors behind why business-to-business relationships are built.
A business-to-business market is defined by Wright (2004) as a market where companies sell and market products, or where companies sell on to other companies for their own use. The difference from customer markets is that the end customer in business-to-business market is buying products and services for their company, rather than for individ-ual or private use. The company can then use them (1) for their own usage when making products or services, such as machines, (2) for selling on to other customers as an end product, or (3) as parts of their own products or services (Norrbom, 1999). Business-to-business selling situations are, as mentioned, different from consumer selling in many ways. In business-to-business markets, sellers spend time building and nurturing the personal and business relationship with several individuals throughout the buying center (Giglierano & Vitale, 2002).
Most companies, according to Newell (2000), think a satisfied customer is exactly the same as a loyal customer. This might have been true way back in time, but not any longer. In a business-to-business relationship the main focus should be finding the motive of the cus-tomer and by that, help it to succeed in its business and create added value (Kippenberger, 1998). Therefore, business customers demand different marketing strategies than private customers. Those who adapt their marketing strategies specifically towards the business customers will be more successful in terms of sales and commission, and by that get higher satisfaction from the customers (Wright, 2004).
According to Erztgaard (2004) constructive criticism, long-term thinking, creation of common goals, openness, customer focus, understanding and respect are examples of fac-tors behind a valuable business-to-business relationship. Since the relationship between businesses is more complex, Wright (2004) says that it is much more important to under-stand the structure of the customers and their operational way of doing business in a busi-ness-to-business market than in a business-to-consumer market. A lasting relationship is considered to be dependent on three variables; power, dependence and trust (Seyed-Mohamed, 1990). The need to know and understand the customers will be important for the whole value chain, so the company can be able to create a competitive advantage as an essential part in the creation of the end product (Wright, 2004).
In order to define how the selling process is done, one needs to look from the buying company’s perspective. The purchasing process can be different in different types of busi-nesses. When companies choose their suppliers they can for example decide upon (1) rec-ommendations from other businesses or associations, (2) by asking a number of suppliers to submit a product or service specification, specifically made for them that can give an idea of which supplier is the best, (3) by letting outside agencies help to choose the best, or
(4) let the managers’ experience and intuition decide which supplier is the best. A buying company can combine these when choosing in order to optimize the result they want (Wright, 2004).
When the customer value is specified the selling company can try to become better in these areas and after that try to emphasize them during marketing of their products or services. However, to maintain the competitive advantage the selling company needs to be able to offer even more sophisticated benefits in the future. The process, therefore, needs to be seen as a process of constantly adding value in response to the change of demands (Wright, 2004).
3.2 Customer
Value
Naumann (1995) states that the environment today in which businesses operates is more turbulent, chaotic and rapidly changing than ever before. Customers often have the charac-teristics of being less tolerant, less forgiving and less loyal, and their product expectations are often soaring to ever higher levels. Daniels (2000) continues to say that during the be-ginning of the 1990s, there was a quality revolution, where more companies started to pay more attention to better customer care. However, the level of customer satisfaction does not seem to be higher now than before the quality thinking started. According to Evans (2002) this could, nonetheless, still mean that the customer care has been improved, since raising the quality can increase the expectation levels. That will lead to people asking for more customer care and again companies has to strive for an even better result.
But the purpose of creating satisfied customers is no longer enough. The business also needs to get closer to the customers, to create relationships, where the customers see a value in the collaboration (Barnes, 2000). It is like this, since satisfaction is an outcome, and not something you do in the business. And because of that, today’s satisfied customers might switch to the competitors tomorrow, if they offer them better value (Mittal & Sheth, 2001). But there are no simple series of steps that will create customer value. Maximizing customer value must flow from a firm’s culture, beliefs, values, management style and structure (Naumann, 1995).
Value is defined as the ratio of perceived benefit to perceived cost (Evans, 2002). Customer value extends this definition to value related to what the customer has perceived the value to be. Customer value can be acknowledged through finding ways of getting inside the cus-tomer’s perception of value (Kippenberger, 1998). So the critical elements are to look after the value that is offered to the customers, and to be able to be ahead of the competitors (Mittal & Sheth, 2001). Customer value comes from preferences, characterized from ex-perience of interacting with some other objects (Barnes, 2000). Designing and delivering superior customer value are according to Weinstein and Johnson (1999) the keys to suc-cessful business strategies.
The customers’ ability to attain the desired value goals is determined by the consequences of the product use. The consequences are ...the outcomes that are experienced by the consumer as a
result of product us” (Woodruff & Gardial, 1996, p. 56). The customers will try to seek the
consequences that are linked to the desired goal and also try to avoid those that are not. Consequences can be both positive and negative. It is a positive consequence when the customers get the desired outcome, or benefit from the product or service (Woodruff & Gardial, 1996).
According to Woodruff and Gardial (1996) the value, considered as the result of the trade-off between the positive and negative consequences of product use, is perceived by the customer. For example when buying home furnishing, customers normally pay a price and expect that the seller in turn will provide offsetting benefits such as assembly, delivery and the possibility to see the furniture displayed in the shops where the customers can get help from the salespeople.
A furniture company that created a strategic opportunity is IKEA. IKEA considered the cost-benefit trade-off for its customers. While maintaining certain standards of quality, IKEA has encouraged its customers to buy furniture with minimal assistance. The custom-ers have to assemble the furniture themselves and transport it to their homes by themselves in exchange for a lower priced product (Woodruff & Gardial, 1996).
Value is created through three different ways of experience. It is comparative, meaning that it involves rating one option against another (Barnes, 2000). Value judgments by customers about the worth and desirability of the product are made relative to competitive substitutes, satisfying the same needs (Weinstein & Johnson, 1999). Moreover, it is personal; the cus-tomer value differs across individual cuscus-tomers or segments of cuscus-tomers (Barnes, 2000). The way of thinking must be around the whole service offering from the company, not only the product itself. Customer groups, such as business customers, have common needs that the company can satisfy and from that create economies of scale. However, individual needs also have to be satisfied, and that calls for creating tailor-made solutions (Kippen-berger, 1998). Finally, customer value is situational. It means that the value varies widely from situation to situation. Value is a predictor of which choice the customer will make. Buyers who are considering a purchase in a particular product or service category will scan their options and develop considerations about what will bring them the highest value (Barnes, 2000).
Different Preferences of Customer Value
Barnes (2000) says that different segments of customers perceive value in different ways. To fully understand the customers’ needs, the situation must be viewed from their perspec-tive. One segment of customers combines their preferences in one way, resulting in values from their own viewpoint. As a consequence, those valuations that are considered might be very important for this segment but might not be valuable for another. Value may be per-ceived in different ways, and it is critical that marketers understand what forms of value that are considered most important in the segment where the company operates.
According to Rachham (1999) customers can be segmented into three distinct types; intrin-sic value customers, extrinintrin-sic value customers, and strategic value customers. These types are regarding to what the customers prefer most.
Intrinsic value customers focus exclusively on the price. They generally already understand the product well and they know how they want to use it. The intrinsic customer sees the product as a commodity that is substitutable with competitive offerings. They want to buy the product at a favorable cost, and since the only value is the product they care little or nothing about added value such as sales force. The typical intrinsic customers are suppliers or the bottom-line purchasing agents who buy raw materials. However, the purchasing world is dramatically changing and intrinsic value customers are not only in industries that usually are associated with commodities. An increasing number of customers buy specialist products that have an instrinsic value orientation (Rachham, 1999).
Extrinsic value customers focus largely on the benefits, and are interested in solutions and applications. The sales force is important for the extrinsic customers since they can create a great deal of new value for them. Unlike the intrinsic value customers, the extrinsic value customers see value in spending time with salespeople and high performance quality (Rachham, 1999).
The strategic value customers demand an extraordinary level of value creation and want more than the supplier’s products, or its advice. These customers long for the supplier’s core competencies. The relationship between the supplier and the consumer is equal and they are working together to create an extraordinary level of new value that neither of them could create alone (Rachham, 1999).
Three variables will in this thesis be explained as the main factors behind customer value. Those three variables are price, performance and personalization.
Price, Performance and Personalization
Mittal and Sheth (2001) suggest that the basics for creating values that customers seek are; price, performance and personalization. This suggestion confirms Rachham’s (1999) ap-proach of the three different customers segment presented in chapter 3.2. Also, Weinstein and Johnson (1999) notes that this combined triad of price, performance and personaliza-tion provides a solid springboard for formulating business strategies to create customer value. According to Naumann (1995) the customer value triad applies to virtually every type of business.
Naumann (1995) claims that the most important success factor for a company is the ability to deliver better customer value than the competition. Good customer value can be achieved when the prices, the product performance and the personalization are in harmony and exceed customer expectations. Only delivering one of the components will never guar-antee survival in the market. Having for example great performance and poor personaliza-tion will not maximize the customer value. One goal of a business should be to maximize customer value and strive to increase value continuously.
In reference to the discussion above; this means that the critical elements may lie within the three parts of customer value shown in Figure 3.5; price, performance and personalization.
Figure 3.1 Three parts of customer value PERSONALIZATION
PERFORMANCE
CUSTOMER VALUE
3.2.1 Price
Giglierano and Vitale (2002) claims that price is an indicator of the value of the offering which according to Holbrook (1999) is the perception of benefits received for what the customers must give up. In other words, this statement means what one gets for the money. Regarding to Woodruff and Gardial (1996) price is the variable that is most fre-quently associated with value because value is often defined from an economic perspective, as the monetary cost associated with exchange.
Giglierano & Vitale (2002) continues to say that when customers looks at the price of the product they usually ask three general questions; “Are the benefits worth the price being charged?”, “Can we obtain the same benefits for a better price?” and “Can we obtain the same benefits at a lower cost by producing them ourselves?” If the customer has a budget concern, an additional question will be asked; “Can we pay the price?”
Kenyon (1997) means that when customers say that something is a good value, they do not indicate that it is the lowest price that possibly could be found. What the customers mean is that the product or service is worth the price paid. A little bit extra for the same price, is a concept that defines the central idea of value. According to Giglierano & Vitale (2002) the company should set the price so that customer cannot obtain more value from other supplier’s offerings. Also, as market conditions change, the company may have to change prices for existing offerings to maintain or improve the attractiveness of the good. To un-derstand a customer’s perception of value, including the perception of price, the company needs to understand the customer’s own cost thinking.
Customers have to be attracted to a new product before considering price. When a cus-tomer’s interest is aroused, interest shifts to what must be given up in return. Reaction to price is depending on which interest in the product that already has been aroused (O’Shaughnessy, 1987). The comparison process, when comparing prices, is an inherently subjective process because customers typically have a zone of indifference where they may not be sensitive to price changes or differences (Naumann, 1995).
Naumann (1995) stretches the importance of remembering that the competitor with the lowest prices is not always the market leader and reducing price is not the most attractive form of value creation. First, it is the most easily copied strategy. Competitors can usually drop their prices just as quickly as we can. Second, the company often ends up leaving money on the table, because customers are in fact often ready and willing to pay more if they only get the quality they want. Third, if a practice of discounting, with any degree of predictability is used, some customers will simply wait for the discount sales and never pay full price if they can avoid it (Barnes, 2000). Finally, buyers also use the price as an indica-tor of performance. That is, all things being equal, the higher the price, the higher the per-ceived quality. However, customer value assessments are often comparative. Value judg-ments by consumers about the worth and desirability of the product are made relative to competitive substitutes, satisfying the same needs (Weinstein & Johnson, 1999).
There are two essential competitive forces when setting prices within a company. Firstly, the corporate goals for profitability suggest that companies should charge higher prices for their products and services to maximize long-term shareholder wealth (Naumann, 1995). However, whenever a company charges more than its competitors for its product, the company must signal value differences equivalent to the price difference (O’Shaughnessy, 1987). Secondly, the competition provides a constraint, a ceiling on prices, which gets lower and lower as global competition intensifies. The winner in the market place will
therefore be the company that maximizes delivered value to the customers (Naumann, 1995).
The discussion above show that price is an important variable itself. However, the discus-sion also leads to two smaller variables of price: price-quantity discount, and time (Figure 3.2). These two will be presented in the following part.
Figure 3.2 Two parts of price
Price-Quantity Discount
Often when a buyer wants to buy a larger quantity than normal it can be offered a reduc-tion in the price, this is called price-quantity discount. A price-quantity discount strategy, which is a fundamental price strategy (Weng, 1995), is very common in the business-to-business market, since big companies often buy large quantities of a products (Gupta & Kini, 1995). Buying a larger quantity gives more power to the buying company, because it can threat the selling company of buying from another company if they do not receive any price-quantity discount (Gupta & Kini, 1995). Simon and Dolan (1998) say that since the underlying principle for price-quantity discount is that the second, third and so one, units have lower per-unit costs, the company should therefore focus on getting the customers to buy the first product. However, that constitutes that the seller knows exactly how the will-ingness to pay among the customers is distributed. This leads to the perception of what the customers seek in the products, relating to the performance.
There are many types of price-quantity discount; incremental discount, all-unit discount, volume discount over a period of time, and discount on the invoice-value. The incremental discount involves that the seller offers a reduction in price per unit over a specified quan-tity. The all-unit discount means that all units over a specified quantity are sold at a reduced price. The volume discount over a period of time signifies by that the buyer has to buy a certain quantity during a specified period of time to get the discount. The last type, dis-count on the invoice-value, involves that the buyer can get a disdis-count if the value of the to-tal purchase in a single transaction exceeds a certain financial value (Gupta & Kini, 1995). According to Gupta and Kini (1995) the reason why a company offers price-quantity dis-count can, for example, be to stimulate the demand of the product, to off load excess pro-duction and off season stocks, or do it because the competitors is offering it. This shows that price-quantity discount can both be a regular strategy for the business or just a tempo-rary strategy. Furthermore, a company can offer a price-quantity discount to trigger the sales in order to get buyers to see their products and services in the beginning or when business is going slow. However, the main issue about price-quantity discount, stated by Simon & Dolan (1995), is that it can generate a profit closer to the maximum profit possi-ble by attracting more buyers. They also point out that, when starting to offer
price-PRICE-QUANTITY DISCOUNT
TIME
quantity discount, the competitive reaction should be carefully predicted and observed. For example, if the competitors try to match the price-quantity discount with a better price all the time.
Seeing price-quantity from the buyer’s perspective, the buyer needs to choose an order quantity that minimizes the operating costs, such as purchasing, ordering, and inventory holding costs. Price-quantity discount can minimize these costs, which makes the buyer look for those suppliers who give best price-quantity discount (Weng, 1995).
Time
In the price perspective Becker (1965, cited in Holbrook 1998) treats time as if it was money. O’Shaughnessy (1987) says that for companies ‘time is money’ and that business customers budget their time as well as their money. They seek to spend their time wisely and companies try to minimize the cost of time since it enhances the value of the offering Customers can spend time to acquire a product, for example, when waiting in line at a ticket counter. Time can be wasted in situations in which we spend more time waiting or doing something than we feel should have been necessary. A company can also buy time, for example, if they invest in a new product designed to save time for the company. (Hol-brook, 1998).
Griffin (2001) claims that we have become the “hurry-up” society as a result of such in-stant tools such as e-mail, faxes, and mobile phones. Speed has become one of the most important and visible areas of the price factor. Many customers get irritated with time-wasters such as slow-moving cash register lines, ill-fitting merchandise, and products that have to be returned, which are a waste of time and money.
Holbrook (1998) say that time is a resource and the value of the time that is being saved is a function of what is done with it. It is the same with money, for example, people do not mainly derive utility from having a lot of money but from what they do with it. The exam-ple can also be applied to time where peoexam-ple do not derive utility from having a lot of time but from how they spend that time. However, there is a major difference between time and other price factors, such as money. For example, if the taxi to the airport costs $20 more than expected, this loss can be dealt with by reducing consumption elsewhere, but if the ride to the airport takes an hour more time than expected, the hour may be difficult to re-coup.
Benakiva and Lerman (1985, cited in Holbrook, 1998) mean that people get more upset of a minute delay when they wait at the bus stop, than a minute spent waiting inside the bus. Moreover, the time spent in a queue at fast food restaurants (the time spent between enter-ing the queue and beenter-ing able to order) have a stronger impact on the customer than service time (the time spent between ordering and receiving the order). However, Holbrook (1998) claims that the value of time is personal and varies from one individual to another. Some people feel that they are under constant time pressure and frequently think about time. As a result, it is likely that they would assign a much higher value to time saved. Others would instead place higher value on schedules and promptness.