Department of Plant Biology
Evolutionary History and Local Adaptation in
Scottish Populations of Populus tremula
Jonathan R. Wilson
Evolutionary History and Local Adaptation in Scottish
Populations of Populus tremula
Jonathan R. Wilson
Supervisor: Pär Ingvarsson, Swedish University of Agricultural Sciences, Department of Plant Biology
Assistant supervisor: Martha Rendon, Swedish University of Agricultural Sciences, Department of Plant Biology
Examiner: Ann-Christin Rönnberg Wästljung, Swedish University of Agricultural Sciences, Department of Plant Biology
Credits: 45 credits
Level: Second cycle, A2E
Course title: Independent Project in Biology - Masters Thesis
Course code: EX0596
Programme/education: Genetic and Molecular Plant Science
Course coordinating department: Department of Plant Biology
Place of publication: Uppsala
Year of publication: 2019
Cover Picture: scottishaspen.org.uk – Coille Alba Online publication: https://stud.epsilon.slu.se
Keywords: local adaptation, population structure, selective sweep, synteny
From a subset of P. tremula samples taken from across Europe and China, principal component analysis of genetic variation indicated population structure in the Scottish population compared with the rest of Eurasia. In light of this, the Scottish population was subjected to a genome-wide scan for differential regions by calculating FST and scanning for selective sweeps, using iSAFE and Tajima's
D. Two possible selective sweeps located on chromosomes 4 and 14 were identified. Further analysis of these sweep regions, using identity-by-state calculations, indicated particular clusters within the Scottish population, associated to distinct geographic locations within Scotland. This indicated local adaptation was acting upon particular individuals in particular regions of Scotland, as opposed to all Scottish populations. The use of identity-by-state and iSAFE together outlines a method by which unfixed selective sweeps can be detected. A number of genes located near the selective sweep region were identified, including the WRKY3 transcription factor, which has been shown to affect radial stem growth in Populus tomentosa. These selection for these genes and its effect on neighbouring regions of the genome may be contributing to local adaptation within the Scottish P. tremula population. WRKY3 was also present in a region of chromosome 17, yet signatures of the selective sweep on chromosome 4 were not shared with chromosome 17. This is an example differential evolutionary processes affecting paralogous genes within the same genome, providing a unique insight into the evolutionary history of the P. tremula genome.
Keywords: Local adaptation, population structure, selective sweep, synteny
Abstract
The Aspen quakes… but does its genome?
When the wind sweeps across the forests and woodlands of Europe, the rustling noises and the sight of Aspen trees quaking and trembling in the slightest breeze is familiar to all who live there. But as we learn more and more about tree biology and genomics, it is becoming increasingly clear that, as an individual tree quakes in the wind, so too does the entire genome of the species when brushed by the winds of evolutionary time, as genetic variation changes over time. One such population that has experienced this more than most is the Scottish population of European Aspen.
First of all, we noticed that particular genomic signals within this populations of trees in Scotland indicated that it was the last ice age that drove this population apart from those in the rest of Europe. As the ice melted, and the trees began to return to Northern Europe, the ancestors of the Scottish population spread throughout the British Isles mainly through the use of clonal propagation. This may have helped in the colonisation of new lands, but the clonal consequences can be detected in the population still today.
As these trees reached Scotland, natural selection will have acted upon trees best suited to growing in the local conditions, in a process known as local adaptation. The Scottish environment is famous (or perhaps infamous) for its roughness, with cold mountainous regions in the Highlands, down to windswept rocky coastlines, inundated with sea salt. As with all other species, the Scottish Aspen populations have adapted to the unique and variable environments of Scotland. Using a number of new software, regions of the genome were identified as those being selected for in very particular environments in Scotland, with some genes being selected in coastline areas, and some in the mountains. Furthermore, one particular region associated to individuals in heathland and coastal areas was identified as causing
sturdier trunks, thus contributing to the survival of these individuals in adverse conditions.
Under the harsh easterly winds coming across the Atlantic Ocean and towards Scotland, not only does this cause the Aspen to quake vigorously in the gales, this quaking reaches right down into the heart of the genome itself, as variation sways backwards and forth.
“My aspens dear, whose airy cages quelled, quelled or quenched in leaves of leaping sun,
all felled, felled, are all felled; Of a fresh and following folded rank,
Not spared, not one.”
1 Introduction 6
2 Materials and Methods 10
2.1 Sampling and populations 10
2.2 Filtering 10
2.3 Population Structure 11
2.4 Population Genetic Statistics Estimation 12
2.5 Sweep Detection 12
2.6 Population Demographics 13
2.7 Clustering Analysis of Sweep Regions 13
2.8 Detection of Synteny 13
2.9 Gene Identification 14
3 Results 15
3.1 Population structure and initial genome-wide analysis 15 3.2 Demographic history of P. tremula populations throughout Eurasia 18 3.3 Detection of selective sweeps 20 3.4 Analysis of Scottish sub-populations 22 3.5 Identification of genes within selective sweep regions 27 3.6 Relationship between syntenic chromosomes 29
4 Discussion 34 5 Conclusions 43 6 Future Perspectives 45 References 46 Acknowledgements 51 Supplementary Figures 52
Table of Contents
Local adaptation, the means by which populations of a species genetically adjust to local environments, is a powerful process of evolution. Especially in species that can tolerate a broad range of climates, genetic variants that facilitate better growth and success in particular environments are often highly represented in the populations inhabiting these environments. Local adaptation can be one of the foremost major role players leading up to speciation (Kirkpatrick & Barton, 2005), as if adaptation occurs in progressively more regions of the genome in one population, alongside limited gene flow, the result can be species divergence. In many populations, local adaptation often occurs in particular environments alongside other genetic processes. When coupled with lower gene flow between populations of the same species, local adaptation can become intrinsically linked to population structure. Population structure describes the distribution of variation between members of the same species. Genetic variation is more likely to be shared within a population, as opposed to between populations. The causes of population structure can be difficult to discern, with causes being heavy genome-wide selection, inhibited gene flow followed by fixation of alleles by genetic drift, or a combination of both processes (Wang & Bradford, 2014). Even so, the presence of population structure is often a good indicator that local adaptation has occurred within a population. As such, population structure often follows geographic gradients when gene flow is more common between members of the same population than with others. The relationship between geography and population structure is well studied, occurring in a wide range of
species, from the malaria parasite Plasmodium vivax (Joy et al., 2008) to
Arabidopsis (Long et al., 2013).
A major genetic process contributing to local adaptation in many populations is that of selective sweeps. Selective sweeps describe the loss of genetic variation in the neighbouring regions of a newly adaptive allele or mutation, as selection drives this locus to fixation (Smith & Haigh, 1974; Kaplan et al., 1989). Selective sweeps generally fall into two categories; hard sweeps and soft sweeps. Hard sweeps are the result of positive selection acting upon a new mutation before divergence of lineages, thus the same variation in neighbouring haplotypes is driven alongside the adaptive allele. Conversely, a soft sweep occurs when a divergence of lineages occurs before the onset of positive selection, meaning that after adaptive mutations arise in each lineage, the haplotypes hitchhiking through positive selection may differ for each lineage. As well as arising from new mutations, selective sweeps can act upon standing variation, if adaptive variants had previously been present in the population at very low frequencies (Messer & Petrov, 2013). The extra variation present in some soft sweeps can result in less efficient detection using summary statistics such as Tajima’s D, as this extra variation is more difficult to sort from prior standing variation that would exist had the sweep not taken place (Hermisson & Pennings, 2017).
These mechanisms of population genetics are best demonstrated in widely distributed species with dynamic population histories, as it gives the chance for different forms of local adaptation to impact populations in different regions. One tree species that fits these criteria is the European Aspen, Populus tremula. A widely distributed angiosperm tree species, it inhabits a large area across both the European and Asian continents (Eckenwalder, 1996). Furthermore, its close American relative, Populus tremuloides, inhabits similar latitudes on the American continent, with divergence between the two species having taken place 2-3 million years ago, following the formation of the Bering Strait (Wang et al., 2016). Together, these two species inhabit most land areas within the northern hemisphere. Its role in many
ecosystems is that of a primary coloniser for forests, growing quickly compared to many species of tree and being able to cover a large scale of latitudes and altitudes (Worrell, 1995). Due to its ability to inhabit such a wide range of environments, it is likely that local adaptation has affected many populations of P. tremula throughout the Eurasian continent, with populations adjusting on a genetic level to warmer or colder temperatures, mountainous regions or coastal climates.
The P. tremula genome contains 19 chromosomes, and with a genome size of 480Mb, it remains a relatively small genome to study compared to other tree species. Before radiation of all members of the Populus genus, an ancestor of these species underwent a whole genome duplication event (WGD) that occurred 60-65 Mya, as discovered upon the sequencing and assembly of the Populus trichocarpa genome (Tuskan et al., 2005). Gene duplication has long been known to facilitate more rapid evolution through the processes of sub- and neo-functionalisation (Moore & Purgganan, 2003). The presence of paralogous genes due to the WGD event has resulted in the conservation of synteny across many regions of the P. tremula genome. This may provide the evolutionary flexibility for further selection to take place on particular genes, thus allowing local adaptation to take place with more ease. It is possible the genetic ‘backup’ provided by numerous duplicate genes may allow selective sweeps to take place, whilst conserving the original function in a separate copy.
Such an example is given by the variation of P. tremula along a north-south gradient, particularly on the Scandinavian peninsula. Geography from north to south in Europe differs clearly in terms of temperature and daylength. Throughout populations from the Scandinavian peninsula, variants of the PtFT2 gene, involved in the timing of bud set, were shown to be associated with northern and southern populations. A selective sweep targeting this locus in northern populations shows its influence on local adaptation, and the importance of this region in the adaptation to regions with a radically different daylength and temperature (Wang et al., 2018). Furthermore, admixture within Swedish populations between eastern populations
(Russia) and western populations (Scotland) show likeliness that colonisation of the Scandinavian peninsula took place from both its southern and northern ends following the recession of the last glacial maximum (LGM) (De Carvalho et al., 2010).
Due to understanding of the colonisation history of P. tremula within the Scandinavian peninsula, and its behaviour along a north-south gradient, the natural progression for further analyses was to investigate the evolutionary history along an east-west gradient. With whole genome resequencing data from the westernmost population in our sample collection, Scotland, genomic comparisons were used to infer migration of P. tremula to the British Isles, and the role that local adaptation had played in the colonisation of this region. Prior analyses of the Scottish P. tremula indicated distinct population structure with regards to populations in the rest of Eurasia. To analyse local adaptation in Scotland and differences to the rest of Eurasia, methods such as calculation of Tajima’s D (Tajima, 1989) and iSAFE (Akbari et al., 2018) were used to detect selective sweeps present in the genome of the Scottish population. Further analysis of these sweep regions was performed by identity-by-state clustering, to determine whether selective sweeps affected the entire population, or whether these signals were refined to particular areas or individuals within the population. Lastly, selective sweep signals could be compared across the genome with their syntenic counterparts, thus allowing further understanding the role of duplicated genes in facilitating local adaptation.
2.1 Sampling and populations
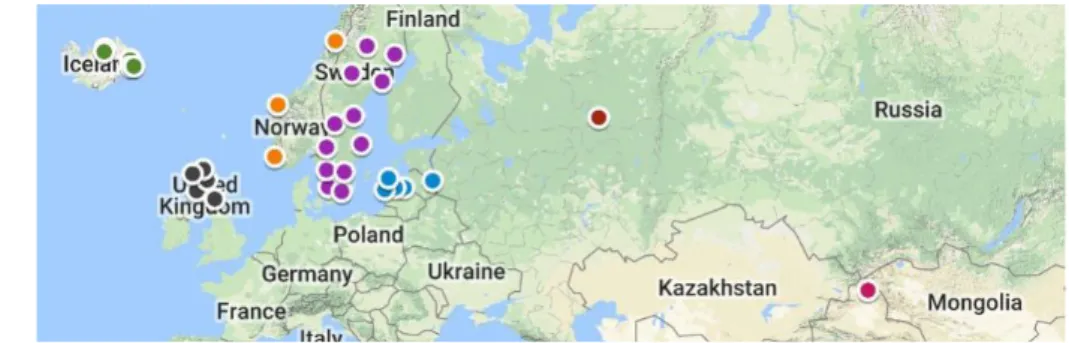
Samples were obtained from populations throughout Eurasia ranging from Scotland through to China. 140 samples from Scotland were obtained, alongside 10 samples from each population in Norway, Sweden, Latvia and Russia respectively. A further 4 samples were taken from China. Specific locations of sampling regions are indicated in Figure 1A. These samples were then re-sequenced, mapped against the reference genome of P. tremula v2.1 (anchored chromosomes), called for single nucleotide polymorphisms (SNPs) and provided in the form of variant call format (.vcf) files, one for each of the 19 chromosomes of Populus tremula.
2.2 Filtering
Before analysis was performed, the .vcf files were filtered using a number of criteria. Initially, hybrid individuals within the dataset were removed. The software NGSadmix v32 (Skotte et al., 2013) was used to discover any hybridisation within the P. tremula dataset with any other closely related species,
Populus alba and Populus tremuloides (Supplementary Figure 1). Further
filtering of individuals was performed based of identity-by-descent (IBD). Individuals crossing a threshold of IBD score 0.2 were removed from further
analysis. A histogram showing individuals over 0.2 is shown in Supplementary Figure 1B. Linkage disequilibrium (LD) pruning was performed prior to principal component analysis (PCA) on the dataset using PLINK v1.9 (Chang
et al., 2015), removing one SNP from pairs with r2 > 0.2. Non-polymorphic sites
were removed from the dataset using bcftools v1.8. No initial filtering was performed for minor allele frequency (MAF), though MAF filtering was performed in various analyses, as indicated below.
2.3 Population Structure
Initial analysis of population structure was performed using both PLINK v1.9 and the R package SNPRelate (Zheng et al., 2012) in order to determine the principal components based on SNP variation. The PCA was performed on a concatenated .vcf file of all chromosomes, which was produced from all the separate .vcf files using bcftools -concat. Percentage of variation explained by each principal component was calculated internally when using SNPRelate. When using PLINK v1.9, the percentage of variation explained was calculated based on individual eigenvalues. The PCA was performed on the entire population sample, including the 103 individuals from Scotland and 43 randomly samples individuals from the remaining Eurasian populations. A PCA was also performed on the concatenated genome from only the 103 Scottish individuals. Individuals were grouped into four populations of northeast, northwest, southeast and southwest, based off cut-offs at 57° latitude and -4° longitude. Lastly a PCA was performed separately using SNPs from the chromosome 4 or chromosome 14 selective sweep regions in the 103 Scottish individuals, using the same four populations.
2.4 Population Genetic Statistics Estimation
Population genetics statistics were calculated across all 19 chromosomes using both vcftools v0.1.15 (Danacek et al., 2011) and ANGSD, using SNP frequency spectra (SFS) (Nielsen et al., 2012). Tajima's D (Tajima, 1989) was used to calculate the frequency of rare variants in 50kb non-overlapping windows in both the Eurasian and Scottish populations, allowing for a comparison of the two. Genetic differentiation between the Eurasian and Scottish populations was calculated using vcftools in the form of the fixation index, FST, according to Weir
and Cockerham's method (Weir & Cockerham, 1984). This was done using 50kb non-overlapping windows for each of the 19 chromosomes. π values were calculated using SNPRelate, with 50kb non-overlapping windows. The π values were divided by the number of sites in each corresponding window to obtain the final values used.
2.5 Sweep Detection
Though in some cases a low Tajima's D value can be used to infer the presence of a selective sweep, 'soft sweeps' can occur without this hallmark. In order to detect putative selective sweep across all 19 chromosomes, the iSAFE (integrated selection of alleles favoured by evolution) software was used (Akbari
et al., 2018). This software first calculates haplotype allele frequency scores
based on the presence of derived alleles in a particular haplotype, which is then used to calculate SAFE scores. These SAFE scores are then in turn calculated across a region of given size in 50% overlapping windows of 300bp to culminate in an iSAFE signal. This can be calculated for large regions up to 6mb, so chromosomes were divided into 3mb fractions for each iSAFE iteration. The
iSAFE software can be set to run under a case-control mode, with the case
populations being either the entire Scottish populations, or the specific sub-populations identified by IBS clusters (explained below), and the control population being all remaining individuals not used in the case population.
2.6 Population Demographics
In order to estimate the population demographics of sub-populations of P.
tremula, the software StairwayPlot was used (Liu & Fu, 2015), which plots
effective population size against time. To estimate these values, the folded SNP frequency spectrum (SFS) for the population in question was calculated using
ANGSD. Time was calculated by StairwayPlot assuming a mutation rate (μ) of
1.16e-9 and a generation time of 20 years.
2.7 Clustering Analysis of Sweep Regions
To further understand the relationships between the sweep regions of all Scottish individuals, we created dendrograms based off both identity-by-state (IBS) and dissimilarity matrices, using the snpgdsIBS and snpgdsDiss functions in
SNPRelate (Zheng et al., 2012) respectively. The dendrogram tree was created
from each matrix using the CutTree function, with a z-score threshold of 10 to detect significance in branches (for both IBS and dissimilarity), a score of 5 to detect outlier individuals, and with 5,000 permutations to create the tree. Coordinates of individuals belonging to each cluster were then plotted to a map of Scotland using the R package 'rworldmap,' (South, 2011) using the colours corresponding to the cluster colour in the dendrogram.
2.8 Detection of Synteny
Using CoGe, an online platform for comparitive genomics, we identified syntenic regions between available Populus genomes. First, a CDS-based plot of synteny between the genomes of Populus tremula and the closely related species Populus trichocarpa was created using the DagChainer algorithm in
SynMap. Given the lack of gene annotation of the selected version of P. tremula, gene models from P. trichocarpa were blasted against the genomic sequence of
P. tremula to define putative homologous gene pairs and determine if they share
a co-linear order between the genomes. The synteny coordinates and gene IDs were output in a DagChainer file, which was later used to identify potential targets of selection encoded within the significant selective sweeps. Furthermore, local synteny between chromosomes was analysed using GEvo at different window lengths.
2.9 Gene Identification
Due to the unavailability of a Populus tremula annotated genome, we took advantage of the gene collinearity between Populus species as described in the previous section, and inherited the annotation of P. trichocarpa v3.0 (https://phytozome.jgi.doe.gov/pz/portal.html#!info?alias=Org_Ptrichocarpa) to identify genes encoded within regions of interest, such as selective sweeps or FST
3.1 Population structure and initial genome-wide analysis
The first filtering steps upon the 140 individuals from Scotland took place as analysis of admixture amongst the Scottish population. This showed that some individuals had hybridised with other closely related species, Populus alba and
Populus trichocarpa (Supplementary Figure 1A). These individuals were identified
and removed to avoid skewing of downstream analyses. Furthermore, identification and subsequent removal of one sample from all pairs of highly related individuals was performed using an IBD threshold of 0.2 (Supplementary Figure 1B). In total, 37 of the 140 original samples were removed during these filtering steps, meaning all further analysis was performed on 103 Scottish samples. The control population of 43 randomly selected Eurasian samples had already been filtered prior to this analysis.
Figure 1. Sample locations and population structure. A) Map of Eurasia and the United
Kingdom with the coordinates of all P. tremula sampling locations plotted to the corresponding region. B) Principal component analysis of all chromosomes from all samples, displaying PC1 against PC2. Filtering of pairs with LD > 0.2, MAF >0.5 with final marker count of 10,465. Variation explained by PC1 is 2.15%, and by PC2 is 1.03%. In the legend, sampling locations are as follows: CH is China, LV is Latvia, NO is Norway, RU is Russia, SE is Sweden and UK is the Scottish population.
A
The initial analysis of P. tremula samples was performed in order to identify population structure, and the populations that contributed to this structure. A principal component analysis (PCA) of the entire genome of all populations was performed, filtered using MAF > 0.5 and LD pruning > 0.2. This comparison of the variance distribution within the samples showed population structure amongst the samples (Figure 1B), with Scottish samples clustering together, distinct from samples originating in other parts of Eurasia. Though both PC1 and PC2 explain little of the total variance (2.15% and 1.03% respectively) the clusters of structure follow a distinct geographic gradient. Some of the Norwegian samples lie closer to the Scottish cluster than other more distantly located samples such as those originating from Russia or China. The presence of structure specific to the Scottish population may in part be indicative of local adaptation and selection, as well as inhibited gene flow and the isolation associated with inhabiting an island. PCA performed on solely on the Scottish population displayed no clear structure within this population (Supplementary Figure 2).
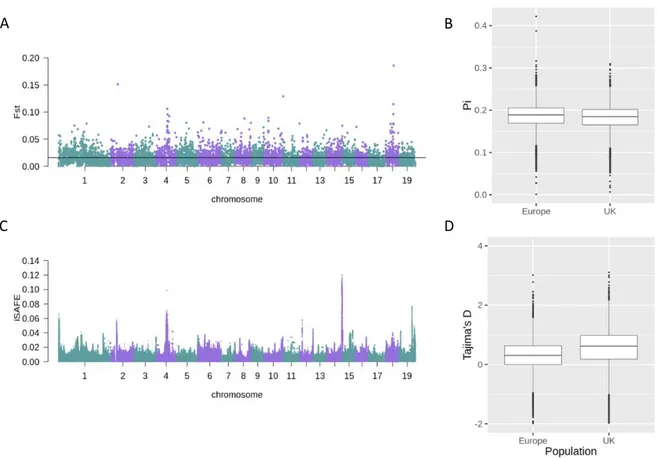
To begin the dissection of causal factors contributing to population structure amongst the Eurasian P. tremula population, a number of population genetic statistics were applied to the 103 individuals Scottish population, alongside 43 samples from Eurasia as a comparison and control. Initial population genetic analysis comparing both populations yielded mixed results. In Scotland, there are generally less rare variants across the entire genome in comparison to Eurasian populations, as indicated by a higher mean Tajima's D value in Scottish samples (p << 0.01) (Figure 2D). A high average Tajima's D value can indicate either balancing selection or a population that has undergone a recent bottleneck event. Chromosome wide Tajima's D values can be found in Supplementary Figure 3. In this case, the ubiquitous, chromosome-wide nature of the Tajima's D signal mean balancing selection can be discounted as the cause, as this is generally a localised signal, meaning that this pattern could be a result of a recent bottleneck event affecting the Scottish population. There is generally low differentiation between all populations, as indicated by an average FST value of
0.016, with few regions with greater differentiation (Figure 2A). On chromosome 4, the Tajima's D values lower within the middle of the chromosome for both populations, but slightly lower values are evident in the Scottish population (Supplementary Figure 3). These signatures may indicate particular areas where selection has acted upon local populations and not across the entire Eurasian population. Furthermore, there is a slight difference in nucleotide diversity (π) between the two populations (p < 0.05) (Figure 2B). Large differences in nucleotide diversity are not expected in two populations from the same species.
3.2 Demographic history of P. tremula populations
throughout Eurasia
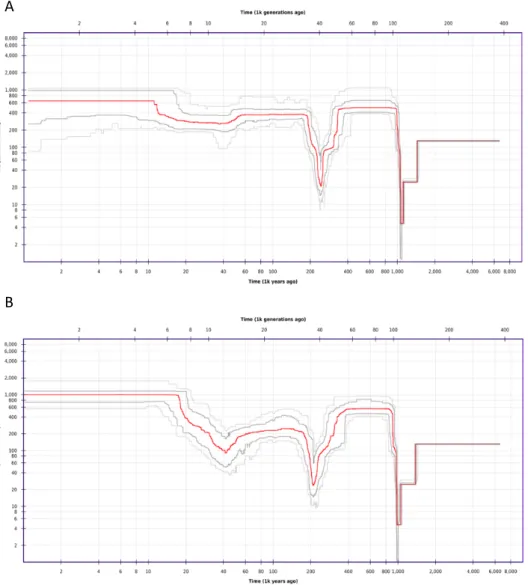
Due to the implied bottleneck in the Scottish population, the next step was to consider the demographic history of this population, compared to that of the Eurasian population. As indicated in Figure 3 A & B, both populations underwent a bottleneck ~1,000,000 years ago, as well as a more recent one ~200,000 years ago, signified by drops in the effective population size (Figure 3). The shared signals over these timescales indicate that these populations had not yet diverged at this point. However, the differential Ne values detected from 60-40kya suggests
divergence of the two populations. It appears that the Scottish population underwent an additional bottleneck ~40,000 years ago, signified by a drop in Ne
from 200 to 100, an event not shared with the Eurasian population. However, this was followed by a subsequent population expansion, as the Ne recovers back
to ~1,000,000 million individuals. The higher mean Tajima's D values across the Scottish population may be an artefact of this historic bottleneck event, coupled with high rates of clonal reproduction during the subsequent expansion.
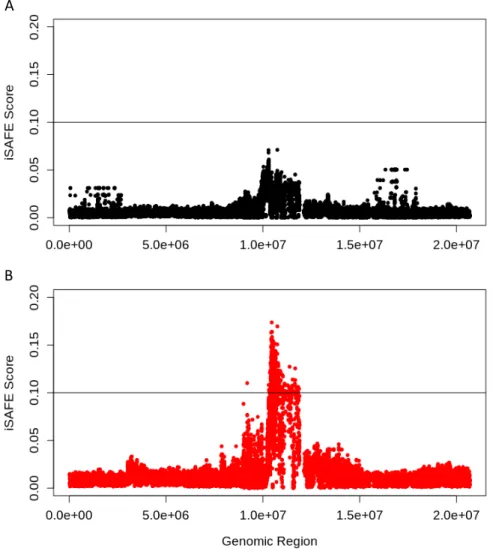
Figure 2. Population genetics analysis of all chromosomes, from individuals in Scotland and
Europe. A) Manhattan plot showing measure of the differentiation index (FST) between the Scottish
population and the rest of Europe, measured independently for each chromosome in 50,000bp non-overlapping windows, with a MAF >0.05. Average value (0.016) shown as black line. B) Distribution of nucleotide diversity (π) calculated in 50kb non-overlapping windows across all chromosomes for European (Europe) and Scottish (UK) population separately, filtered to have a MAF > 0.05. C) Manhattan plot of iSAFE values calculated across all chromosomes, using Scottish individuals as a case population, and European individuals as a control population. iSAFE values were measured in 3Mb windows. D) Distribution of the measurements of Tajima's D statistic for all chromosomes of both European (Europe) and Scottish (UK) populations separately. Tajima's D was calculated using 50,000bp non-overlapping windows, with a MAF > 0.05. Tajima's D values were normally distributed, and the Scottish and European populations were significantly different according to a student's T-test (p << 0.05).
C D
3.3 Detection of selective sweeps
To further understand differences between these populations, and to understand how local adaptation could be acting upon the Scottish population, a number of approaches were used to search for selective sweeps throughout the genome. Low Tajima's D values in particular regions (as opposed to chromosome- or genome-wide values) can indicate a selective sweep, as rare variants are present at higher frequencies after such an event. Though a low Tajima's D value in a region may be indicative of selective sweeps, there were few distinct regions identified in the Scottish genome with substantially lower Tajima's D values compared with the Eurasian population, with only a possible signal in the middle of chromosome 4 with slightly lower values in the Scottish population (Supplementary Figure 3). However, Tajima's D is not always an efficient method for identifying soft selective sweeps. Instead, the selective sweep detection method iSAFE was used, since it associates derived alleles based on their haplotype, it can detect soft sweeps and those not pushed to fixation.
The iSAFE calculations yielded two particular regions of interest as being targets of likely selective sweeps in the Scottish populations, one on chromosome 4 and one on chromosome 14 (Figure 2C). According to Akbari et al., (2018), a significant peak is regions where the iSAFE score exceeds 0.1. On chromosome 14, the putative sweep is near the end of the chromosome, and appears to be focused on 3 potential SNPs. On chromosome 4, the sweep is located in the middle of the chromosome. It does not reach as high an iSAFE score as the putative sweep on chromosome 14. However, it is far wider, and seems to cover a greater region of the chromosome, and is also located close to a region of slightly higher differentiation between the two populations studied (Figure 2A), and near to the region of lower species-wide Tajima's D values (Supplementary Figure 3, Chr4). Other high iSAFE scores such as those on chromosomes 1, 2 and 19 were not chosen for further investigation because they were not as close to the 0.1 threshold as chromosome 4.
Figure 3. Demographic history of Scottish and European populations A) Stairway plot of the
European population effective population size (as estimated by SFS) against time (as estimated using mutation rate (μ) and generation time). B) Stairway plot of the Scottish population effective population size (as estimated by SFS) against time (as estimated using mutation rate μ and generation time).
A
3.4 Analysis of Scottish sub-populations
Since no clear population structure was detected within the Scottish population (Supplementary Figure 2), we decided to focus on the specific sweep regions, as opposed to the entire genome, to see if they correlated with the geographic locations of samples. First, PCA was run separately on both the sweep regions on chromosome 4 (10-12Mb) and chromosome 14 (15-16.2Mb). Again, no clear population structure was detected in either sweep region (Supplementary Figure 4A,B). However, since none of the sweeps detected appear to have reached fixation, it was still likely that individuals contributing to the selective sweep signals could be detected.
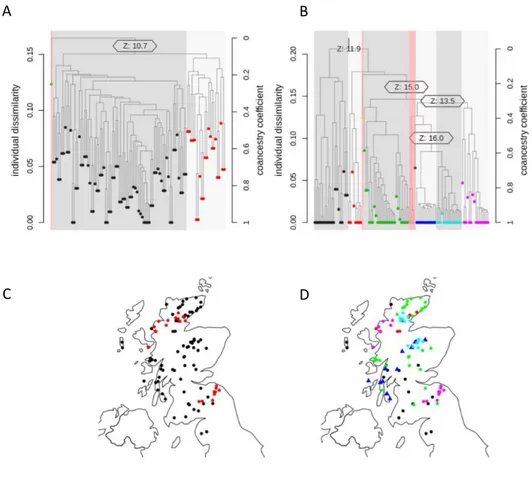
IBS calculations were run on the regions of both sweeps in order to sort the Scottish population into clusters. Dendrograms were created using the IBS calculations to identify clusters. The IBS dendrogram of the chromosome 4 sweep region assorted the population into two particular clusters, with one outlier (Figure 4A). The geographic coordinates of each cluster were then plotted on a map of Scotland and coloured according to their cluster. The samples in the large cluster are generally found throughout the whole of Scotland, with no discernible geography associated with them (Figure 4C). However, the samples found in the smaller cluster are located in two very distinct locations in Scotland. Some samples are grouped in a particular area in the Northwest Highlands, and the rest are grouped in an area near the coast in the Scottish Borderlands.
Figure 4. Clustering of sweep region on chromosome 4 and locations of samples in Scotland. A)
Dendrogram based off IBS scores calculated for each sample in the 10Mb to 12Mb sweep region on chromosome 4. The z-score threshold for clusters is set to 10, with the z-score between clusters indicated on the dendrogram. Outlier threshold is set at 5. Samples from a particular cluster are shown in either red or black. B) Dendrogram based off IBS scores for sweep region on chromosome 14 from 15Mb to 16.2Mb. The score threshold for clusters is set to 10, with the z-score between clusters indicated on the dendrogram. Outlier threshold is set at 0.5. Samples from particular clusters are coloured in black, red, green, blue, cyan and pink. C) Individual sample locations within Scotland, coloured according to clustering shown in A. D) Individual sample locations within Scotland, coloured according to clustering shown in B. Blue cluster shown as triangles for better visibility.
A B
The IBS dendrogram of the chromosome 14 sweep region produced 6 distinct clusters, after exclusion of outliers, which were again removed from further analysis (Figure 4B). Once again, sample coordinates were plotted to a map of Scotland and coloured according to their cluster (Figure 4D). Several groups were associated with distinct geographic regions. Though the largest cluster, green, is generally spread throughout most of Scotland, the red cluster is solely located in the north, the cyan cluster is located in the southern region of the highlands alongside the Cairngorms, and the blue cluster runs down from the central Cairngorms region towards the Kintyre peninsula. Most individuals from the pink cluster share the same geographic locations as those identified as the smaller (red) cluster from chromosome 4.
To determine whether any particular clusters were contributing to the selective sweeps signals detected in the Scottish population, iSAFE was run again on both chromosome 4 and 14. Using each cluster detected using IBS as case populations, with the control population being defined in each instance as all other clusters. When iSAFE was run on the large cluster of chromosome 4, the sweep signal was drastically smaller (Figure 5A) when compared to that of the entire Scottish population (Figure 2C), with the highest point around 0.07. This value is below the recommended 0.1 threshold for significance. When the same analysis was run on the samples contributing to the smaller cluster of chromosome 4, there was a far higher peak in the sweep region, reaching ~0.17 (Figure 5B). The signatures of this selective sweep are therefore localised to these two specific populations in the Southern Borderlands and the south-western Highlands region, and this may be contributing to the population structure identified in the Scottish population overall.
Figure 5. iSAFE scores calculated across chromosome 4 using case and control populations
according to IBS clusters. A) iSAFE values calculated in 3Mb windows across chromosome 4 from the large cluster (black) as seen in Figure 4A using the small cluster as a control population, calculated in 3Mb windows. B) iSAFE values calculated in 3Mb across chromosome 4 from the small cluster (red) as seen in Figure 4A using the large cluster as a control population, calculated in 3Mb windows.
B A
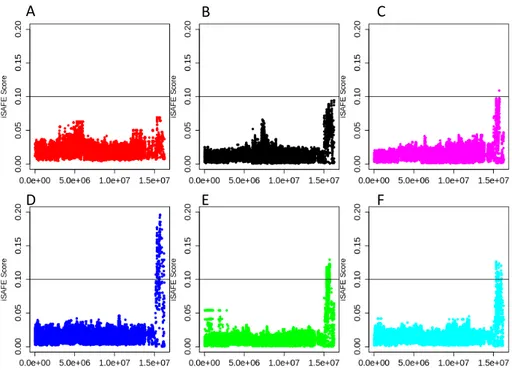
Figure 6. iSAFE scores calculated for chromosome 14 according to clustering calculated from
Figure 4B. iSAFE values across chromosome 14 representing each cluster from Figure 4B using all other individuals in the Scottish population as a control population, calculated in 3mb non-overlapping windows. Colours for each of A, B, C, D, E and F are corresponding to the same colour of clusters in Figure 4B and Figure 4D.
This same iSAFE analysis was performed on chromosome 14 using the clusters identified in Figure 4D as case and control populations, producing six iSAFE plots for each of the six clusters (Figure 6 A-F). The sweep signal appears to be shared between several clusters, with significant peaks over an iSAFE value of 0.1 occurring in both the cyan and the green clusters (Figure 6E, F). The largest peak is contributed to by the blue cluster, with the highest point with an iSAFE score of ~0.19 (Figure 6D), identifying the individuals in this cluster as having been more greatly affected by the selective sweep on this chromosome. These individuals affected most by the selective sweep, those in the blue cluster,
A B C
overlap in geography with many of the individuals from the cyan and green clusters, which both in part occupy areas of the Cairngorms region.
3.5 Identification of genes within selective sweep regions
To understand the role that these selective sweeps played within the Scottish P.
tremula population, it is necessary to delve into the functions of genes around
the sweep area assuming that the closer a gene is to centre of a selective sweep, the more likely it is the target of selection. By isolating the sweep regions on both chromosomes 4 and 14, genes were identified using the functional annotation of the P. trichocarpa v3.0 (https://phytozome.jgi.doe.gov/pz/portal. html#!info?alias=Org_Ptrichocarpa).
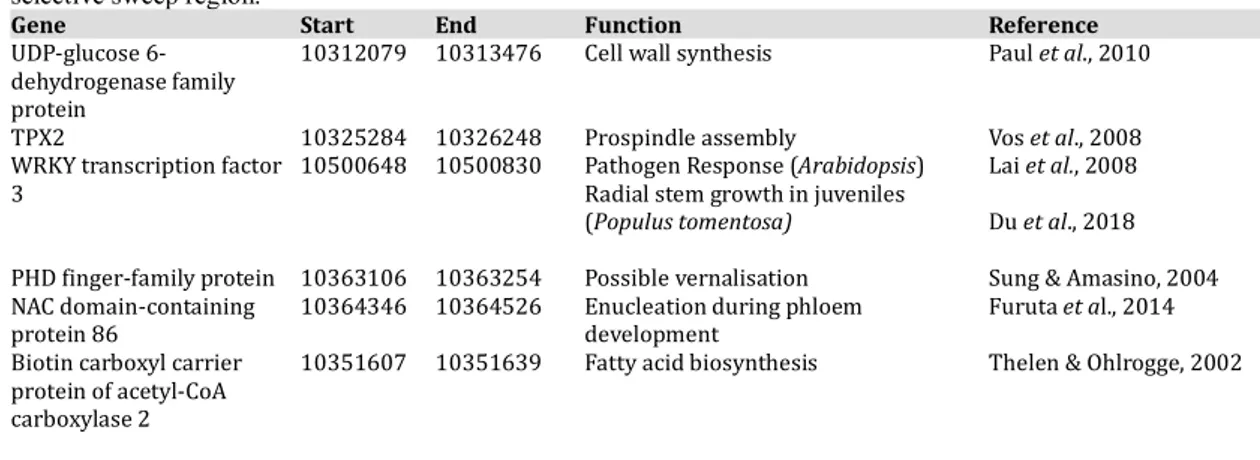
Table 1 contains a list of genes located within 150kb of either side of the highest peak of iSAFE score on chromosome 4. The closest identified gene to the iSAFE peak (Figure 5B), a probable WRKY3 transcription factor, was located at 10,500,648bp along chromosome 4. This is not an exact overlap with the iSAFE peak, which is located at around 10,460,000bp. WRKY3 transcription factors are involved in a number of developmental and stress response pathways in plant species. In Arabidopsis, it has been shown to be involved in pathogen response (Lai et al., 2008), whereas in Populus tomentosa it has been shown to contribute to radial stem growth (Du et al., 2018). The second closest gene to the iSAFE peak, from 10,364,346 to 10,364,526 along chromosome 4, was identified as a
NAC domain containing protein 86, a protein involved in the enucleation process
of phloem development (Furuta et al., 2014). All other genes located in the chromosome 4 sweep region, and their corresponding functions as identified in the literature, are included in Table 1.
Table 1. List of genes within the region 150kB either side of the highest peak of the chromosome 4
selective sweep region.
Gene Start End Function Reference
UDP-glucose 6-dehydrogenase family protein
10312079 10313476 Cell wall synthesis Paul et al., 2010
TPX2 10325284 10326248 Prospindle assembly Vos et al., 2008
WRKY transcription factor
3 10500648 10500830 Pathogen Response (Arabidopsis) Radial stem growth in juveniles (Populus tomentosa)
Lai et al., 2008 Du et al., 2018
PHD finger-family protein 10363106 10363254 Possible vernalisation Sung & Amasino, 2004
NAC domain-containing
protein 86 10364346 10364526 Enucleation during phloem development Furuta et al., 2014
Biotin carboxyl carrier protein of acetyl-CoA carboxylase 2
10351607 10351639 Fatty acid biosynthesis Thelen & Ohlrogge, 2002
Table 2. List of genes found within selective sweep region on chromosome 14.
Gene Start End Function Reference
PAI1, TRP6
phosphoribosylanthranilate isomerase 1
15774830 15775221 Tryptophan biosynthesis Li et al., 1995
PAI2,
phosphoribosylanthranilate isomerase 2
15774833 15775001 Tryptophan biosynthesis Li et al., 1995
zinc ion binding Throughout entire
sweep '' Nucleic acid binding -
SUMO2, small ubiquitin-like modifier 2
15523342 15523493 Accumulations of SUMO
conjugates in stress response
Sarracco et al., 2007
Table 2 contains a list of genes identified within the 15-16.2Mb region of chromosome 14, which corresponds to the iSAFE peak identified in Figure 6D. A larger region was used since fewer genes were located in a more stringent window of the selective sweep. Four particular genes were identified in this region. A large number of zinc ion binding domains were detected throughout the entire sweep region. Zinc ion binding domains are involved in the nucleic acid binding activity of many different proteins. The PAI1 and PAI2 genes overlapped in their locations, a possible mistake in the annotation due to possible high sequence similarity between the two genes. The last identified gene was
SUMO2. This gene has been shown to accumulate in the event of stress response
3.6 Relationship between syntenic chromosomes
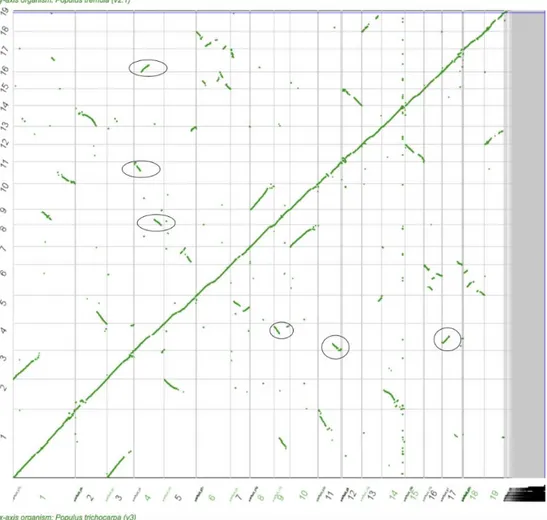
The synteny plot created from the P. tremula and P. trichocarpa genomes reveals that a large number of chromosomes share synteny with other regions of the genome. As shown by the circles on Figure 7, chromosome 4 is made up of three syntenic regions, found within chromosomes 9, 11 and 17. The selective sweep region (10-12Mb) of chromosome 4 shares synteny with chromosome 17. Chromosome 14 is also syntenic with a block of chromosome 2, but this does not fall within the region affected by the selective sweep. There are many other chromosomes sharing synteny with other chromosomes, most notably chromosome 1, which appears to be a fusion of the entire chromosomes 3, 9 and 11. Such a large degree of synteny throughout the genome is indicative of an historic WGD event, followed by the loss of some redundant regions, as well as conservation of others. There are numerous evolutionary events that could have led to conservation of the remaining syntenic regions. Closer observation of these regions and the population genetic and selective sweep signals between syntenic chromosomes would give us a greater understanding as to why these syntenic regions were not lost over time, and the differing evolutionary processes acting upon syntenic regions.
Figure 7. Synteny plot mapping Populus trichocarpa against Populus tremula. Using SynMap,
the output of DagChainer measuring synteny by relative gene order was plotted. The X-axis if P.
trichocarpa and the Y-axis is P. tremula. Green dots represent significant syntenic blocks. Circles
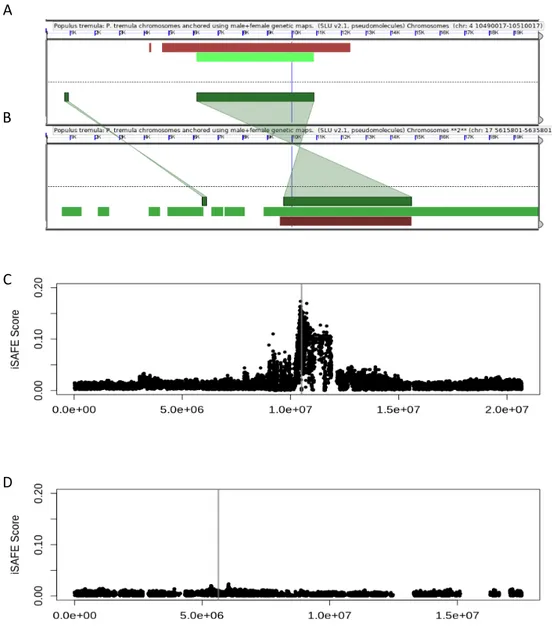
Figure 8. Synteny of WRKY3 between chromosome 4 and chromosome 17. A) WRKY3 gene on
the P. tremula chromosome 4 displayed in a 20Kb window. Dark green box indicates location of the gene. B) WRKY3 gene on the P. tremula chromosome 17 displayed in a 20Kb window. Dark green box indicates the location of the gene. Synteny is indicated as green highlighted areas connecting A and B. C) iSAFE plot across chromosome 4 calculated from the Scottish population with Eurasian samples as a control group. The grey box indicates the window expanded in A. D) iSAFE plot across chromosome 17 calculated from the Scottish population with Eurasian samples as a control group. The grey box indicates the window expanded in B.
A
B
D C
Since the nearest identified gene to the peak of this selective sweep is WRKY3, comparison of the selective signals of this gene and its paralog on chromosome 17 would highlight the different evolutionary pressures on duplicate genes. To first confirm that WRKY3 was paralogous between the two chromosomes, a CoGe BLAST search was performed on the chromosome 4 WRKY3. This showed that the gene is also present on chromosome 17. The synteny in the region of this gene was further analysed on GeVo, as shown by the green highlighted region in Figure 8 A & B. Although it appears there has been an inversion in one of these genes, this is due to the entirety of chromosome 17 being loaded onto GeVo backwards. Assuming WRKY3 is the target of selection, the iSAFE signals across both chromosome 4 and 17 show that this selection is only acting on the WRKY3 copy on chromosome 4, as there is no iSAFE peak at the location of WRKY3 on chromosome 17 (Figure 8C, D). This indicates that selection is only taking place on one of the two WRKY3 copies.
To further examine the relationship between these syntenic regions, a Tajima's D plot was created across chromosome 4 and its corresponding syntenic counterparts on chromosomes 9, 11 and 17 (Figure 9A-D). On chromosome 17, although there have been no recent selective events affecting the region around
WRKY3, a large negative Tajima's D value downstream of this region indicates a
selective sweep affecting both the Scottish and Eurasian populations equally (Figure 9C). Since this area falls within the greater region of shared synteny with chromosome 4, this region was investigated more thoroughly. Upon closer inspection, the particular area containing this negative Tajima's D value did not share any synteny with chromosome 4 (as indicated by a gap in the green box on Figure 9C), although neighbouring regions on both sides of this region did share synteny. The P. trichocarpa annotation revealed that this region contains four genes involved in innate immune response that are not present on chromosome 4. This suggests a gene insertion, and subsequent tandem duplication of immune response genes into this region of chromosome 17, which must have occurred following the WGD event. The analysis of chromosome 4 and its syntenic region
on chromosome 17 has provided two examples of different evolutionary processes acting upon this region of the P. tremula genome.
Figure 9. Comparison of Tajima's D values on chromosome 4 and its regions of synteny with
chromosomes 11, 17 and 9. A) Tajima's D values calculated in 50Kb non-overlapping windows across chromosome 4. Coloured boxes on each syntenic region correspond to the region on syntenic chromosome denoted in B, C, and D. B) Tajima's D values calculated in 50Kb non-overlapping windows across the 10-16.9Mb region of chromosome 11 syntenic with chromosome 4. C) Tajima's D values calculated in 50Kb non-overlapping windows across the 0-5.5Mb region of chromosome 17 syntenic with chromosome 4. Gap in the green highlighted region indicates region with no synteny. D) Tajima's D values calculated in 50Kb non-overlapping windows across the 0-5.2Mb region of chromosome 9 syntenic with chromosome 4.
A
As much of the migratory history of the European Aspen has been analysed along a north-south gradient, we turned to the migration from east to west, focusing on the most western population, in Scotland. Local adaptation of P. tremula throughout the Scandinavian peninsula has already been defined, with a selective sweep on chromosome 10 in the region of the PtFT2 gene, an important gene involved in bud set in relation to day length (Wang et al., 2018). Due to the differential population structure of the Scottish population in relation to other Eurasian samples (Figure 1B), it was likely that similar processes of local adaptation could have played a role in the formation of this structure. The clustering of population structure for different populations mimics the geographic origin of samples, with populations situated closer to each other mirrored in order of their structure. The mainland samples have overlap in structure, whereas the Scottish population does not overlap with the Norwegian population, its closest neighbour in both population structure and geography.
Since the mainland populations are linked by land, this could lead to a noticeable lack of reproductive isolation, allowing the mixing of genetic variation, meaning populations are more closely related. In contrast, the populations of P. tremula on the British Isles will have faced relative reproductive isolation, specifically isolation by distance. Isolation by distance, first proposed by Wright (1943), relates to the idea that genetic variation in local populations differs to other
populations due to the inhibition of gene flow imposed by the distance between them. Since then, isolation by distance has been well characterised both theoretically (Rousset et al., 1997) and population structure has been related to this process in a wide range of species (Sharbel et al., 2000; Aguillon et al., 2017). The inability to share variation with other populations due to isolation will have played a major role in the differential population structure seen in the Scottish population compared with the rest of Eurasia.
The genome of Scottish P. tremula would encompass a large amount of different genetic signatures and historic events, due to its relative level of isolation from the rest of Eurasia. This will have contributed to the formation of differential population structure. One such genome-wide signature of difference between Scottish and mainland populations is the potential bottleneck experienced by the Scottish population, as inferred by the mean genome-wide higher Tajima's D value (Tajima, 1989). This bottleneck may be the result of a number of different potential processes. Many of the tree populations in the British Isles were subject to felling and deforestation since the arrival of humans in the Neolithic period, from ~12,000 years ago (Brown, 1997). P. tremula populations are more frequent in Scotland as there is more space incompatible with agricultural practices, as they are vulnerable to grazing animals (Worrell, 1995).
Another factor contributing to the apparent bottleneck of P. tremula in Scotland may lie in the historic locations of glacial refugia for different populations of P.
tremula. A number of glacial refugia throughout modern Southern Europe and
Asia have been identified where species inhabited during the LGM (Petit et al., 2003). The precise locations of particular P. tremula populations during the LGM are not completely clear. Since it is possible P. tremula was able to survive much closer to the ice cap during the LGM, differentiation between P. tremula populations is lower than less cold competent species such as Populus alba, where glacial refugia have been identified as from either the Balkans or the Iberian Peninsula (Fussi et al., 2010). Furthermore, P. tremula distribution
modelling throughout the LGM indicate potential northern refugia as well (Svenning et al., 2008), making identification of the precise refugia occupied by
P. tremula populations difficult. However, it is still possible that the Scottish
population of P. tremula occupied a different refuge to those populations now found in Northern and Eastern Europe. If P. tremula inhabited similar refugia to
P. alba, it is likely the Scottish population would have inhabited is the Iberian
Peninsula, as this is directly south of the British Isles. In this instance, the Eurasian populations also inhabited refugia directly south of their current population, with southern Scandinavian populations inhabiting the refuge in the Balkans.
The decrease in Ne within the Scottish population ~40,000 years ago when
compared to the Eurasian populations (Figure 3B), may also be a signature alluding to the occupation of a distinct refuge to the Eurasian populations. This dip in Ne indicates an historic bottleneck event, which may be linked to the
bottleneck indicated by high Tajima's D values seen across the Scottish P.
tremula genome today. This signal is not shared by other populations, further
emphasising that these populations may have been inhabiting different refugia at this point. Indeed, conditions within the refugia inhabited by Scotland may have caused the bottleneck. Due to the high rate of clonal propagation in Scottish aspen populations, it is possible that the lack of sexual reproduction alongside relative lack of gene flow with Eurasian populations, may have prevented Tajima's D values from reaching neutral or negative levels, as often occurs during the population expansion that follows a bottleneck. Brown et al., (unpublished) have posited that the colonisation of the British Isles following the recession of the LGM exhibited Baker's law; where rapid clonal propagation takes place following a founder effect (Baker 1955, 1967). The vast clones of P. tremula populations throughout Britain and Ireland would support this idea (Worrell et
al., 1995; Brown et al., unpublished). Without a high mutation rate, the clonal
propagation of P. tremula may be responsible for preventing an expected negative genome wide Tajima's D value following population expansion.
Given the numerous possible genomic events to have occurred to the Scottish P.
tremula population over time, it is not surprising that a number selective sweeps
were detected in the Scottish population. However, it is worth noting that the high rates of clonal propagation may have prevented high rates of local adaptation as a result of the high relatedness between individuals in this population. As these sweeps were measured over a larger population of 103 individuals, clustering analysis based off IBS value performed on each specific sweep region to indicated a clear geographic correlation to the presence of selective sweeps. Scotland has a broad range of climates due to mountainous areas and a predominating westerly wind from the Atlantic, meaning a higher frequency of rainfall and wind on the west coast compared to the east coast (Harrison, 1997). The varying climate of Scotland can therefore make it difficult to prescribe local adaptation as a response to one generic 'Scottish environment,' and selective sweeps are unlikely to be adaptive to all individuals in the country.
By performing iSAFE on the individuals of each cluster (from IBS calculations), the particular groups that contributed most to the selective sweep could be identified. The IBS clustering of the chromosome 4 sweep region in Figure 4A was contributed to by individuals in two distinct parts of Scotland (Figure 10A). These regions were the most north-easterly area of the Scottish Borderlands, near the coast, and in the most southern area of the Highlands region. Although climates in both these areas are different, the map of biophysical features in Figure 10D, compared with the location of these individuals, show they appear to grow in in heathland areas. Though the southern population is located near dry heathlands, and the north near wet heathlands, the gene targeted by this selective could facilitate growth in these conditions, as opposed to growth in mountainous or bogland environments. Heathland areas do not contain trees, and as a primary coloniser, these populations of P. tremula could be recolonising the heathlands, with the chromosome 4 selective sweep facilitating this.
Figure 10. Locations of Scottish samples, Scottish climate and Scottish Topography. A) Locations
of Scottish samples according to IBS clustering of chromosome 4 (as seen in Figure 4C). B) Locations of Scottish samples according to IBS clustering of chromosome 14 (as seen in Figure
4D). C) Topography across Scotland, with legend showing elevation in corner. Taken from Brown
(2017). D) Local environments throughout Scotland as boglands, montane, wet or dry heathlands. Taken from Brown (2017).
In the map of individuals coloured by clustering of chromosome 14 (Figure 10B) the blue cluster of individuals runs through the central area of Scotland, those that contributed the most to the iSAFE peak (Figure 6D). When sample locations
A B
are compared to the topographic image in Figure 10D, this cluster occupies the areas in one of the two major groups of mountainous regions of Scotland, the Cairngorms. It is possible that these individuals are growing near bogland areas or with the stresses of growth at higher altitudes. The selective sweep on chromosome 14 may allow better growth in this stressful environment, ultimately contributing to this locations association with this cluster of individuals. Other clusters also contributed to the chromosome 14 sweeps, albeit not so significantly. The green cluster, which is also contains the largest number of individuals, is spread throughout the country and has no discernible geography associated with its placement. However, half of the individuals contributing to the cyan cluster are located in the same regions as the blue cluster, so the same environmental factors could be acting upon these populations. The other half of the cyan cluster is located in the Scottish Highlands, also a mountainous region. Furthermore, mountains provide a geographic barrier, blocking gene flow between populations. On top of this, the red cluster of chromosome 4 are the same individuals as the pink cluster of chromosome 14, showing that even if there is different variation in different areas of the genome, the same signatures can still be shared in sub-populations. It is possible this clustering caused in part by inability to share the selective sweep with other individuals within the Scottish population. Due to the variable environment of Scotland, plants must have the genetic resources available to cope with fluctuating environments. This may have contributed to the particular clusters for groups of P. tremula in different areas of the country.
This combination of initial genome-wide 'scans' using the iSAFE method in order to determine putative selective sweeps within a population, followed by identification of the clusters contributing to the iSAFE signal has outlined a method that is able to detect selective sweeps that are not fixed within a population. Furthermore, information of the individuals contributing to the selective sweeps can shine light on the environment creating the selective pressure.
Understanding of how a selective sweep functions within populations requires knowledge of the target gene function. When assessing the functions of genes located within the selective sweep region on chromosome 4, the gene located closest to the iSAFE peak was identified as a WRKY3 transcription factor. The
WRKY family of transcription factors is exceptionally large in plants, with many
functions including both biotic and abiotic stress response (Rushton et al., 2010). Indeed, in Arabidopsis this gene was found to be upregulated in response to pathogen inoculation (Lai et al., 2008). However, in Populus tomentosa, a closer relative to P. tremula, WRKY3 was indicated to be involved in radial stem growth in juvenile plants, whilst inhibiting upwards stem growth (Du et al., 2018). This function is of particular interest concerning the environment in Scotland; the thicker stem size of plants may provide a sturdier base for trees and provide more mechanistic support required for growth in areas with high winds. This further coincides with Worrell's (1995) observation that many coastal population of P.
tremula exhibit shrubby growth. As many members of the chromosome 4 cluster
are located near coastal regions, this growth pattern may be controlled by the selection affecting this gene.
The NAC domain containing protein 86, which was also located ~50Kb from the iSAFE peak plays a major role in the development of phloem (Furuta et al., 2014; Auvinen et al., 2014). One possibility for the selection of a phloem development gene may be to aid in the uptake of nutrients from environments with less fertile soil, and Scottish P. tremula are able to cope with a wide variety of soil types (Worrell, 1995). Other genes located near this sweep region are could also have related functions in such environments, with the UDP-glucose dehydrogenase having been shown to act in cell wall biosynthesis (Paul et al., 2010), which may act to provide further structural support.
In chromosome 14, there were fewer genes in the annotation within the region of the selective sweep. However, some curious genes were identified, such as the
PAI1 and PAI2 genes, which are essential in tryptophan biosynthesis (Li et al.,
1995). Tryptophan is an essential amino acid in plants, and is a precursor to one of the auxin biosynthesis pathways. As such an important general plant hormone in many stress and development pathways (Tao et al., 2008), these genes could well be the target of selection in this instance, but its wide range of functions make it difficult to discern any particular one. Another gene encoding the
SUMO2 protein was identified. This gene accumulates in the event of biotic or
abiotic stresses, so also makes it a candidate for selection in this instance (Park
et al., 2011).
Since there is such a high prevalence of synteny between chromosomes within the P. tremula genome, it is may be that the resulting paralogous genes play a role in events of local adaptation in the species. The widespread synteny throughout the genome is evidence of an historic whole genome duplication event and subsequent loss of some redundant regions after this event. The synteny seen between many of these chromosomes today is the remnant of historically duplicated chromosomes and subsequent chromosomal shuffling (Tang et al., 2008; Bowers et al., 2003). After a WGD event, many regions within the genome can become functionally less constrained by evolution due to the presence of duplicate genes, allowing selection to take place more freely, through the processes of neo-functionalisation and sub-functionalisation (Flagel & Wendel, 2009). In other cases, one gene from a duplicated pair may lose its function through the process of pseudogenisation.
It is possible that the selective sweep on chromosome 4 was facilitated due to a lack of evolutionary constraint. Since the WRKY3 gene, closest to the target of the selective sweep, shares a paralog on chromosome 17 (Figure 8A, B), the relationship between selective sweep signals on both chromosomes is evident of differing selective pressures. There is no iSAFE signal surrounding WRKY3 on chromosome 17. In this instance, it is possible that the targeted gene on chromosome 4 may have had its function conserved on chromosome 17, and no selection of variants took
place due to importance of its function, marking the beginning of a neo-functionalisation event. The selection of this gene on chromosome 4 may have been able to take place due to its duplicity; an essential function of the gene could be conserved on chromosome 17 whilst selection of variants allowing different functions or expression patterns could take place on chromosome 4. It is also feasible that the chromosome 17 copy of WRKY3 has become a pseudogene since the WGD, as no selection would take place on a non-functional area of the genome. There are other examples of selective sweeps not being shared across syntenic chromosomes in P. tremula. Chromosome 10 shares complete synteny with chromosome 8 (Figure 7), however the selective sweep on chromosome 10 in the northern Scandinavian populations detected by Wang et al., (2018) was not present on chromosome 8, a similar circumstance to what was identified in this study.
Further observations of the block of chromosome 17 syntenic with chromosome 4 revealed further regions under likely selection. The sharp negative Tajima's D value on chromosome 17 indicated a selective sweep present on both Scottish and Eurasian populations. The fact that, upon closer observation, this region did not share synteny with chromosome 4, whilst its neighbouring regions did, produces a greater understanding of the history of these chromosomes since the WGD event. The sweep region of chromosome 17 is enriched for at least 4 genes involved in innate immune response. As is common in the evolution of immune response genes, tandem duplication can allow further evolution in plants as pathogens evolve to evade immune response (Yu et al., 2015). In this case, it appears that an original gene involved in immune response may have been inserted into the chromosome 17 region since the WGD, followed by numerous tandem duplication events. The signatures of a selective sweep being shared by all P. tremula populations studied in this analysis show the importance of these immune response genes for the survival of P. tremula, not just on a local scale but across the entire of Eurasian area.
A number of events within the evolutionary history of the Scottish P. tremula were identified as contributing to its differential population structure. The population went through a unique bottleneck event ~40kya, and because of the tendency for clonal propagation of aspen in the British Isles, may still be contributing to the genome-wide positive Tajima's D value observed in these populations. Alongside this bottleneck event, a number of sub-populations within the greater Scottish population have undergone local adaptation, as identified in the form of potential selective sweep events. However, as the selective sweep signals on both chromosome 4 and 14 were not particularly strong, this suggests that these selective sweeps had not been pushed to fixation in the population. Further investigation of the regions within these selective sweeps showed that the signals were coming from particular geographic regions of Scotland, indicating that particular environments in different parts of the country are likely driving selection. By identifying the clusters within each sweep region, this gave a clear indication of which individuals were contributing to the overall selective sweep signal, thus outlining a method which can detect selective sweeps that have not yet been fixed in the population.
A gene located near the chromosome 4 selective sweep, WRKY3, is involved in stem growth in a closely related species. Further analysis into the sweep region of chromosome 4 and its synteny with chromosome 17 revealed two distinct regions in which evolution had shaped the genome since the WGD. Where
synteny was shared, selection took place on chromosome 4, while chromosome 17 continues to evolve neutrally. However, in a nearby region, the insertion and subsequent selection of immune response genes must have occurred since the WGD, as the lack of synteny shared with chromosome 4 suggests. These results clearly display the difference between Scottish and Eurasian P. tremula populations, and provide further insight into the evolutionary processes that acted upon the genome following a WGD event.