Final Report – Group T2009
Investigating the impact of lean
philosophy for identification and
reduction of delays associated with
performance of production line
PAPER WITHIN: Production Systems
AUTHOR: Manoj Manjunath Bhat, Vignesh Bhandarkar TUTOR:Simon Boldt
This exam work has been carried out at the School of Engineering in Jönköping in the subject area Production system with a specialization in production development and management. The work is a part of the Master of Science program. The authors take full responsibility for opinions, conclusions and findings presented.
Examiner: Milad Ashour Pour
Supervisor: Simon Boldt
Scope: 30 credits (second cycle)
Abstract
In the present world scenario, the rapid industrialization and growth of manufacturing sector has led to the rise of large number of companies focusing on increase in profitability for sustaining the company’s profit margin at a higher level. While most of the companies fail to differentiate between productivity, profitability and performance as all the three growth indicators have different factors affecting them. The productivity of a system is evaluated through the ratio of output and input whereas the profitability is evaluated by measuring the capital flow. But the performance of any system is measured by the speed, quality and time consumed for delivery of a product. Thus, the preliminary growth indicator to be focused by any company must be productivity as it defines the effective input and efficient output of a system or production line and further provide attention for performance. Any productive system to function smoothly must include less amount of wastes, these wastes need not be a particular form. According to lean philosophy there are basically eight wastes arising in a system which has to be considered for elimination or reduction preferably. These wastes not only affect a particular process, while causes negative effects on the performance of entire system by causing delays in the process which increases nonvalue added time and reduces the actual operating time of a process. The present study focuses on exploring lean philosophy for identifying the existing delays of a production system and to further investigate the root causes influencing these delays which effect delivery of product. This study involves a deductive approach of qualitative type of research and the methods used for data collection includes a single case study with systematic literature review of data on which analysis is carried out and derived results are concluded in the final chapter of this research. The conclusion will be based on the results obtained from analysis of data carried out with the aid of tools existing under lean philosophy. The research is concluded by suggesting the solution for reducing delays utilizing simple tools of lean philosophy which can be utilized by manufacturing firms with effective utilization of existing machinery, men and methods and low investment of capital.
Keywords: Lean Philosophy, Delays, Bottleneck, Time variables, Lean tools, 7+1 wastes of lean manufacturing.
Table of Contents
1 INTRODUCTION ... 7
1.1 BACKGROUND ... 7
1.2 PROBLEM DESCRIPTION ... 8
1.3 AIM AND RESEARCH QUESTIONS ... 9
1.4 DELIMITATIONS ... 10
1.5 OUTLINE ... 10
2 METHODS AND IMPLEMENTATION ... 11
2.1 RESEARCH PROCESS ... 11 2.2 LITERATURE REVIEW ... 12 2.3 CASE STUDY ... 14 2.4 ANALYSIS ... 18 2.5 RESEARCH QUALITY ... 19 3 THEORETICAL BACKGROUND ... 20 3.1 LEAN PHILOSOPHY ... 20 3.2 LEAN WASTES ... 21 3.3 LEAN TOOLS ... 23 3.4 DELAYS... 28 3.5 TIME VARIABLES ... 29 3.6 BOTTLENECK ... 30
3.7 JUST IN TIME (JIT)... 30
3.8 TRIPLE P MODEL ... 31
4 FINDINGS ... 33
4.1 EMPIRICAL FINDINGS ... 33
5 ANALYSIS ... 42
5.1 RATING OF WASTES AND SECOND STAGE OF 5 WHYS ANALYSIS... 42
5.2 ANSWERING RESEARCH QUESTION 1 ... 50
5.3 ANSWERING RESEARCH QUESTION 2 ... 51
5.4 ADDRESSING INFLUENCE OF LEAN TOOLS ON REDUCTION OF DELAYS... 51
5.5 IMPORTANCE OF ADOPTING JIT ALONG WITH LEAN TOOLS. ... 54
5.6 VARIATION IN RELATION BETWEEN TRIPLE P’S AND TIME VARIABLES DUE TO INFLUENCE OF DELAYS. ... 54
6 DISCUSSION ... 57
6.1 ANSWERING RESEARCH QUESTION 3 ... 57
6.2 OVERVIEW ON SELECTION OF METHODS ... 57
6.3 DISCUSSION ON PURPOSE OF RESEARCH ... 58
7 CONCLUSION ... 60
7.2 CONCLUSION AND FUTURE SCOPE ... 60 8 REFERENCES... 62 9 APPENDICES ... 68 9.1 INTERVIEW GUIDE ... 68 9.2 RPASHEET ... 71 9.3 PRODUCTION DOCUMENTS ... 73 9.4 ABBREVIATIONS... 74
List of Figures
Figure 1: A schematic representation of flow of data in the research. ... 11Figure 2: A schematic Representation of Research Process. ... 12
Figure 3: A schematic representation of screening process adopted to find literature sources. ... 13
Figure 4: A schematic representation of analysis of data from case... 19
Figure 5: A schematic representation of theoretical framework of the research ... 20
Figure 6: A figure explaining the process of PDCA cycle (Silva, et al., 2017).25 Figure 7: A flow chart representing steps of 5S lean tool (Rojasra & Qureshi, 2013). ... 26
Figure 8: A schematic representation of triple P model (Tangen, 2005)... 32
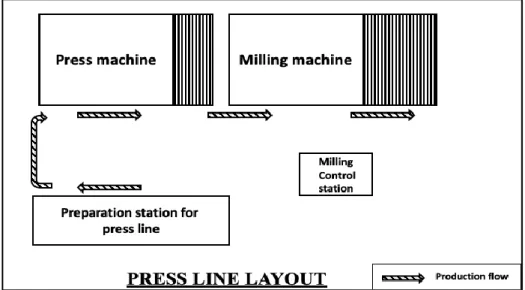
Figure 9: A layout of press line representing the production flow. ... 33
Figure 10: A flowchart representing breakdown of root cause through 5 Whys analysis... 34
Figure 11: Spaghetti diagram depicting movement of Operator A from case company. ... 37
Figure 12: Spaghetti diagram depicting movement of Operator B from case company. ... 38
Figure 13: A layout of press line representing the production flow along with wastes identified. ... 41
Figure 14: A figure representing different time variables inspired from (Panneman, 2017) ... 55
Figure 15: A figure representing relation between time variables and triple P model ... 56
List of Tables
Table 1: A table representing number of hits produced throughout screening
process ... 14
Table 2: A table representing interviews and its duration ... 17
Table 3: A table representing overproduction and its problems ... 36
Table 4: A table representing extra processing and its problems ... 36
Table 5: A table representing defects and its problems ... 36
Table 6: A table representing motion and its problems ... 37
Table 7: A table representing waiting and its problems ... 38
Table 8: A table representing excess inventory and its problems ... 39
Table 9: A table representing transportation and its problems ... 39
Table 10: A table representing non utilized talent and its problems... 40
Table 11: A table depicting rating provided for overproduction ... 43
Table 12: A table depicting rating provided for extra processing ... 43
Table 13: A table depicting rating provided for defects ... 44
Table 14: A table depicting rating provided for motion ... 44
Table 15: A table depicting rating provided for waiting ... 45
Table 16: A table depicting rating provided for excess inventory ... 45
Table 17: A table depicting rating provided for transportation ... 46
Table 18: A table depicting rating provided for non-utilized talent ... 46
Table 19: A Table representing all the identified wastes and their impact on delay ... 47
Table 20: Rating of types of wastes found in the line ... 47
Introduction
1 Introduction
This chapter introduces the subject of study conducted with a concise introduction on delays, their occurrence and effects on manufacturing firm. In problem description importance for identification and reduction of delays is discussed which supports the main purpose of this project followed by research questions, delimitations and an outline of the report.
1.1 Background
In a continuously growing industrial sector, manufacturing firms are focusing to achieve both efficient and effective production (Feldmann, et al., 2013). But these rapid developments will increase time involved for production of any product which varies constantly based on its demand. The demand of product is constantly fluctuating and cannot be predicted accurately by the companies, while the companies must be flexible to handle such demands arising in the market (Nagle, et al., 2018). Variation in demand will influence the nature of production by influencing speed of delivery and time involved in production, thus affecting the time variables like process time and cycle time. These time variables influence the processing of product to a larger extent (Li, et al., 2018; Nagahara & Nonaka, 2018). Time variables could be affected for various reasons including varying demand, improper processing, inadequate planning or scheduling, less availability of resources etc. (Mourani, et al., 2008; Nagahara & Nonaka, 2018). Amongst these factors improper processing will immensely affect production activity as processing of input into output forms the basis of any transformational action in production.
Occurrence of delays will extend the time involved in transformation of raw materials into finished goods (Veeger, et al., 2010). Thus, even though products are produced there is variation in its speed of delivery. Delays could occur because of various reasons, for example material delay, order delay, transportation delay, delay due to improper handling of machine codes, delay due to excess setup time (Mourani, et al., 2008). These delays not only affect the time variables like process time and cycle time by extending them but also hinders the productivity of line (Veeger, et al., 2010). Decrease in productivity of line will lead to decrease in performance of line (Tangen, 2005). Hence, sustaining high productivity in production line by reduction or elimination of delays arising in line must be prioritized. Delays are associated with wide number of factors and root causes which influence adversely towards the smooth functioning of a system (Mourani, et al., 2008). In order to avoid such adverse effects, it is very much essential to identify the root cause of a problem or factor which is responsible in increasing delay. Adverse effects on system includes excess utilization of time compared to that of normal processing time which further leads to increase in nonvalue added time. Such nonvalue added time has to be resolved in any kind of process (Mourani, et al., 2008). The activities associated with such nonvalue added time are
Introduction
considered as wastes and corresponds to functions related to production (Cancado, et al., 2019).
Eliminating nonvalue adding activities and wastes from production line will significantly reduce cause of delays (Patidar, et al., 2017). Wastes in a production facility have been categorized under eight categories as per lean philosophy (Hill, 2018). Lean as a philosophy influences way of thinking, as it encourages production of goods with zero nonvalue adding activities and elimination of resources which adds no value to end product (Sternberg, et al., 2013). Lean philosophy also promotes effective input and efficient output of a line by eliminating wastes of the line (Zhang & Chen, 2016). Along with promoting elimination of wastes, lean philosophy also encourages just in time production for producing right products at right quantity in right time with ensured quality and focuses on cost reduction of products (Pinto, et al., 2018; Lyonnet & Toscano, 2014). Lean philosophy also aids in identification of root causes of problem through various tools like 5whys, fishbone diagram and pareto chart (Ashok Sarkar, et al., 2013). Thus, tools of lean philosophy can be utilized to identify the root cause arising in production line which are adversely affecting performance of line by increasing time involved in production of goods (Zhang & Chen, 2016; Ahmad & Soberi, 2018). According to Zhang & Chen (2016) lean philosophy involves reduction of wastes utilizing lean tools in order to increase productivity (Zhang & Chen, 2016). Lean philosophy is a technique utilized for process improvement by identifying unnecessary actions and elements and eliminating them (Sternberg, et al., 2013). Hill (2018) claims that adopting lean approach aids in reduction of wastes in manufacturing and improving productivity (Hill, 2018).
As outlined above, majority of previous studies referred lean philosophy as a principle which focuses on reducing nonvalue adding activities with the aid of lean tools and also encourage just in time production in manufacturing firms along with reduction of 7+1 wastes. But the areas pertaining to influence of lean philosophy on reducing delays associated with performance of line is unexplored. Hence, it is important to explore the influence of lean philosophy in reduction of delays caused during any process and investigate how exactly the reduction of delays will aid in achieving high performance of line. Along with the necessity for investigating the research gap discussed above, it is also highly important to consider the impact of research on production firms. As basic criteria for majority of the production firms is associated with earning profits from products delivered. Focusing on such production firms, it is widely essential to identify simple tools for reducing delays with efficient utilization of existing machinery, methods and men with a negligible investment of capital.
1.2 Problem description
As number of nonvalue adding activities increases in production line the total operating time reduces drastically and the time required for controlling these activities increases (Mourani, et al., 2008). This increase in time involved for control activities will reduce performance of line due to unnecessary stops. Stops generally include set up time, break
Introduction
time, cut off time and other predefined stops for the maintenance (Al-Najjar & Alsyouf, 2003). The unexpected stops occurring in the line apart from the reasons mentioned above add no value to the process and hence causes decline in performance of production line due to low productivity. Stops are associated with delays as number of stops together cause delay in delivery of products. Hence, it is essential to identify its root causes which are influencing delay (Abdellatif & Alshibani, 2019). Delay might occur due to various reasons, one among them is presence of nonvalue adding activities or materials which are considered as wastes (Patidar, et al., 2017). Thus identifying the wastes existing in an production system and eliminating source causing their occurrence will influence strongly on reduction of delays.
Lean philosophy promotes the reduction of wastes in an production line (Zhang & Chen, 2016). Hence, it will be utilized for identifying and reducing the wastes which are preliminary causes for delays (Brown, et al., 2008). The research gap identified is to examine if lean philosophy could be used to reduce the delays, as this philosophy usually promotes reduction of wastes. With the help of simple tools under this philosophy which will aid in reduction of delays, the most common problem of late delivery of products from a process due to excess utilization of time can be controlled. Reduction of delays enables restriction of process within the cycle time of the line, which in turn influences performance of line (Mourani, et al., 2008; Abdellatif & Alshibani, 2019). Hence it is important to explore tools of lean philosophy which aims at identification of the source causing delays and reduction of the same. This specific problem is identified and chosen for the current study as it is important to explore the influence of lean philosophy in optimizing delays whilst majority of the previous existing researches have addressed the influence of lean philosophy on reduction of wastes.
1.3 Aim and Research questions
The purpose of this project is to investigate the influence of lean philosophy in identification and reduction of delays associated with performance of production line. Based on this purpose following research questions have been formed,
1. How does lean philosophy aids in identifying root cause of delays in production line?
The second research question is essential in the analysis stage of research and is helpful in exploring the effects of lean tools in investigating the root causes of a delay. This research question also helps in identification of most common cause of delays.
2. What are the major root causes of delays in production line?
Research question 3 is framed with a necessity of identifying right lean tools under lean philosophy which aids in reduction of delays. This research question also helps in exploring the impact of reduction of delays on performance of production line.
Introduction
3. How does lean philosophy influence reduction of delays and enhances performance of production line?
1.4 Delimitations
This project aims in exploring the impact of lean tools for reducing the delays in a process but does not promote any other operational tools from different production strategies. This study involves a suggestion of solution regarding increase in performance of line through reduction of delays, but the lean tools proposed in the current research only promotes effective use of men, machinery and methods without any aid of automation. The results of this study promote the positive impacts of using certain lean tools for increasing performance in production line and does not include all the lean tools as some of the lean tools are associated with automation and high investment for implementation.
1.5 Outline
This report includes six chapters depicting the study conducted. The first chapter provides information on background of lean philosophy and delay. This chapter also describes the purpose of this research and associated research questions of the study. It also outlines the delimitations of the study conducted. The second chapter describes the research approach adopted and methodology through which research is conducted. The third chapter in this report highlights on the theoretical framework of the lean philosophy and principles associated with it. This chapter also outlines certain tools of lean philosophy used in the research for identifying the source of occurrence delays and also recommended tools for solving them. In the fourth chapter findings of the research has been presented from the empirical data collected during research, further analysis is carried out in the next chapter to identify the suitable solution for root cause of the problem. In the discussion chapter majority of research questions are answered along with the discussion of methods chosen for study. Research is concluded with a future scope in the final chapter.
Methods & Implementation
2 Methods and Implementation
2.1 Research Process
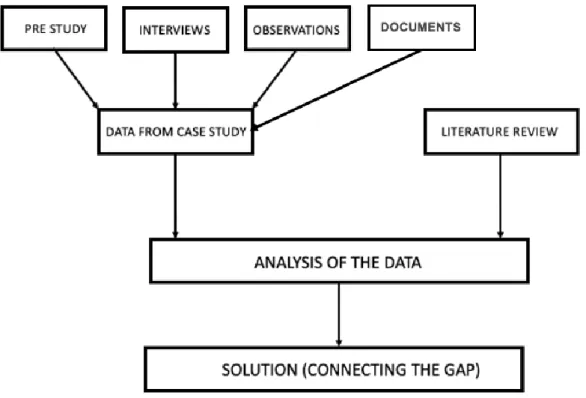
A qualitative research setup is selected for this study and deductive approach is used which will promote theory generating study as the subject of the study requires a deeper understanding for the analysis to be carried out (Williamson, 2002). This study also involves certain quantitative data from the company which has to be analyzed before producing results or providing solutions for the problem. As a part of qualitative study literature study, a case study under which semi structured and unstructured interviews and observations were conducted (Gill, et al., 2008). Triangulation method is adopted to increase the external validity and reliability of the research in this study (Leedy & Ormrod, 2019). A single case study is used for the research which involves both qualitative and quantitative data from the case company which will be used along with the data available from the previous researches to analyze the problem from the case and provide solution to connect the gap identified in the research. Data is also collected by conducting a literature review for analyzing the problem from case study and recommending solution. According to Saunders (2012), the overall strategy adopted to satisfactorily answer the research questions framed ensures the research quality (Saunders, et al., 2012). The flow of data in the research is explained below schematically in the Figure 1 which provides a view on strategy adopted for the research approach.
Methods & Implementation
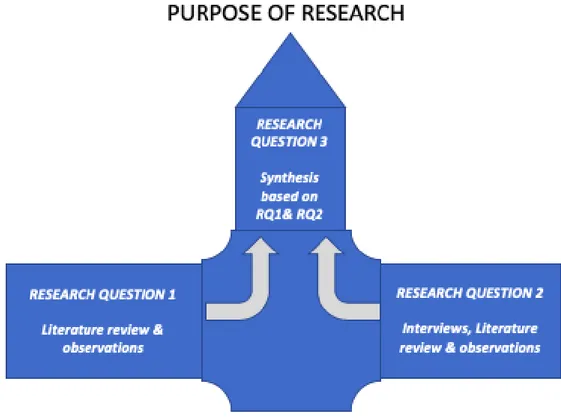
The process of research adopted for answering the research question is inspired from front half of aircraft structure which is explained in a schematic representation below in Figure 2 the three research questions are considered as different parts of an aircraft which drives the aircraft in one direction. The first two research questions form an essential part of research like wings of an aircraft to balance the movement of aircraft in one direction. This research involves three research questions which sums up to fulfil a major purpose of research out of which each will be answered during different stages of research. The first research question will be answered by utilizing data from observations and interviews carried out at case company along with the information acquired from existing literature sources. The second research question will further be resolved during the case study analysis of the report with the help of data obtained from literature sources and will also investigate the influence of lean tools in identifying the root causes of a delay. The final research question framed will be answered through a discussion regarding the synthesis of RQ1 & RQ2 which will be essential in providing a solution for the problem defined in the research. All three research questions summed up together will resolve the main purpose of the research and will help in investigating the impact of certain lean tools under lean philosophy on identifying the delays and reducing them to increase performance of line.
Figure 2: A schematic Representation of Research Process.
2.2 Literature Review
The literature review in this study is used for exploring theoretical background related to the area of study and also for data collection as a research strategy (Armitage & Keeble-Ramsay, 2009). The literature search was conducted using databases like
Methods & Implementation
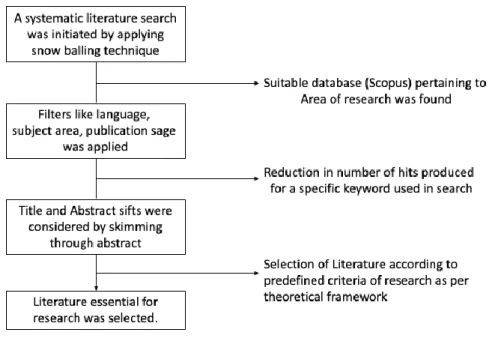
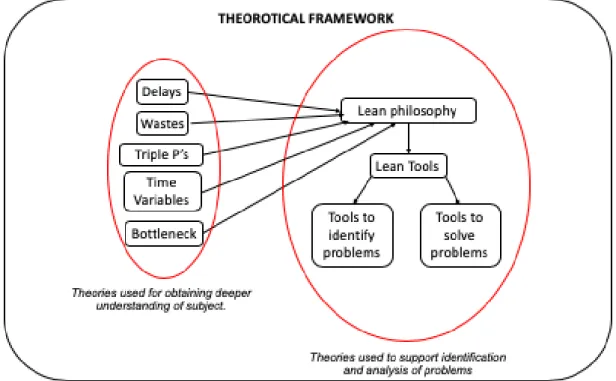
Scopus, Google Scholar along with “Primo”, a search engine of Jonkoping university library. A snow balling technique was utilized to identify right source of data, because of which Scopus was selected as suitable database for majority of data collection. It was also convenient to carry out a systematic literature search under a single platform. The following keywords, “lean tools”, “delays”, “process time”, “productivity”, “performance”, “lean wastes management” to produce number of hits. Adopting snowballing technique and using bibliographic search fliers enabled ensuring quality of research (Booth, et al., 2016). Further different search combinations were used along with Boolean method to filter the search. Initially literature sources were filtered based on language (English), subject area (Engineering) and publication stage (published and peer reviewed). Secondary screening was carried out by skimming through the title and abstract of the literature obtained from first stage to produce literature relevant to the subjects required for research. This requirement of the subjects for conducting research was considered as theoretical framework and has been represented in Figure 5. Data obtained from the Literature review was used primarily for identification and analysis of a problem pertaining to area of research, specifically for the current case. But it was also used to gain a deeper understanding on certain topics related to area of research. Complete screening process has been explained schematically below in Figure 3 followed by the list of number of selected articles with respect to keyword used for search in Table 1.
Methods & Implementation
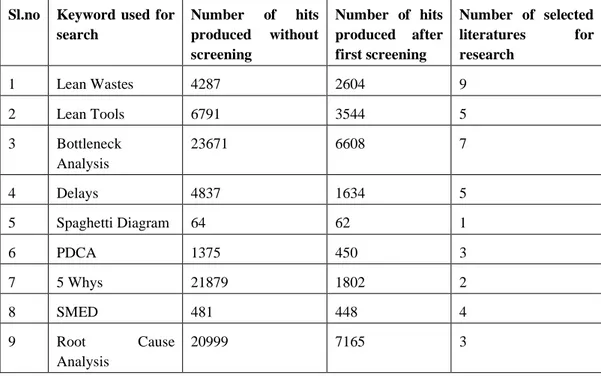
Table 1: A table representing number of hits produced throughout screening process
Sl.no Keyword used for search Number of hits produced without screening Number of hits produced after first screening Number of selected literatures for research 1 Lean Wastes 4287 2604 9 2 Lean Tools 6791 3544 5 3 Bottleneck Analysis 23671 6608 7 4 Delays 4837 1634 5 5 Spaghetti Diagram 64 62 1 6 PDCA 1375 450 3 7 5 Whys 21879 1802 2 8 SMED 481 448 4 9 Root Cause Analysis 20999 7165 3
2.3 Case study
A case study is an essential type of qualitative research method which can be used for exploring a contemporary case in a real-life condition (Yin, 2002). Case study carried out has to be clearly investigated and a fine examining must be conducted (Bryman & Bell, 2011). Exploring deeper in a single case study will help in increasing the quality of the research instead of exploring multiple cases (Dubois & Gadde, 2002). In this current study it has been essential to support the problem addressed through a practical case from any manufacturing firm thus a case study is adopted which includes data collected through observations and interviews for a specific case and will support the analysis of the problem with the help of data from a practical scenario related to a manufacturing company.
2.3.1.1 Case company
KABE Husvagnar is a caravan production company located in Tenhult, Jonkoping region of Sweden. This industry is known for its service and cost for products quality along with achieving customer requirement. Amongst several departments in KABE, project will be carried out in the production line because academically major stream of research was restricted to production. In the production line the current study was conducted prominently in press line where the important parts like walls and floors were built using press line and a milling machine further sent out to assembly line. This company has been chosen for the case study because the company includes operations with no automation and works with push strategy of production which provides a platform for developments and identification of problems associated with delays. The
Methods & Implementation
current study only involves an single specific case from company KABE Husvagnar AB and does not include any other cases from the company.
2.3.1.2 Pre study
Rapid plant assessment was carried out at the company by one of the researcher in order to understand the current working condition of the company (Goodson, 2002). Although one of the researcher possessed a view of the company from previous study conducted during the previous spring as a part of internship. The other researcher was unaware about the functioning of company and previous study conducted. After the rapid pant assessment was conducted, the results were discussed among the researchers of this study to further understand the functioning of the company, prominently the press line. Data from the previous study and rapid plant assessment conducted was summed up to define a problem in the press line which was considered a bottleneck of the whole assembly line as this is the initial process of the assembly line where the floors and walls are built utilizing press machine and milling machine and variations in delivery from this line could affect functioning of whole assembly line. A short interview with the production manager also confirmed that the defined problem was considered as a bottleneck by the company. Further this problem identified was discussed with the supervisor in order to analyse the scope behind this subject, after a couple of meetings held the proposed problem was modified into a subject for the research and the company problem was considered to be a case to be solved by analysing data from the company along with the data available from literature sources. The pre study was concluded proposing subject of the research, further study focused on identifying the major causes of this problem.
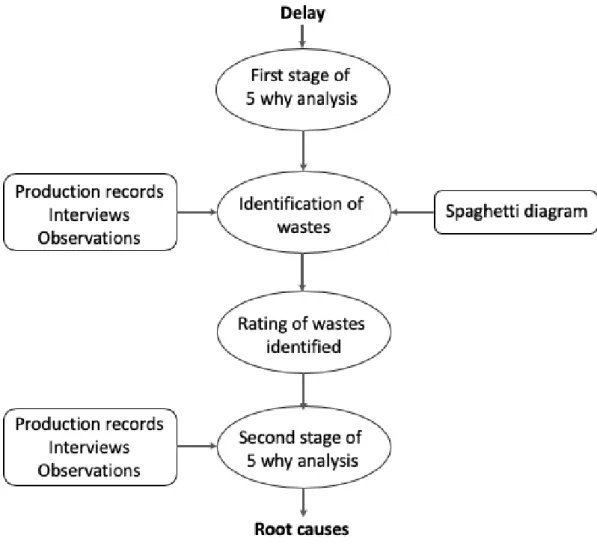
2.3.1.3 5 Whys
Ensuring collection of relevant data essential for the research plays an important role, as unnecessary data collected reduces the trust worthiness of the study. Thus, a comprehensive definition and breakdown of problems identified was carried out through 5 whys technique considering its ease for implementation. This lean tool has been essential in identifying the root cause of the problem defined by a simple procedure of inquiring any problem with the aid of why several times in a row (Borkowski, et al., 2012). The reason for adopting this technique relies on ease of handling tool and efficiency of results (Borkowski, et al., 2012). The tool basically includes several steps until root cause of a problem is identified by inquiring and answering the same through logical thinking. In the current study, during this process an important area (delay) of research was identified and also its root causes were located. This demonstrates the process of 5 why analysis conducted and highlights the utilization of a lean tool in problem identification. The process adopted in the current study was predominantly an initial step in data collection which was essential to increase the relevancy of data collected and also to identify the major root cause of problem as unwanted wastes or excess wastes existing in the press line. Based on the evidence of existing wastes each waste was further inquired with this tool at second stage to identify source of its occurrence which has been presented in analysis section
Methods & Implementation
of report and has also been tabulated in Table 21. Thus, basically study involved two stages of 5 whys where first stage was conducted prior to analysis and second stage was conducted during analysis of study.
2.3.2 Data collection methods
2.3.2.1 Observation
Observations includes a physical setting where in the researcher is closely involved to ensure the method and quality of data collected (Bryman & Bell, 2011). Observations for this study has been carried out by researchers in the press line to identify the delays and reason for the delays caused by closely observing the activities around the press line and also noting operator movements with the help of spaghetti diagrams, time study and operator risk analysis. A sophisticated observation carried out supported by interview will increase the quality of research conducted and will ensure collection of secondary data (Saunders, et al., 2012). In the current study, observations were carried out in a press line which included a press machine followed by milling machine where the floors and walls were produced for different models of caravan. Observations were also carried out during daily meeting between supervisor and operators to identify whether the flow of information was encouraged from both the ends. After the root cause of problem was defined it was important to identify existence of these root causes in the line for the purpose of which initially observations were carried out in the press line to identify wastes which are visible. The findings from observations made has been presented in section 4.1.2 of this report.
2.3.2.2 Interviews
Interviews are one of the highly efficient methods used for data collection as the interviewer gets an opportunity to explore specific subject with personnel closely related to subject or activity carried out (Bryman & Bell, 2011). Interviews can be categorized into structured, semi structured and unstructured interviews (Williamson, 2002). For this study semi structured and unstructured interviews are adopted as they promote qualitative research and help the researcher to carry out an explorative study in the field of research (Saunders, et al., 2012; Williamson, 2002). In the current study interviews were carried out with operators, supervisor of the press line and production manager.
Production manager was the major source of data from the case company and was often interviewed about the queries arising regarding case, but the major outcome from the production manager was during initial interview where he specified about bottleneck of the line and also added how performance is often low in the line due to late delivery. Short structured interviews have been carried out with operators of the line to understand the problems associated with the line and also to analyze certain root causes arising which affects strongly on delays. These structured interviews were carried out by providing operators certain questions to be answered and has been disclosed in 9.1. Operators of the line were also quickly interviewed about the problems often faced by them because of which unnecessary stops occur in line. Further supervisor of the line
Methods & Implementation
was interviewed to confirm the results from observations and previous interviews. During this interview questions regarding percentage of defects occurring in the line, quantity of parts produced per day by the line when compared to its utilization and other areas pertaining to education and training of operators in the line were answered.
Table 2: A table representing interviews and its duration
Sl.no Interviewee Type of Interview
Issues addressed Duration Date
1 Production Manager
Unstructured Problems in the line 15 minutes 30/01/2020 2 Production
Manager
Unstructured Identification of Bottleneck
10 minutes 13/02/2020 3 Operator Structured Knowledge about
other operations in the line
10 minutes each
02/04/2020
4 Operator Unstructured Problems faced in the line
5 minutes each
02/04/2020 5 Supervisor Unstructured Training and
assigning roles of operators, production varieties and quantity, percentage of defects 20 minutes 24/04/2020 2.3.2.3 Production Records
Conducting a document analysis will aid increasing quality of research through triangulation method as it is considered as a quantitative method (Williamson, 2002). Although this study did not involve complete analysis of production documents, data received from the company with respect to stops occurring in the press line was analyzed to identify stops which occur frequently and their time intervals. A excel data sheet received from production manager portrayed the existence of number of stops in the press line which was considered a bottleneck as the line itself initiates completely assembly line by production of walls. This data confirmed the existence of stops and frequent occurrence of stops due to lack of resources available. Analyzing this data as per production manager guidance, stops occurring due to personal breaks, stops due to elements missing and stops pertaining to maintenance were identified. Although a number of unidentified stops were observed from the data it was informed by the production manager that at most of the times operators failed to input the reason for the stop which was materials missing or error in program code for the milling machine. The data from document analysis confirmed the existence of stops due to unavailability of the materials which was also observed during observations as operators were waiting for the resources from previous station and were also found looking for materials during process.
Methods & Implementation
2.3.2.4 Spaghetti diagram
Spaghetti diagram as a lean tool generally is utilized to identify the movement or motion of an activity or operator and further to reduce the unwanted movements carried out during the process to increase value added time (Gladysz, et al., 2017). The procedure also involves recording of time along with spaghetti diagram to accurately verify the time consumed for an activity performed (Gladysz, et al., 2017). Through spaghetti diagram the rectification in movements can be carried out by elimination of unnecessary movements in a process. In the current study spaghetti diagram was only used to identify the problem of unnecessary movements in case of their existence and hence was technique used in collection of data and was not utilized for solving the problem. As discussed above it was essential for the research only to identify if excess or unnecessary movements are created by the operator in the line at case company which did not involve any time studies. The process involved depiction of operator movements around the press line by drawing curves on a view of plant layout and further analyzing movements of operator by comparing the pattern obtained for different operators from two different shifts. The procedure utilized for this process was derived from Gladysz (2017) and is similar to it apart from the time studies and resolution of problem. The analysis of the derived pattern of curves from spaghetti diagram for different operators is further conducted in findings and analysis chapter of this study.
2.4 Analysis
As mentioned before study involved implementation of 5 whys tool at two different stages of report. When problem of delay was identified in the line first stage of 5 whys was carried out to identify root cause which produced existence of (7+1) wastes as result. Data collected requires effective analysis to produce an efficient output of results. Hence, the collected data regarding 7+1 lean wastes existing in the line was rated by considering its way of impact on delay, effects on the line and occurrence. The rating was provided as a collective input from both the researchers by considering all three factors discussed above. For each of the waste identified rating was provided in between 1 to 5, where 1 highlights no direct impact on delay and effect on the line, 1 also highlights waste unidentified in line and 5 highlights direct impact on delay and effect on the line by influencing nonvalue adding activities. Table 19 represents the rating criteria adopted for analysis and the factors influencing the rating provided for each waste is explained further in analysis chapter. After rating the identified wastes, second stage of 5 why analysis was carried out to further inquire root cause of each waste which was influencing delay in delivery of products. The second stage of 5 why analysis was carried out on each waste based on their evidence of existence and rating provided. At the end of second stage of 5 whys root causes of delay were identified which has been presented in section 5.1.3, for which recommendations have been provided in this study for minimizing them.
A figure below outlines process of analysis adopted for current study in a nutshell and provides a clear view on process of analysis. This figure also outlines all the methods utilized for collecting data from case company and analyzing them.
Methods & Implementation
Figure 4: A schematic representation of analysis of data from case.
2.5 Research Quality
The study includes a systematic process of data collection within a framework developed for this purpose ensuring the research quality and trustworthiness of the report to be maintained at higher standards. Internal Validity of the research will be high as the research involves qualitative data from a single case study (Williamson, 2002). Triangulation method is used for mixed approach (qualitative and quantitative data) in this study which will also influence in increasing the validity of the study (Williamson, 2002). Utilizing quantitative methods like spaghetti diagram analysis and document analysis along with observations and interviews from the case has provided grounds for triangulation method which increases quality of research. Systematic literature review technique has been adopted to explore literature from different sources and identify the precise data necessary for the study which adds on to external validity and reliability of the research. But the reliability of study could vary because of unstructured interviews conducted which has been controlled by conducting observations and analyzing production records.
Theoretical Background
3 Theoretical Background
This chapter briefs the theoretical background of the area of research. In this project the theory is used basically for two different reasons the first one is to provide a clear and deeper knowledge about the area of research and the factors influencing them. Later is used to analyze the problem with help of existing tools of lean philosophy in production system which enables solving the current problem.
The Figure 5 portrayed below demonstrates the requirements of theories discussed in this chapter and also explains how they are further utilized during research process in identification of problem and also solving that problem.
Figure 5: A schematic representation of theoretical framework of the research.
3.1 Lean Philosophy
The ever-growing competition among the firms in the global market is increasing due to which companies are bending towards an approach which gives more flexibility to face challenges (Zhang & Chen, 2016). Lean philosophy is an approach which focuses on improving processes, practices, quality, and performance (Hicks, 2007). It is a kind of framework which can be applied to a system to identify the critical areas of improvement in the form of wastes and defects. The lean philosophy deals with continuous improvement and hence identify different tools which can help in the process (Hicks, 2007). The philosophy hence focuses on eliminating the unnecessary actions and linking all the steps in creating value (Nurcahyo & Kristihatmoko, 2010). Lean philosophy also encourages just in time production for delivering right quantity of products at right time, along with elimination of actions which do not create any
Theoretical Background
value to end product (Lyonnet & Toscano, 2014). In general transformation, it applies techniques such as 5 why’s, SMED and other lean tools to eliminate the 7+1 wastes. This philosophy also helps in reducing the non-value adding activities and ultimately generating value to the process (Sternberg, et al., 2013). The advantage of adopting lean philosophy is it improves quality, speed, efficiency and cost reduction (Pinto, et al., 2018).
3.2 Lean Wastes
“Waste is defined as any and all resources spent beyond what is strictly necessary to perform a service or make a product (raw material, materials, human resources, time, money, energy, etc.)” (Cancado, et al., 2019). The companies today focus on productivity and the ways through which it is improved. To achieve higher productivity the focus is primarily on minimizing the activities those are non-value adding (Cancado, et al., 2019). To eliminate these wastes manufacturing companies are adopting the method of lean manufacturing. This lean approach helps in minimizing the unevenness of workload, wastages in terms of time, money and resources. Overall lean approach will help in improving productivity, speed, delivery etc. With the implementation of lean manufacturing several lean techniques are applied in which concepts of seven wastes can be taken (Hill, 2018).
3.2.1.1 Defects
The one of the most frequently occurring type of wastes is the product defects. The important factor to eliminate these kinds of wastes is to identify the reasons or causes for these defects to occur.These defects thus cause delays during the process having an adverse effect in the productivity and performance. Hence finding the essential solutions to eliminate the defects is equally important. Before finding the solutions, it is important to find the defects in the product, failing to do can result in decrease in brand value leading to loss for the firm (Nurcahyo & Kristihatmoko, 2010). Main reason for the defects is the process design (Essid, et al., 2018). Also, defects can be due to rework or scraps, to solve the problem identification of the issue that occur more frequently needs to be identified. Rectifying the process design, making the process smart to eliminate the defects can also be introduced. Defects results in extra cost as well and time which will decrease the productivity of the manufacturing firm. This kind of wastes do not add value for the money which will hence increase the manufacturing cost (Hill, 2018).
3.2.1.2 Transport
Movement of materials from a position to another position is generally referred as transport. Transport can lead to waste which occurs due to the movements of machines, tools, employees, inventory etc. Excessive Transport can have an adverse effect which can lead to financial loss. More transportation leads to greater time taken, this will in turn lead to delays hindering the further process. It is very essential to reduce the travel distance as to avoid any damage or failure in process or a product. More the distance covered by humans, quicker is the probability to get exhaustion. Transporting a material
Theoretical Background
is not value adding activity for a product, hence it is essential minimize the distance that is being covered for transporting the product. Lesser the transportation time, the production process also takes less time (Hicks, 2007).
3.2.1.3 Overproduction
Companies around the world different ways in production. Since companies prioritize time and money companies are leaning towards a lean approach. But when companies have idle workers it is a common approach companies adopt where they start producing without any order. This leads to producing products in more numbers rather than producing in exact quantity that is required (Hicks, 2007). Generally, companies have varied principles in production, however in a lean approach production is done based on the exact number of components that are required. Overproducing components can lead to increase in inventory and gradually leads to decrease in the value of the product. Producing components in the number that is required is a way to reduce overproduction. The possible reasons for over production to occur is due uneven scheduling and unbalanced workloads. Moreover the problem of overproduction can be dealt with use of takt time where takt time ensures that time taken for manufacturing is even between the workstations (Douglas, et al., 2015).
3.2.1.4 Waiting
Waiting refers to the lagging or halt occurring in a production process. This is also sometimes referred to as queuing. Waiting leads to increase in takt time and ultimately decreasing the efficiency and productivity of the manufacturing company. Waiting can be due to various reasons such as machine breakdown, different kinds of errors, insufficient availability of materials. The wastes in waiting also includes the waiting time of people for receiving the raw materials. Waiting thus leads to delay between the workstation bring down the efficiency of the process. Generally, the reason for these wastes to occur is due to the uneven production process which can also lead to inventory and overproduction. With lean approach it is possible to eliminate the waste. Use of effective lean tools to solve this type of problem is mandatory. Also, it is important to find the reasons that lead to these wastes and try eliminating it (Hicks, 2007).
3.2.1.5 Extra Processing
Extra operation that needs to be done for a component is termed as extra processing. In other words, extra processing is doing more work than required. In a manufacturing firm it can be due to addition of a process, component etc. Operations such as rework, reprocessing, handling of storage which are the consequence of defects, overproduction and excess inventory. The reduction of these extra processing adds value to the product and hence minimizing the non-value adding activities carried out during the manufacturing. To prevent these problems, one way to deal with it is to have more precision in the tasks that is being performed. Having a flexible approach is another way to deal with extra processing, this is performed with having more functionalities in the processes. More significantly producing items looking at customer requirement and quality for which production takes based on the quantity required (Hicks, 2007).
Theoretical Background
3.2.1.6 Motion
An unnecessary or an unwanted motion that an employee needs to perform such as looking around, reaching for items or piling up tools or components results in delay. This accounts to a nonvalue adding activities. Walking around the shop floor also accounts to the unwanted motion (Sternberg, et al., 2013). The waste can also be generated from unnecessary movement of machinery. The human waste created can be from lifting, stretching, walking, bending etc. Motion waste are seen as a negligible kind of waste but in reality, they play an immense role in improving the manufacturing firm. The strategy which can be applied to eliminate the waste is creating more in less space. This will help in less movement of workers which in turn results in decrease in manufacturing time as well as increasing productivity (Hicks, 2007).
3.2.1.7 Inventory
Inventory process is an having a great value in a manufacturing company. Inventory are generally classified into three categories the raw materials, work in process and the finished goods. Inventories are used to improve the productivity and profitability of the manufacturing firm. However, having a poor inventory can have an adverse effect. This can be due to the lack of idea on the amount required and already available in the warehouse. It is also important from the company to have proper and efficient communication between the departments to address the inventory problems (Cheng, 2017).
3.2.1.8 Non-Utilized Talent
From a long time, it has been stated that lean manufacturing is termed as doing more with less. Lean manufacturing has dealt with continuous improvement and the latest waste to be recognized is the skilled or the non-utilized talent. This is considered due to underutilization of the human talent in the manufacturing firm. Under-utilization occurs when there is bridge between the management and the employees. Some of the reasons for non-utilization can be due to poor training, lack of communication, pay structure (D’Antonio & Chiabert, 2018).
3.3 Lean Tools
The most common challenges today the companies face is the increased inventory, delays and other non-value adding activities (Meade, et al., 2006). Lean manufacturing will help in facing these challenges with the help of lean tools such as spaghetti diagram and single minute exchange of dyes (SMED). Lean tools help in improving knowledge and helping in turn with solving constraints and making further improvements (Zhang & Chen, 2016). Also, it helps drastically in eliminating the non-value adding processes and reduce other wastages that occur during the production (Benjamin, et al., 2013). With the help of lean tools, it is possible to improve productivity in a production process by changeover time reduction (Ahmad & Soberi, 2018). These tools also assist in picturing the possible causes leading to the specific problem and will be essential in improving the performance of the production process (Marius, 2012).
Theoretical Background
3.3.1.1 Root cause analysis
Companies all over the world deal with problems to which they try to find the solution. Identifying the reasons for the cause of these problem is an ideal way to deal with these problems. The best possible way to deal with this is to find the root cause for the problems to arise. Root cause analysis is a tool designed to help recount what happened during an incident. Root cause analysis can be made through different analysis tools such as pareto chart, 5 whys and the fishbone diagram (Ashok Sarkar, et al., 2013). The best definition to describe root cause analysis is quoted as follows:
“The most basic cause that can be reasonably identified and that management has control to fix” (Paradies & Busch, 1988).
The above statement mentions three terms which needs to be extracted further to get a conclusive to deal with the problems.
• Basic cause: Tries to identify the reason to why the problem occurred and drives to a corrective plan to rectify the failure. This is done to prevent the recurrence of the failure that happened (Paradies & Busch, 1988).
• Reasonably identified: makes sure the investigation for the failure that occurred is completed in the legit time frame (Paradies & Busch, 1988).
• Control to fix: It involves the management and higher level employees who have the rights to establish the controls, protocols and ways through which recurrence of the incident can be avoided (Paradies & Busch, 1988).
3.3.1.2 Five why’s
Lean philosophy today is at the center of operation management and quality improvements in the manufacturing firm. The driving force of the lean philosophy is the goal to eliminate the lean wastes that generated which can help in improving the productivity and reduce the non-value adding activities (Brown, et al., 2008). To eliminate these wastes identifying the root cause is an essential factor. To identify these causes in lean manufacturing 5 whys analysis is made. The 5 whys method is a way through which identification of causes of problems and failures are detected by asking a question why. By asking the question why, the greater number of times it becomes easier to understand the reason and come to a solution (Borkowski, et al., 2012). This helps in getting to the root causes of the problems. It will then help to get remedies to eliminate the problems faced by the manufacturing firm. The main advantage of this method is its ease of doing and the efficiency in terms of results. The method can be implemented in all the companies. Although, the it requires the logical thinking and problem identification (Borkowski, et al., 2012).
3.3.1.3 PDCA Cycle
In a lean philosophy, the major concern is the lean wastes such as defects and process that are being generated. To reduce it various tools, need to be used to get hold of these wastes (Maruta, 2012). The PDCA cycle plays a decisive role in implementation of
Theoretical Background
cleaner production. The PDCA cycle is a tool used to improve the quality of the products, eliminate defects and to develop improvements in the organizations. It is simple tool used for continuous improvements in the production processes in the organization (Sokovic, et al., 2010).
Figure 6: A figure explaining the process of PDCA cycle (Silva, et al., 2017).
PDCA is a stepwise change and can be understood as follows:
Plan: It is the initial phase of lean manufacturing where the management leadership must provide the necessary support in terms of money, manpower, resources and time to the lean team for successful implementation. This phase highlights the prospects for improvements are identified. The current approach is investigated with the help of data and probable reasons for the problems are identified for which possible actions to mitigate are provided (Silva, et al., 2017).
Do: This stage is the execution phase where the requires tools, concept and practices are identified and trained to the employees. This step is for implementation of the action plan. Here selection of the documents containing data are made. Also, the unexpected events that take place are also noted down (Silva, et al., 2017).
Check: This step acts as a check point to evaluate the lean performance. This is to analyze whether the lean changes made are effective and providing with the expected results. The expected results are analyzed. The new results are compared to that with the old results and decision is taken whether to continue with the new approach. This is decided based on the objective and goals that needs to be met (Silva, et al., 2017). Act: This is the post implementation phase where the lean practices are seen whether they can sustain lean outcomes for long term. This to standardize the improvements if the results are met and repeat to gather new data and reassess the interventions based on the amount of data required or the situation that exists. Another way is to abandon the current project and start with the new beginnings if the results obtained are not effective (Silva, et al., 2017).
Theoretical Background
3.3.1.4 5S
5S stands for sort, set in order, shine, standardize and sustain. Conventionally, 5S methods are used for setting the physical workspace and items by eliminating the waste. This method symbolizes set of practices which are ideal in developing workspace organization and productivity by adding value to the process (Gapp, et al., 2008). This method is employed as it is a low-cost implementation and a simple approach where it is considered a starting point for an improvement. When it is inspected on the geographical context it is important to look at the factors that affect the performance such as product type, size of the company, attitude in the organization towards quality and continuous improvements (Bayo-Moriones, et al., 2010).
Figure 7: A flow chart representing steps of 5S lean tool (Rojasra & Qureshi, 2013).
The 5S can be explained as follows,
• Sort: This means the removal of needless materials, tools, equipment’s and furniture’s from the shop floor. A criterion needs to be used to identify the rate of their use. As a result of this there is free floor space, an improved product flow, improved mobility and better communication is attained (Pinto, et al., 2018).
• Set in order: In this stage the idea is to keep everything in its place. Here it deals with the placement sequencing of items after the sort step. This in turn helps in eliminating the different types of wastes, also helping in improving the quality and reducing the level of inventory (Pinto, et al., 2018).
• Shine: This stage deals with the cleanliness of the workspace. There is a requirement of 5S job cycle chart list where the different tasks are represented. The frequency with which these tasks are to performed is listed in the chart. This step is essential in terms of creating a safer environment, reducing defects and also reducing equipment downtime (Pinto, et al., 2018).
• Standardize: The main purpose of this step is to maintain the previous steps by giving some time every day in order to maintain cleanliness, prevention of extra inventory and unwanted items in the shop floor. This will help maintaining the space around the workspace which can help free movements of workers (Pinto, et al., 2018).
Theoretical Background
• Sustain: To have an attitude towards continuous improvements this steps executes auditing procedures in the area were the 5S is instigated, there is also a program were the group of people combining with the team leader visit other places of the shop floor to have proper inspection on the things around them (Pinto, et al., 2018).
3.3.1.5 Spaghetti Diagram
According to the recent trend the manufacturing firms are trying to minimize the non-value activities which are resulting in losses. One of the primary objectives the companies take is optimizing the plant which will help in attaining more profit and providing with necessary facilities to take best possible benefit in total manufacturing of a product. One possible way to deal for plant utilization is with the help of spaghetti diagram. Spaghetti diagram is a lean tool used for identifying the paths, items or a process by using visual representation. With the proper implementation of the spaghetti diagram it is possible to identify movements and the distance between various departments (Gladysz, et al., 2017).
The process to draw a spaghetti diagram is as follows: 1. Creating a layout diagram of the facility
2. Obtaining or creating the current routing sheet of the object movement through the facility
3. Drawing the continuous curve from the initial location to the remaining locations.
4. Total distance travelled is to be calculated.
5. Estimation of time required for the travel is made.
6. Study of the spaghetti diagram drawn is conducted and identification of common travel areas and rarely used travel areas are identified.
7. Rearranging the processes to reduce travel distance.
8. Repetition of 4-7 steps making different assumptions and using new layouts. The above procedure for the drawing a spaghetti diagram has been derived from (Gladysz, et al., 2017).
3.3.1.6 Single-Minute Exchange of Dies (SMED)
Based on the global trend the manufacturing firms are experiencing significant development. There are also many reasons which drive the development in these manufacturing firms. Due to the flexible market where demands are not constant companies have a challenge of meeting these demands in the given time span. Companies offering different variant of products in other words customized products must deal with different changeover process. This leads to different products having different set up time which will then challenge the production facility to be more efficient in the process. To help deal with this SMED concept is adopted. SMED helps
Theoretical Background
in reducing the scrap, inventory and thus helping in improving the efficiency of the production process (Sugarindra, et al., 2019).
SMED is a lean manufacturing concept which helps in improving the set-up time by reducing the time taken in order to help the improve the manufacturing firm. This tool does not require much investment. Hence, it is considered to be cost efficient tool (McIntosh, et al., 2000). The application of SMED can be done in three steps,
1. Splitting internal and external activities (Pinjar, et al., 2015). 2. Modifying the internal setup to external setup (Pinjar, et al., 2015). 3. Simplify all aspects of set up operations (Pinjar, et al., 2015).
The initial step is conducted to analyze the details of the basic operations while the latter two steps were performed simultaneously (Sugarindra, et al., 2019). Before splitting the internal and external activities it is important to perform interviews with the workers to understand the process of changeover time and the set up time (Sousa, et al., 2018).
3.4 Delays
Continuous flow in manufacturing is an essential part in making the production efficient. However, it is seen that majority of the companies all around the world face the problem from delay (Mourani, et al., 2008). Delay is defined as the outcome of ineffectiveness and inefficiency of the products in a process leading to poor performance of the production unit (Arunagiri & Babu, 2013). It is very important in a production setup to have a timely and accurate rate of supply of components, accurate information to oversee the delay (Caprihan, et al., 2013). Also, efforts need to be added to integrate the delay in continuous flow processes. Companies often find delays in material handling, design changes, improper scheduling, testing and any other non-value adding activities which occur during these processes (Mourani, et al., 2008). The causes for the delay to occur is also due to the production lead time and transportation delays which could have major impact on the production process (Mourani, et al., 2008). Delay also occur due to the delay in payments, late procurement of materials, slowness in decision making, late delivery of materials (Abdellatif & Alshibani, 2019). Unexpected stops occurring in line can lead to disturbances in process leading to case delay. Various tools such as failure mode and effects analysis (FMEA), event tree analysis (ETA) etc. are being used to either eliminate or reduce the impact of the delay (Jones, et al., 2009). The impact of delay is seen to be high as it can impact performance measures in the form of customer response and work in process (Abdellatif & Alshibani, 2019).
Reduction of delay can be accomplished by adopting the various process improvement methods as stated below:
• Process improvement by design: The process improvement seen here is as a result of changes made in the process design. A well-designed process provides
Theoretical Background
results which are efficient, productive and keeps the customers happy. Solving problems does not relate to the changes in the design but it focuses on repairing the current design, reworks etc. This is a long process as constant changes need to be made depending on the type of problems (Arunagiri & Babu, 2013). • Process improvement through prevention: To change a bad design root cause
needs to be found out. Solving problems is a reactive approach wherein proper understanding of the problem to solve it is necessary. However, with the adoption of proactive approach a thorough understanding of the cause and the elimination of the reoccurrence of the problems is the priority. To eliminate these reoccurrences is to change the entire design. Higher percentage of companies however adopt the reactive approach due to factors such as deadlines, demand etc. In these situations, the priority will be to fix the problems. For this identification of the root cause of the problem is essential (Arunagiri & Babu, 2013).
• Process improvement through simplification: “Process improvement is about process simplification. Reducing defects and variance or shrinking cycle times and speeding up a process involve removing needless activities, time delays or design flaws” (Arunagiri & Babu, 2013). Contrarily, solving problem leads to addition of steps. However, process improvement is about prevention and avoidance (Arunagiri & Babu, 2013).
3.5 Time Variables
Production unit in companies are dependent on the various time variables such as process time, takt time and cycle time. These time variables are closely related to productivity and performance of the system and hence any sort of delay occurring in the process which effect the time variables will results in variation in performance in the system (Wu & Hui, 2008).
3.5.1.1 Process time
In the era of automation process time plays an influencing factor in a production set up. The effectiveness of production and the accuracy of cost which is been estimated is very much dependent on the process time (Nagahara & Nonaka, 2018). The process time is the actual time taken from the start of a process till the products have been transformed into finished products. Increase in process time inversely effects the overall production phase as well as the design area (Nagahara & Nonaka, 2018). The process time should be within the prescribed cycle time. The production rate also increases if the criteria is met. The reason for process time to exceed the cycle time is due the delays or que within the workstations (Veeger, et al., 2010).
3.5.1.2 Cycle time
With constant improvement around the global market and need for shortening the cycle time to boost up the production and to have a competitive advantage over the rival firms meaning cycle time is an important factor in today’s production setup (Li, et al., 2018). Cycle time is the amount of time taken from the start of the work till the item is being
Theoretical Background
delivered. Cycle time is also explained in terms of little’s law where work in process is divided by the throughput (Turpin Jr, 2018). For having a good enterprise resource planning (ERP) in a company it is important to have an efficient production planning. A well-designed production plan is always dependent on the cycle time, which hence makes it more important to have this function (Wang, et al., 2018).
3.6 Bottleneck
In a production setup there are various kinds of managerial problems are found. One that creates lot of buzz is the bottlenecks within a production process. Bottlenecks have a negative effect on performance in the shop floor (Thürer & Stevenson, 2018). To solve the adverse effect, it very important to identify the bottlenecks. Bottlenecks create lot of variation in a production process. The common reason for having bottlenecks are due to lack of workforce and machine failures. Bottlenecks further creates downtime within a process which causes delay in the system (Li, et al., 2009). Reducing a bottleneck is considered as the most effective way to improve a manufacturing system. In order to eliminate these bottlenecks, understanding the larger system is important as no system will move ahead than the slowest component (Slack & Lewis, 2005). Removing bottleneck can be either by eliminating or just acknowledge them (Johnston & Clark, 2005). The identification of the bottleneck areas and finding out the reason for their causes can be termed as bottleneck analysis (de Bruin, et al., 2005). The bottleneck analysis framework is dependent on four main factors: supply, demand, quality and the environment (Yawson, et al., 2017). Bottleneck analysis can be divided into two steps: to give importance to maintenance and production improvement activities. The first step includes the identification of machines in the production system which constitutes to the bottleneck. The second is to provide indicative insights into type of bottleneck (Subramaniyan, et al., 2018).
3.7 Just in Time (JIT)
Just in time is a concept which aims to meet the necessary requirements while offering perfect quality and zero wastes (Hirano, 2009). Also, just in- time production is one of the main lean principles under lean philosophy, which refers to producing only “what is really needed, when it is needed, and in the amount needed” (Lyonnet & Toscano, 2014). It also focuses on the pull flow production during the production based on the requirements of the customers. This system will help the manufacturing companies to manufacture products based on the exact number required. Thus, helping in minimizing the inventory space required, reducing the changeover costs and overproduction (Lyonnet & Toscano, 2014). Thus, manufacturing companies should improve their capability to produce maximum products at a high quality, within the required time and with the lowest costs (Thomopoulos, 2011). With the help of JIT it is possible to supply whatever materials is required and whenever required. JIT focuses mainly on reduction of 7+1 lean wastes which are present in the production process. JIT also emphasizes on continuous analysis of production line through lean tools such as 5S and SMED. This