No. 69 "1982 .
] Statens väg och trafikinstitut (VTI) -.581 01. linköping_ National Road & Traffic Research Institute 15-58101 linköping - Sweden
heInfluenceofroadroughness
on
drlver
, fiijiéfpeformanceandfat-_
paperpreparedbyDrPeter
. ff"
conference
f];
Isthere aConnectlon" atThe Umversutyof
~
* ft-"r fAnnArbor,January24 261982
'
_ue
_ __ __ ,_ &.
Arnbergforthe __
SABRIW
No. 69 . 1982 Statens väg och trafikinstitut (Vl'l) - 581 01 Linköping
National Road &Traffic Research Institute - S-581 01 Linköping - Sweden
The influence of road roughness on driver
performance and fatigue
A paper prepared by Dr Peter W Arnberg for the
conference Truck Ride Quality and Highway Safety
69
Is there a Connection at The University of Michigan,
FOREWORD
The author wishes to express his gratitude to Georg Magnusson who, together with the author, has carried out the studies, to Henry JeX (Systems Technology, Hawthorne, California), and Jack Sandover (Department of Human Sciences, University of Technology,
Loughborough, United Kingdom), who gave valuable
comments on the initial draft, and to Darwin P. Hunt,
(New Mexico State University, Department of Psychology,
Los Cruces, USA), guest researcher at VTI for about 2 months.
The influence of road roughness on driver performance and fatigue
by
Peter W Arnberg
National Swedish Road and Traffic Research Institute 8 581 01 LINKÖPING Sweden
ABSTRACT
Road roughness may be an important factor in truck accidents. The measurement of road surfaces and the relating of this information to accidents is a way to
find out if and how rough road surfaces lead to accidents. Before this can be done, however, more knowledge is necessary concerning how to measure the
features of the road surface which may be important for accidents. This knowledge can be gained either by directly asking drivers about what aspects of road vibration are contributing to a degradation in per formance or through actual performance and fatigue
experiments in driving simulators. The report is a
BACKGROUND
One of the most important factors for the quality and safety of truck driving is the effect of vibration
from roads. There are, of course, other factors such as alcohol consumption, poor friction, darkness
conditions and drowsing at the wheel which are also important for safety. In general, there is often
not only one causal factor in an accident; instead, the results from a complex interaction of events in which factors from the road, the vehicle, and the
driver or other road users play a part,
To determine the role of vibration in accidents,
statistical methods must be used. Before this can be done, however, extensive data concerning accidents involving trucks needs to be collected on a road
network, measured by means of accurate methods which
take into consideration vibration and other factors which are correlated with vibration. It is thus important to separate vibration effects from other factors which may be causing the accident, e.g.,
narrow roads, road tracks, etc. Otherwise, the effect
of risk from these other factors could easily be misinterpreted as an effect of vibration.
At the National Swedish Road and Traffic Research Institute (VTI) work collecting data on the road network has been carried out since the institute was founded. A road data bank where all paved roads are described according to a number of variables, e.g., road geometry and width, has been built up
at the Swedish Road Administration Office. Follow up surveys every third year have also given road surface data; in the beginning these were collected by means of subjective judgements, but gradually
have been more objectively measured, including
profile, tracks, friction, packing and cracking.
The survey will now be carried out by means of a special measuring car which can measure all of the
variables simultaneously, while driving at the normal traffic speed. Several years ago, the Swedish National
Road Administration, in collaboration with Saab
Scania AB and VTI, developed such a vehicle. Two
cars (The Saab Road Surface Tester) were used in the 1980 survey, and the results convinced officals in the road administration department that a system like this was a necessity.
A technical evaluation, questionnaires and interview studies with 25 surveyors who used the cars were
very positive, but also indicated the need for further development, especially with regard to minimizing
maintenance of the vehicle (Arnberg, 1980). Several years' work with non contact (infrasound and laser) methods at VTI has been used in developing a new
version of the Road Surface Tester (Arnberg, 1981).
This new instrument will be evaluated and compared
with the earlier Saab RST in the 1982 survey (see
figures 1 7). The data from the 1982 survey will be used in the road data bank for correlation with
accident statistics.
It is, however, necessary to have clear hypotheses about cause effect relationships before the
statistical study is carried out concerning the nature of vibration, e.g., whether effects occur immediately, after a short delay, or perhaps even as after effects on a smooth road following a rough one. Another important question concerns what aspects of the road surfaceare causing the type of vibration that is important for accidents. To answer these questions, a number of experiments have been carried
out, both on actual roads and in road simulators.
This paper will briefly describe two simulator experiments and ten years of on the road studies
carried out at VTI.
The general hypothesis for the above studies has
been that driver discomfort from vibration correlates highly with all the factors which determine accidents. In many studies direct questions to man have been
proven to give surprisingly valid results. In this
area, where so little is known concerning the effects
of uneven roads on man, man vehicle interaction,
goods,<etc.,there seems to be little else to do than to trust man himself. Simulator and driving
experiments, however, are necessary in order to more
fully understand the role of comfort in relation to driving performance. This will be discussed more fully in a subsequent section of the paper.
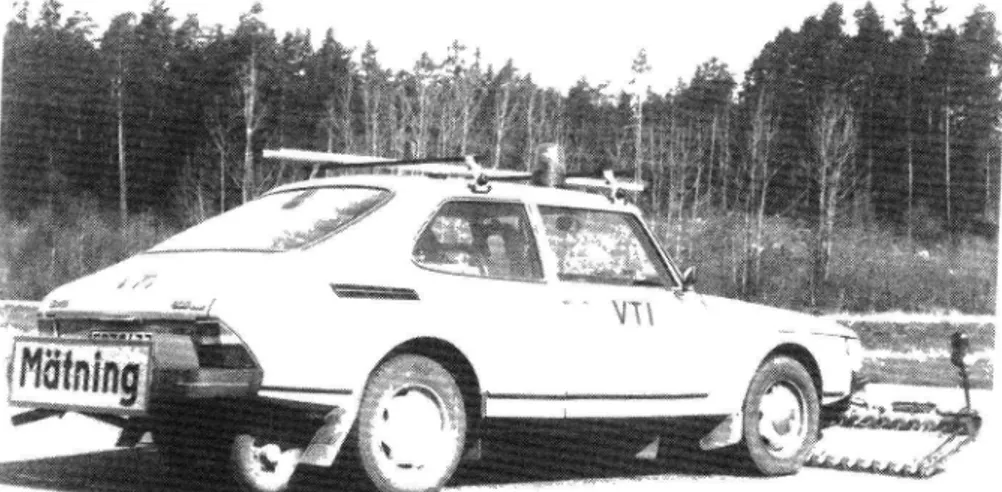
Figure 1 The Saab Road Surface Tester. Evenness is
measured on a nine grade scale with nine as the roughest road. The system reliability of the roughness measurement is about 0.95,
independent of what speed is used (from 30-9O km/h). The validity of the instrument is also high, in most of the studies close to 0.95(see, e.g., figure 3).
TA PE RE CO RD ER an d PR lN TE R _ _ _ _ . N . L A T E R A L A C C E L E R O M E T E R an dG YR O
CO
NT
RO
L
PA
NE
L
I
[?
?/
L
m
m
»
RU T DE PT H R O L L E R S T h e m a i n c o m p o n e n t s o f t h e m e a s u r e m e n t F i g u r e 2 W A T E R T A N K ( f o r fr i c t i o n m e as u r e m e n t ) CO MP UT ER UN IT VE RT IC AL AC CE LE RO ME TE R TE ST WH EE L s y s t e m of t h e S a a b R o a d S u r f a c e T e s t e rUncomfort able lO 9. 8- 7-U Z H e 6.
&
_Acceptance level%*
% 5 .
m 2 O U 4, O G)3
.Q
x,? 2. eff ff . O Comfortable]. . f/t G) 1 _j 0 Smooth Figure 3 .50 1.00 1.50 2.00 2.50 3.00 3.50 4.00 Rough ROAD UNEVENNESS (RMS)The relationship between the subjective comfort rating and the natural logarithm of the mea-surement of road unevenness obtained with the Saab Road Surface Tester. Each ring represents a road measured with the Saab RST as well as rated by 10 subjects according to the relative judgement method. Absolute judgement from
other studies indicates that road users accept
and are willing to pay to keep primary roads less rough than 5.5 (2.5 according to the Chloe meter). Primary roads are, according to results from interviews, judged more from a safety point of view than a comfort one, while the European roads are expected to be more or less perfect in all respects. The results provided by the Saab RST are
automatically calculated from the RMS and
vehicle Speed and converted to a nine grade
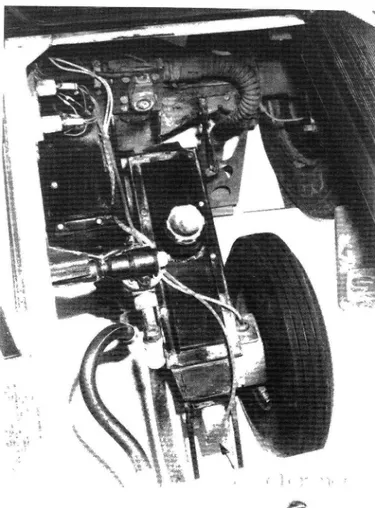
Figure 4 Accelerometer mounting on the test wheel for continuous measurement of the vertical acceleration of the test wheel. The test wheel is hydraulically regulated to maintain
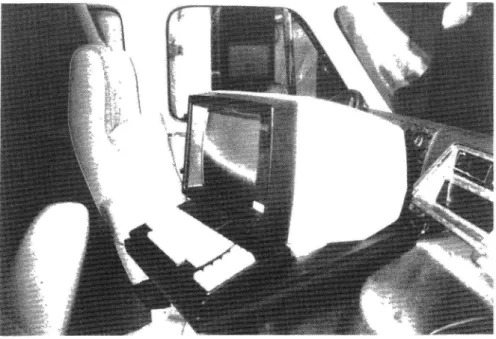
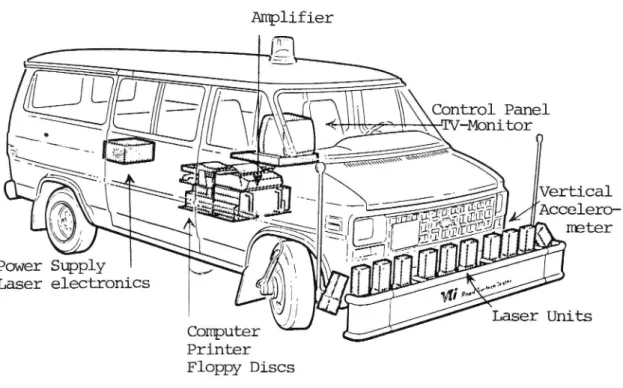
Figure 5 The interior (computer and printer) and mea surement system of the Laser RST. The laser component consists of eleven laser units for
rut depth and roughness measurement. It is 2.5 meters wide and measures a width of 3.1
HNJ)SUREMIETESEHQ Amplifier
Cm xollkmel \ DJ\s* $'%-"= ' _ ; \-. (| . \ FX ._ 4 / \ 1 I vertical fAccelero Pomerqx y Laser electronics
Printer Floppy Discs
Figure 6 Description of the Laser RST
Mean profsle z e -60 47 29 89 39 10 78 133 -186 9 Mean deviation : B 47 59 55 46 64 89 113 116 91 G H 25 of 88 profoles Mean depth > 18mm (%> > 26mm (Z) Trad 198 85.8 43.7 Ratskiva 217 168.6 48.7 (RMS) =362.34
Comfort Maine H: Bai it A H
Figure 7 Printed output from a road profile (3.1 meters) and rut depth measurement. A mean profile
and its standard deviation over 100 meters from profiles taken every 5 meters is given
(speed from 0-110 km/h). Trad Ratskiva,and
RMS are different methods for calculating road tracks. Each profile is calculated and the percentage exceeding a depth of 10, respective 20 mm is printed out. The bottom row shows the comfort mean on a 9 grade scale with the standard deviation.
10
EXPERIMENTS AND EVALUATIONS ON ACTUAL ROADS
In a series of publications, the effects of road
unevenness on driver comfort and performance as well
as on vehicle handling have been shown (Arnberg, 1973; Magnusson and Arnberg, 1976; Arnberg, Carlsson and
Magnusson, 1978). A number of instruments for evenness measurement as well as their operating principles
have been compared in a further series of experiments. The different measures of road unevenness obtained with these instruments on a sample of road sections with different degrees of unevenness have been compared to the discomfort experiences of drivers and passengers in passenger cars, trucks and buses when travelling
on the same road sections (Magnusson and Arnberg, 1976; Magnusson, Arnberg and Pettersson, 1977).
Foreign standards and requirements for road evenness
have also been described (Magnusson, 1976).
In the above mentioned studies, driver discomfort was
the dominating factor in evaluating unevenness. There
are, however, some problems associated with this. Too
many factors influence man's experience of discomfort,
e.g., body size, degree of sensitivity, the vehicle's condition and speed, the type of unevenness and the subjects' expectations. A person who is asked to
evaluate a road as acceptable or not may be influenced not only by the above mentioned factors, but also by
his earlier experiences, e.g., on what roads and in
what cars he has driven before testing. Evaluators
having different frames of reference may have different opinions concerning what physical parameter really
constitutes the sensation of discomfort. Large verti
cal movements which are easily observed might, e.g.,
influence the evaluator's judgements, although they are not in reality giving any significant contribu tion to the sensation of discomfort (see Arnberg and Hellström, 1973, concerning the stimulus fault). When
11
making subjective evaluations such as the perception of discomfort, there is furthermore the problem of man's ability to make reliable judgements.
Experiments have been carried out in the area of psychophysics to study what type of information man handles well or poorly. It has been shown, e.g., that making absolute judgements is a difficult task. Man
is more likely to see specific stimuli in relation to
the nearest environment and is, therefore, well
equipped to compare stimuli presented simultaneously or near simultaneously. This limit in absolute judge ment has been accepted and, instead, man's skill in comparative judgement is being used in psychophysics
as a basis for developing different evaluation methods.
Magnusson and Arnberg (1976) presented a special method for the evaluation of unevenness based on this knowledge. It proved most suitable to divide the judging task into two parts:
1. Relative judgements: Direct comparison of comfort on road sections having different degrees of
unevenness .
2. Absolute judgements: Judgement of an evenness standard felt to be acceptable for specific types
of roads and cars.
The results from the relative judgements were highly
reliable, i.e., the different evaluators' results
were similar and showed that the relationship between the experiences of discomfort on roads of varying degrees of unevenness was basically independent of:
a) the evaluator's function (i.e., driver or passenger)
b) vehicle speed c) vehicle type
12
The most uneven road was thus judged to be the worst road in all vehicles and under all conditions which were tested in the two experiments (Magnusson and Arnberg, 1976) (see e.g., figure 8).
The results from the relative judgements gave new insight into methods using technical means which
would be suitable for the measurement of road unevenness on a scale directly related to man's sensitivity to
road unevenness. In the Saab RST, road unevenness
was measured with the aid of an accelerometer. The advantages of this simple method were its low cost as well as a speed and vehicle independent method. The absolute evaluation was shown to be highly
dependent on all variables that were studied, e.g., vehicle type, speed, and the activity of the evaluator
(e.g., driver or passenger). As expected, the
requirements for acceptability were greater when the evaluation occurred in a truck than in a passenger car. The requirements for acceptability were also
much greater on inter European roads than on, e.g., national trunk roads.
A comparison of these evaluations and ISO Standard 2631 was also made (see figures 9 and 10 for a description of the methods used). The Standard is essentially based upon the results from experiments using simulators where the subjects are exposed to sinusoidal vibrations of varying amplitudes. The subjects can, thus, by means of the musculature, tense different parts of their bodies in order to protect themselves and, more or less depending on the degree of resonance, reduce the effects of the vibra tion. Arnberg (1973) refers to this activity as
"anticipation effects". Real life road roughness,
however, gives rise to vibrations of a much more random nature, whose influence is more difficult to
13
reduce by "preparing" the body. Random vibration should thus, according to the hypothesis about
"anticipation effects", be experienced as more uncom
fortable than sinusoidal vibration. In turn, the
"anticipation effects" should be more pronounced for
sinusoidal vibrations of greater amplitude (which cause enough discomfort to protect oneself against
them) than for those of lesser amplitude. An exception to this is if the subject is exposed to a clean
frequency and one organ's resonance effect is found.
This, however, causes such great discomfort that
without muscle tension and a change of position, subjects cannot tolerate it. The ISO Standard has
not been built on this type of resonance effect; if so, it would have been much more strict.
Magnusson and Arnberg (1976) showed. that for smooth
roads where the "anticipation effects" should be less obvious, a higher vibration level was accepted than is indicated by the "reduced comfort boundary" of the ISO Standard. This could be expected since
this evaluation was done under natural conditions,
i.e., in a situation where the subject did not concentrate on the vibrations or try to experience unpleasant sensations that do not normally exist
(as in a stimulus deprivation situation). On rougher roads, however, where the "anticipation effects" for
discrete frequencies should be greater, the results
approach the "reduced comfort boundary".
The Arnberg Magnusson team has recently carried out some new experiments. In a test concerning the level
of road unevenness which subjects judged as giving
an acceptable degree of discomfort, subjects were
asked to keep in mind the costs an improvement would
call for, considering that, to a certain extent, these
14
a tax on gasoline prices). In these studies it appeared that the acceptance limit was similar to that found in earlier studies (see Magnusson and
Arnberg, 1976). Of course, this would depend on how
high the improvements costs are. The establishment of a realistic road improvement-cost relationship is a critical point and the cost will vary according
to a number of factors.
In summary, the results showed a good agreement with ISO Standard 2631 when considering the plausible influence of "anticipation effects" and "stimulus deprivation" on the Standard. The ISO Standard, how ever, is a general standard for all types of vibration conditions and is not therefore directly applicable
to road vehicles. mu3data pmesentedébove indicates
that when the ISO Standard is applied to road vehicle
vibration, higher levels of vibration can be accepted
before discomfort occurs than these recommended in
the standard.
More importantly, however, the results showed that
it was possible to develop a measurement instrument which objectively, safely and quickly can measure the road network and which correlates highly with subjective ratings. Thus, the relationship between
accidents and such ratings can be carried out. The
system also measured other road surface variables which may be important in evaluating the accident-road roughness relationship.
U n c o m f o r t a b l e 9 burie m H axogmoo C o m fo r t a b l e R a t in g s p e r f o r me d in p a s s e ng e r c a r s 0 R a t in g s p e r f o r m e d in t r u c k s x )( XÖ )(9 Ro a d S e c t io n N o E i g u r e 8 R a t i n g s o f t h e g ene r a l e x p er i e n c e o f dis c o m -f o r t w h e n d r i v i ng o n r o a d s r e p r e s e n ti n g v a r y i n g d e gr e e s o f r ou g h n e s s . C o m p a r i s o n b e t w e e n r a t i n gs c a r r i e d o u t in p as s e n g e r ca r s a n d in t r u c k s. CX X. _ 15
16
-A( ovobyaoé
Axoéooo + 9
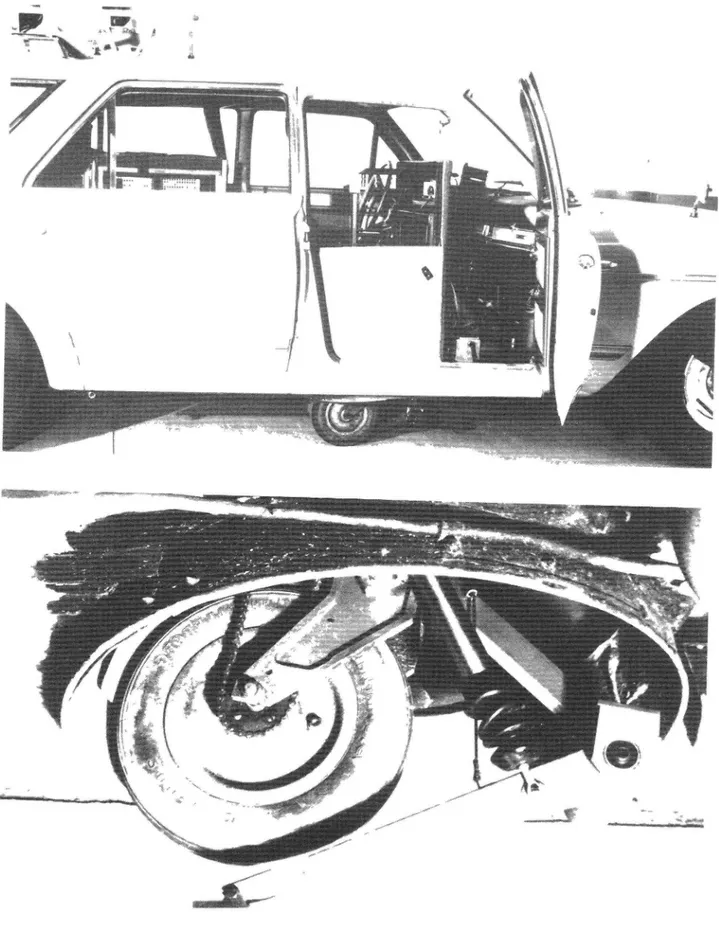
Figure 9 The interior of the GM profilometer and the road following equipment (wheel and trailing arm)
17
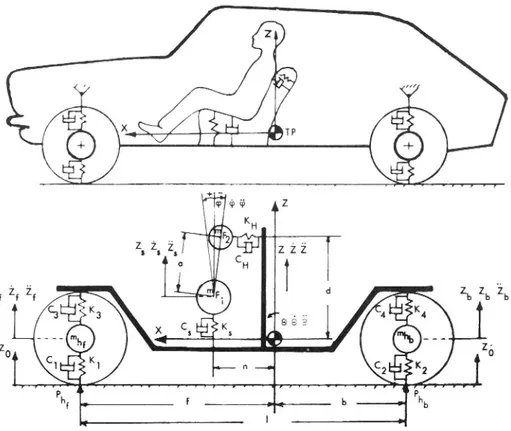
Figure 10 Diagram of the vehicle model used for the determination of vertical accelerations on
the driver seat, weighted according to ISO
Standard 2631. Today, direct measurement of vibration is also carried out on the floor and seats of the vehicle according to
methods recommended by ISO 2631 whole body
18
THE INFLUENCE OF ROAD ROUGHNESS ON DRIVER PERFORMANCE AND FATIGUE IN SIMULATION EXPERIMENTS
The comfort hypothesis, i.e., the use of discomfort as an indication of performance degradation (as used in the road experiments at VTI a well as in the
ISO 2631 whole body vibration standard) has not been sufficiently tested empirically. Such testing is necessary because som experimental findings have shown that performance degradation can occur even prior to the experience of discomfort. To do a com-plete evaluation of this question is virtually
impossible if one considers all the types of perfor mance which can be influenced by vibration. It is
possible, however, in a road vehicle simulator to at
least study the effects of vibration on driving performance and to relate this to the experience of discomfort in the subjects. Simulator experiments studying driving performance have been carried out at VTI; one in a car simulator (Arnberg and Åström, 1979) and one in a bus simulator (Morén, Arnberg, Magnusson and Sandberg, results to be published in 1982). This section describes these two experiments.
19
METHOD Subjects
The subjects in the first experiment were 30 ordinary
drivers, both male and female who had driver's
licenses for ten years (mean age of 30 with an age range from 22 to 46 years). The subjects in the second experiment were 48 bus drivers, both men and women, from a medium sized city. The mean age of the subjects was 35 and they had driver's licenses for a mean of 15 years. All the subjects were highly
motivated, as they were paid in accordance with their performance. The payment was variating between
50 l00 US dollars for each subject. This
was felt to be necessary in order to eliminate the factor of "wanting to help the researchers to obtain good results". Although paying the subjects may have
resulted in an increase in motivation, this is not
necessarily seen as being disadvantageous in the present case because subjects can be expected to be less motivated in a simulator task than in a real
life driving task. Procedure
The subjects in both experiments drove on a four lane road in a film simulator (Figures ll and 12). They were seated in the front half of a passenger car
(Experiment l) or a bus (Experiment 2) and the driving
tasks were designed to be similar to those encountered
during actual driving conditions.
Each experiment consisted of three phases a pre test,
a test, and a post test phase. Ten of the 30 subjects
in the car experiment were assigned to each of three different groups. Two of the three groups were
two hour test phase and the 40 minutes post test phase (Figure 13). One of these two groups was
subjected to a narrow band of floor vibrations
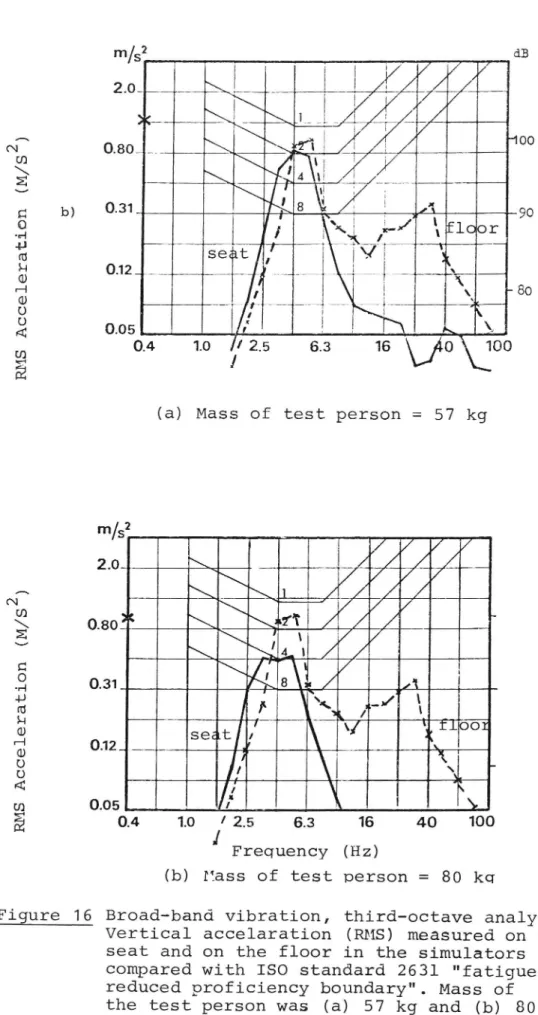
(Figure 15) and the other to a broad band (Figure 16). The low amplitude vibration was presented to all
three groups during the 20 minute pre test phase and to the third group (a control group) in all three phases.
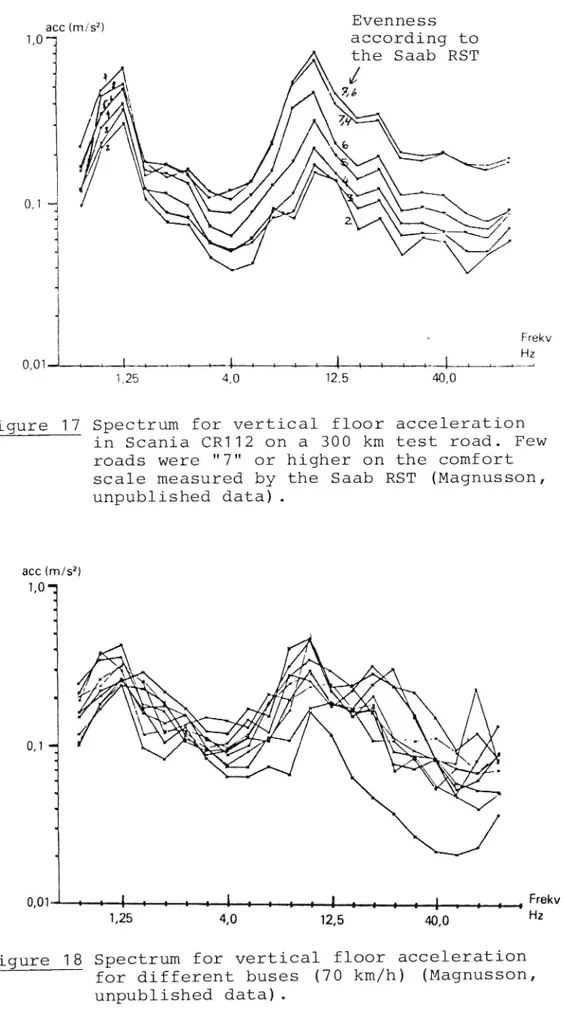
In the bus experiment the subjects were exposed to vibration as well as to noise (N) and infrasound (I). The vibration amplitudes used were taken from
extreme values of Huameasured bus vibrations
(Figures 17 and 10). Six of the 48 subjects employed in the bus experiment were assigned to each of
eight groups. All groups in this Experiment 2 were
exposed to the low levels of vibration, noise, and infrasound during the 25 minute pre test and during the 25 minute post test phases (Figure 14). The eXposure conditions for the eight groups during the 3 hour test phase are shown in Figure 19.
In both experiments, driver performance was measured
by a) the root mean square, RMS, error which is an
index of how accurately the driver steered the vehicle and (b) the reaction time of the subject when a surprise stimulus was suddenly presented
which is an index of how quickly the driver reacts to an unexpected event. In addition, each subject
completed a written questionnaire and was briefly interviewed immediately following the post test phase.
22
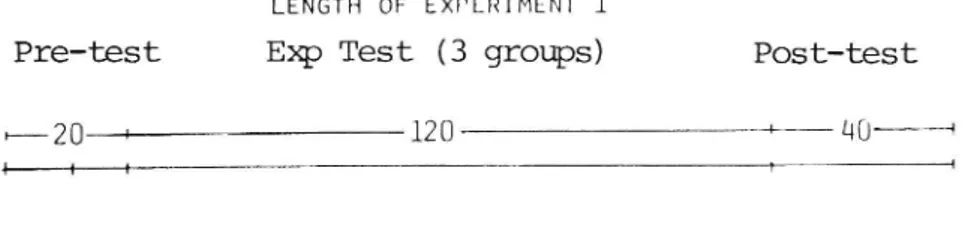
LENGTH OF EXPERIMENT l
Pre test Exp Test (3 groups) Post test
!
Ti ? . _ __.l
EXP GROUPS GIVEN ISO 2631 2 HOURS LIMIT FOR PERFORMANCE
0.80 m/s2
Figure 13 Time duration (in minutes)of the three phases Experiment 1. Three experimental groups were given ISO 2631 2 Hours' Limit for performance 0.80 m/s
LENGTH OE EXPERIMENT 2
Pre test Exp Test (8 groups) Post test
F 25 * 180 25 i
EXP GROUPS GIVEN ISO 2631 1.5 HOURS LIMIT EOR PERFORMANCE 1.00 M/S2
Figure 14 Time duration (in minutes) of the three
phases of Experiment 2. Eight experimental
groups were given ISO 2631 3 h urs=180 min limit for performance 1.00 m/s
23
Infra Sound
llO dn (IL)
Vibration Noise 80 db (IL)
1.0 01/52
80 db (A)
=
n=6
65 db (A)
=
n=6
0.03 m/52
80 db (A)
=
n=6
65 db (A)
=
n=6
FigJB The exposure conditions for the 48 subjects in experiment 2 (the bus experiment)
24 20__ := NAm L _1oo ?? 080 G 'r I V 0.31 __ _ _ _ $O : o H
122
0112
,
a
H 'x£?
\ f
o i D 005 _ i ; KL. A-Jt/ X x,. mum}å
o 4
m
2.5
a 3
RX «am & En
& Frequency (Hz) _ ä(a) Mass of test person = 57 kg
nyg
/ / V Y"
\\\|
\
/ / // l .
$
\
/ /
_
0.80 \\ -_..._J}__ , A%/ __.\Kh
\
//
RM S A c c e l e r a t i on ( i n M / S % XII T 031 seat ! /
f
x
.
f \ __ __ ( '") JT_LUK1)Li
0605 & &- Jl &_): i
0.4 1.0 2.5 6.3 16 40 »100
Frequency (Hz) Xx (b) Mass of test person = 80 kg
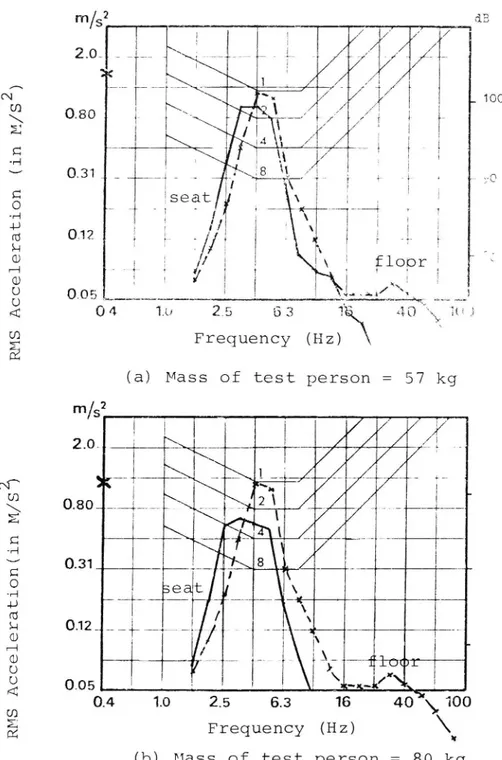
Figure 15 Narrow band vibrations, third octave analy sis. Vertical acceleration (RMS) measured on the seat and on the floor in the
simulator compared with ISO standard 2631 "fatigue reduced proficiency boundary".
25
m/s2 dB 20 >. ,N 400 N 0.80__ m \
5
o T" Afå
seat "
V
;(
H 0.12 & (D X;;
U
/7
/,
Lia
&
-80
2 0.05 .; . » N 1x\-m
0.4
1.0 //2.5
6.3
16
o
100
e
1
E
(a) Mass of test person = 57 kg
amg 0.80 031 0.12 I I : 0.05 0.4 1.0 ' 2.5 6.3 16 40 100 R MS A c c e l er a t i o n ( M / S Z ) Frequency (Hz)
(b) Mass of test person = 80 kg
Figure 16 Broad band vibration, third octave analysis. Vertical accelaration (RMS) measured on the seat and on the floor in the simulators
compared with ISO standard 2631 "fatigue reduced proficiency boundary". Mass of
26 Evenness ccording to the Saab RST
*
.!
acc (m/sz) J q # \\ 25 ' "ä/
z& Z
6 N _./,-' . '. 0,1 - : .. 2 \ \\///-Frekv 0,01 '. . 1 + . + *. 1 4. 4 + . J 4. I. i ; 1 . . . HE1,25
4,0
125
40,0
Figure 17 Spectrum for vertical floor acceleration
in Scania CR112 on a 300 km test road. Few
roads were "7" or higher on the comfort scale measured by the Saab RST (Magnusson, unpublished data).
acc (m/sz)
_ Frekv
01 - - l . . . . l . . . l I l .
0, - - , . . - . . . . - - . : : : : . - ; v
Figure 18 Spectrum for vertical floor acceleration
for different buses (70 km/h) (Magnusson,
27
Results
The results from interviews and questionnaires con firmed that most drivers experienced the Vibrations as being realistic. Vibration was also perceived of as giving performance degradation and fatigue by most of the subjects. The subjects who received lower
levels of vibration, however, were also nearly as fatigued by the end of the experiment.
The allocation of subjects to experimental and control groups in Experiment 1 was done ahead and the subjects in the experimental group appeared to be slightly better in steering performance (Figure 20k During the experiment both groups improved, and
during the post test the control group subjects
continued to improve. The subjects in the experimental group, however, showed worse performance during the post test. This was considered to be an effect of fatigue or perhaps an effect of the feeling of relief
from the cessation of the vibration.
Steering performance was not negatively influenced by noise, infrasound or vibration Experiment 2
(Figure 21). As can be seen, subjects exposed to the lowest levels of noise and vibration performed worse, indicating that the effects of vibration were mainly seen in the tendency to produce arousal in the subject. In contrast to Experiment 1, no post test effects
were found, perhaps because the bus drivers were more accustomed to vibration in their daily work as well as because they were exposed to less vibrations of 4-6 Hz frequencies.
In simulated surprise situations the reaction time increased in the first experiment for subjects in the experimental groups (Figure 22), especially with
28 RMS deviation Poor LOJ n9 L8 8 17_ Exp groups ;: N=20 m E 1,6 H
&
u u5 m D4 1,4 m.5
1,3
m o , o h2 Control glOUP 4.) m u1 N==20 no ; r T I | I |Preexp Exp After exp
Experimental phases
29
Difference in
steering performance (RMS) deviation from pre exp
Worse pe formance 20 Pre te%t Ifwel ' Better perforge. mance r _.
Bu_______g Low Vibration, Low Noise . [A ______ A_Low'V'ibration, Low Noise
x _____ _* High Vibration, Low Noise
A +_ _____ .+ High Vibration, High Noise
+b
r T' r f T
1 2 3 T +q r 5T T # T
Experimental Test (in l/Z hour periods) POquESt
Figure 21 Differences in steering performance from the pre-experiment phase in Experiment 2.
Both infrasound conditions are combined
R E L A T I V E R E A C T I ON T I M E T O +0. +0. +0. [X ) -Pre test 30 EXperimental Groups (N=20)
Xx
level
/LJ
/ /G
]*
D/
Control Group (N=lO)
I 1 | ,
l 2 3 4 Post test
Experimental Test
(in l/2 hour periods)
Figure 22 Difference in reaction time (in seconds) in the surprise situation during the test and post test phases compared to the pre test phase in Experiment l.
31
the accelerator. This delayed reaction was observed in the very first part of the experimental test phase but did not worsen significantly during the two hours
of vibration exposure, as would be expectedldased
upon the ISO Standard. It also disappeared immediately in the post test. In the experiment with the bus
drivers however no such effect was found, not even
in combination with the sound and infrasound stressors (Figure 23).
When analyzing the results it was found that the increased reaction time for the experimental group was due to the delay in the upward foot movement
(Table 1); observe that the reaction time of the
upward foot movement returns to normal in the post test. The observation (Table 1) that the 5 Hz, but not the 20 Hz, vibration shows a definite negative affect on foot reaction time may explain the lack of performance degradation in the bus experiment where a vibration frequency of 5 Hz occurred
infrequently.
In the final performance test the subjects were
required to maintain a speed of 90 km/h. Ability
to perform this task was not influenced by vibration
in either experiment. Pulse, blood pressure,
adrenalin and nonadrenalin measurement (from urine
samples) did not show any effects of the vibration. The final analyses of Experiment 2 have not, however, been carried out and some smaller changes in the
32
Reaction time in seconds
(difference from
the pre exp)
g____ B Low Vibration, Low Infrasound
0.1 i .a ... .a Low Vibration, High Infrasound
x _____ -x High Vibration, Low Infrasound . + --- -+ High Vibration, High Infrasound
0.0 * A A X 0J + + El J 0.2 d J _0 3 f r r r t f T f ' PERIOD 1 2 3 4 S 6 E Post test
Experimental Test (in l/Z hour periods)
Figure 23 Reaction time results in the surprise situation for Experiment 2.
Differences in reaction time (in seconds) in the surprise situation during the test and post test phases compared to the pre test reaction time. Both noise conditions
33
Table 1. The reaction time (in seconds) of the upward foot movement in the surprise situation (Experiment 1).
Group Pretest EXE Test Post-test
5 Hz 10 0.17 0.26 0.20
20 Hz 10 0.13 0.19 0.14
34
DISCUSSION
To be able to determine the relationship between road
vibration and safety, it still seems reasonable to
use discomfort as an indication of the influence of vibration on man. Performance and fatigue tests
results from simulator experiments at VTI do not seem to contradict this hypothesis. Where discomfort has not been indicated, no performance degradation has
been found.
With reference to the collection of road surface data, an instrument should be used which is validated with comfort data as experienced by man and which has the
following measurement properties:
1. Direct access to measurement data. The measurement
data should be accessible immediately following the measurement of a road object. This enables immediate evaluation of the accuracy of the data while the possibility of repeating the measurement
still exists.
2. High measurement capacity. Various road surface parameters which correlate with evenness should be measured simultaneously and at high velocity. 3. High reliability. The measurement system should
give repeatable results. Occasional faults should be indicated automatically.
4. Good service facilities. The measurement system should be based on easily interchangeable modules which, in case of failure, can be supplied quickly by the service organization of the vehicle manu
35
5. Standardized calibration. Standardized methods and
routines for calibration of the measurement system should be developed to assure reliable measurement
data. This is of course a vital point. The reliabi lity and validity of the measurement results are entirely dependent on the existence of standardized calibration methods and the carrying out of these
methods in detail.
The road surface data should be used in connection
with other road, traffic and accident data. Direct
effects as well as after effects of vibration should also be considered as well as whether the vibration occurs at a stable level or consists of a few
randomly occurring bumps which could surprise the driver and thus result in road accidents. lore experiments considering performance and fatigue in the vehicle simulator are clearly needed to clarify
the statistical hypothesis about road roughness and
safety. It is also necessary to expose drivers to different types of vibration during longer periods
(e.g., an entire day). Drivers can in this way serve
as their own controls enabling different hypotheses to be tested and a situation closer to that of the normal truck driver to be simulated. A new visual
system (a projecting television and data system)
has been developed at VTI which is a better and more
flexible method than the earlier film method (see
figures 24a and b). Using this system, different roads can be varied and more realistic driving conditions and surprise situations simulated, e.g., wild animals
suddenly crossing the road, the appearance of sharp, unexpected curves or parked cars on the road, etc. Studies involving ratings by man and by driving perfor mance in simulator experiments have an important role to play in determining which variables should be fo cusedcniin statistical studies correlating accident
36
and road data. Without understanding more about the influence of vibration on man no answer to the question
concerning the relationship between road vibration and truck safety can be given.
Finally, the author wishes to point out that even if
the effects of vibration on safety are relatively
small, when seen together with other effects of vibra tion such as increased gasoline usage, damage to
buildings, sound disturbance in vehicles and surround ings and road degradation, there is good reason to
measure and maintain roads at a fairly high evenness
standard. Exactly what this evenness standard should be will still require many years to determine, involving a scientific approach in which road measurement
instruments, simulator studies and statistical methods
The new
surprise situat'mulatorlOnS
Flgure 24 Sl .
Above one of the
38
REFERENCES
Arnberg, P W. Litteraturgenomgång och diskussion av vägojämnheters betydelse för komfort och presta
tion. Statens väg och trafikinstitut, Intern
rapport 134, 1973.
Arnberg, P W, Carlsson, G and Magnusson, G. Inverkan
av vägojämnheter. En problemanalys, Statens väg
och trafikinstitut, Meddelande 95, 1978.
Arnberg, P W and Hellström, Å. Betydelsen av "stimulus felet" för ISO och VDI komfortnormer vid till
lämpning på vägojämnheter. Stockholms Universitet, Psykologiska Institutionen, Promemoria, 1973.
Arnberg, P W and Magnusson, G. Jämnhet och spårdjup
samt subjektiva bedömningar vid provinventeringen 1979. Statens väg och trafikinstitut. Arbets rapport 1979.
Arnberg, P W and Åström, G. Vägojämnheters inverkan på bilförares prestation och trötthet. Statens väg och trafikinstitut. Rapport 181, 1979.
Arnberg, P W. Inventering med vägytemätbil, Saab RST, 1980. Inventerarnas och förarnas uppfattning om
mätfordonet och inventeringsmetoderna. VTI Medde lande 250, 1981.
Arnberg, P W. The Laser Road Surface Tester. A new road measuring system developed by the National Swedish Road and Traffic Research Institute. Paper
presented in the U.S. and Japan December, 1981.
Magnusson, G. Inventering av utländska bestämmelser
och standardkrav för vägars jämnhet. Statens väg och trafikinstitut. Rapport 84, 1976.
Magnusson, G and Arnberg, P W. The rating and measuring of road roughness. Statens väg och trafikinstitut.
Rapport 83 A, 1976.
Magnusson, G, Arnberg, P W and Pettersson, H E. Mät
ning och bedömning av ojämnheter på grusväg.
Statens väg och trafikinstitut. Rapport 123, 1977.
Morén, B, Arnberg, P W, Magnusson G and Sandberg U.