Implications of flood response decision support framework on making
room-for-the-river: A case study of the St. Vrain Creek
André Dozier1, Daniel Brogan
Civil & Environmental Engineering Department, Colorado State University, Fort Collins, CO Peter Leipzig-Scott
Graduate Degree Program in Ecology, Colorado State University, Fort Collins, CO Ryan Fitzpatrick
Department of Fish, Wildlife, and Conservation Biology, Colorado State University, Fort Collins, CO
Abstract. In September 2013, the Front Range of Colorado experienced a 1000-year precipitation event that caused widespread flooding, channel migration, and loss of man-made infrastructure. Opportunities have seemingly arisen to speed implementation of pre-existing plans to perform flood mitigation using non-structural techniques along the St. Vrain Creek. A decision support framework was built to study preferred management actions in response to the flood considering multiple stakeholder preferences and criteria including aspects of the society, economy, and envi-ronment. Sixty scenarios were analyzed using six different analysis techniques, five different im-posed stakeholder preferences, and two different sets of sub-criteria relative important factors. Re-sults of the multi-criteria decision analysis seem to indicate that preferred management alternatives include a mixture of structural and non-structural flood mitigation techniques, indicating that envi-ronmental improvement can complement flood mitigation along the St. Vrain Creek.
1. Introduction
Health of riverine biota, human safety, and well-being of manmade infrastructure near rivers all depend heavily on the hydrologic regime of the area. Encroachment on the river due to land development, agriculture, and grazing has led to a loss of riparian vegetation and riverine ecosystems which ultimately negatively impact on riverine ecology and in-crease the monetary value of flood damage. Several reasons exist for this statement:
1. Land-use change affects watershed-scale hydrologic regime (Gordon and Meentemeyer 2006) with a tendency to decrease overall watershed retention time causing larger than normal flood peaks (Bronstert et al. 2002; Saghafian et al. 2007; Tollan 2002),
2. Encroachment on the floodplain tends to decrease overbank storage, and thus increase magnitude of floods downstream,
3. Watershed-scale hydrologic regime alteration by way of encroachment and land-use change governs reach scale processes and bounds stream ecosystem restoration effectiveness with a trend towards lowering stream biodiversity (Allan 2004; Beechie et al. 2013), and
4. More manmade infrastructure near the river incurs more losses as flood peaks get larger, and less overbank storage is available upstream to protect critical ur-ban areas.
1 Hydrologic Science and Engineering Program
Civil and Environmental Engineering Department Colorado State University
Fort Collins, CO 80523-1372
Feedbacks to society from the physical system (both hydrologic and ecologic), primarily through monetary damage from both direct and indirect encroachment on the river, may alone be significant enough to drive landscape and river ecological restoration (Chan et al. 2006).
Floods can be mitigated using both structural and non-structural mechanisms (James and Korom 2001a; b; Kundzewicz 2002). Recently, there has been a drive towards utiliz-ing non-structural methods because they tend to be more sustainable, environmentally-friendly, reversible, commonly acceptable, adaptable to climate change, and risk-averse than structural methods (James and Korom 2001b; Kundzewicz 2002; Verkerk and Buuren 2013). James and Korom (2001b), and Kundzewicz (2002) define non-structural flood mit-igation as techniques that incorporate a mixture of source control (watershed and landscape management), laws and regulations (including zoning), flood proofing buildings and con-tents, insurance that covers financial loss, an efficient flood forecast-warning system, flood awareness education, and flood-related databases. This focus on non-structural methods over the past decade has fashioned the “room-for-the-river” argument, primarily motivated by both environmental restoration and flood mitigation (van Stokkom et al. 2005; Verkerk and Buuren 2013). This dual motivation has contributed to the push of room-for-the-river programs in many countries including the United Kingdom, Netherlands, United States, Germany, France, Romania, and Hungary (Warner et al. 2013).
However, the public does not readily perceive the flood magnifying effects of devel-opment and encroachment due to a lack of certainty in those linkages and a lack of com-munication of scientific discoveries. Although many reasons exist for stakeholders getting involved in ecosystem restoration efforts, the flood mitigation services that the ecosystem can offer may be a major uniting force that drives stakeholders to care more for the riverine ecosystem by making room-for-the-river (Chan et al. 2006; James and Korom 2001b; van Stokkom et al. 2005; Verkerk and Buuren 2013).
Therefore, the goal of this study is to understand and explore the complementary rela-tionships between ecosystem restoration and flood mitigation, in order to provide a socially tractable framework for post-flood decision-making that will both enhance flood mitiga-tion and help to sustain riverine biota in a transparent way so as to facilitate better commu-nication with the public. The objectives of this study are i) to systematically and transpar-ently analyze linkages between ecological health, flood mitigation, and socially acceptable solutions, and ii) to assemble a set of solutions and recommendations to inform post-flood restoration (including rebuilding and restoring infrastructure, houses, and developments as well as ecosystem restoration) activities that promote both flood mitigation and environ-mental sustainability. In order to accomplish these objectives, information on the physical system, case studies, and other literature was utilized to build a multi-criteria decision analysis (MCDA) for exploring effectiveness and social-tractability of solutions that ex-ploit linkages between flood mitigation and environmental restoration.
2. Study Area
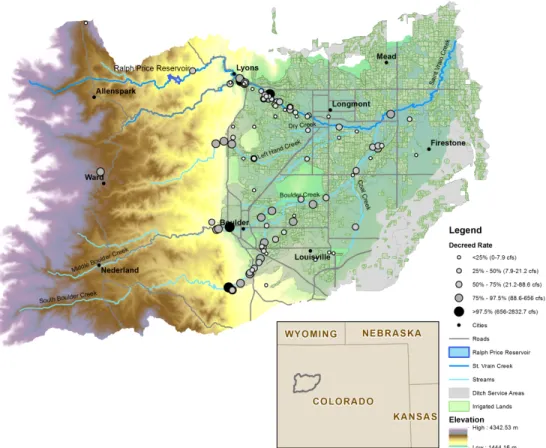
The lower portion of the St. Vrain Creek in Colorado has rich biodiversity, a mixture of both highly altered river reaches and reasonably protected river segments (Wohl 2005). The large September 2013 flood event make this watershed a suitable location for studying the interplay between flood mitigation and environmental restoration. Figure 1 displays the St. Vrain Creek watershed, the main streams, waterbodies, cities, and roads as well as ditch
service areas to show the prevalence of irrigation diversions. For analysis on riverine ecol-ogy, the primary segment of the St. Vrain on which this study focuses is the portion where the North and South St. Vrain Creeks meet within the City of Lyons downstream to the City of Longmont at the Hover Street Bridge crossing. This transitional zone of the St. Vrain is particularly unique since it has the most diverse fish population in the state of Colorado. The cities of Lyons and Longmont bound the reach on each side.
Figure 1. Map of the St. Vrain watershed including a digital elevation model of the St. Vrain water-shed (color scale), the St. Vrain Creek and its main tributaries (blue lines), main roads and cities in the area (black lines and dots), irrigated lands throughout the area (green polygons), total decreed rates of water rights at several ditch headgate locations (grayscale and different sized circles), ditch service ar-eas (transparent gray polygons), and Ralph Price Reservoir (blue polygon).
The St. Vrain Creek watershed covers approximately 2530 km2 with elevations ranging from 1,444 m to 4,343 m. The watershed is composed of three primary geographic regions: the Rocky Mountains on the west side, a transitional zone, and the Great Plains to the east. Most of the human population lives within the Plains region while the mountains are thinly populated, and has historically been impacted by mining, beaver trapping, mining, logging and railroad tie driving, human-induced fires, diversions and dams, roads, urbanization, recreation, and grazing (Wohl and G. David 2013; Wohl 2001, 2005). Thirty-two percent of the land area in the basin is owned by federal agencies including USFS, NPS, BLM, NRCS, and others. The cities of Boulder, Lafayette, Longmont, Louisville, Denver, Erie, Nederland, and Ward either own water rights or are in some other way involved in stake-holder meetings for the St. Vrain Creek, Left Hand Creek, and Boulder Creek (JW
Watershed Initiative, Colorado Rural Water & James Creek Watershed Initiative, Left Hand Ditch Company, Left Hand Water District, Lefthand Watershed Oversight Group, St. Vrain and Left Hand Water Conservancy District, The Nature Conservancy, Trout Unlim-ited, U.S. Forest Service, and Xcel Energy are also involved in stakeholder meetings re-garding the St. Vrain and Boulder Creeks (JW Associates Inc. 2013). There are 96 ditches and 2 pipelines diverting water from main tributaries, creeks, and storage facilities (includ-ing both surface and groundwater reservoirs) throughout the basin, supply(includ-ing about 400 km2 of irrigated lands (about 16% of the total watershed land area) and several cities.
The uppermost portion of the channel for St. Vrain Creek lies within the Rocky Moun-tains reaching to about 3700 m. At a slope of approximately 4%, the creek reaches the transition zone at an elevation of 1,620 m at the canyon mouth near the city of Lyons . This upper region contains a variety of stream types including ephemeral and intermittent streams in the headwaters while the main channel contains an assortment of cascade, step-pool, plane-bed, and pool-riffle segments. Channel material is composed of bedrock, boul-ders, cobbles and gravel with very little sand, clay, and silt. The channel through the transi-tion zone has a sinuosity of 1.35, ranges in elevatransi-tion from 1,520 m to 1,620 m, and is pri-marily a pool-riffle channel type. The lower region near the Great Plains consists of low gradient streams composed of sand to cobble sized bed material, and meandering and braided channel types.
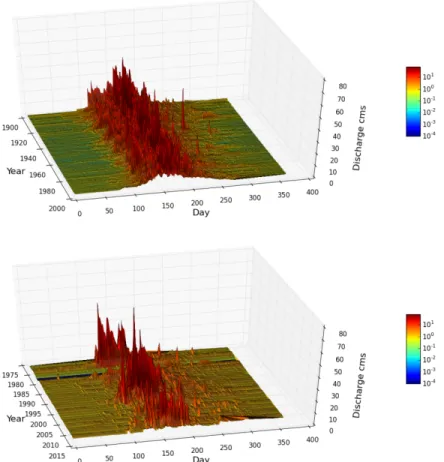
Snowmelt primarily drives streamflow within the St. Vrain Creek and therefore regu-larly peaks in the late spring and has low baseflow in the remaining portions of the year. Figure 2 displays two three-dimensional hydrographs for two different locations along the St. Vrain Creek. Only daily mean streamflow values are shown in the figure, and therefore variability and discharge at flood peaks within a day cannot be inferred. Gauged data dis-played in the top graph is upstream of that of the lower.
As shown in Figure 1, many diversions exist between Lyons and Longmont, and the impact on daily median values over the same 20-year period from 1979 to 1998 (i.e., the overlapping period between the two gauging stations) can be seen in Figure 3 below. Fig-ure 3 displays the daily streamflow values in terms of the median as a solid line, the inter-val between the 25th and the 75th percentiles as the darker shaded region, and the interval between minimum and maximum daily streamflow as the lighter shaded region for both upstream (in black) and downstream (in red). During the irrigation season, 33% less vol-ume flows through the downstream gauge than through the upstream gauge due to diver-sions. However, the largest flood peaks shown at the top of the lightly shaded region in Figure 3 are on average 14% larger below Longmont than in Lyons, making the hydro-graph seem flashier. Thus, diversions along the reach do not lower flood peaks sufficiently well to avoid significant damage to the city during large events as was the case in the Colo-rado Front Range during the historic September 2013 large flood event .
The September 2013 Flood was the largest flood observed within the last 100 years with a magnitude much larger than 300 cms (Lukas et al. 2013). The event damaged both gauging stations that were presented in Figure 2 and Figure 3. According to the Colorado Division of Water Resources, the flood likely incapacitated 35 of the 53 damaged diver-sion structures (i.e., 54% of the total number of diverdiver-sion structures) in the St. Vrain water-shed to be operational in 2014, representing a loss of about 5,000 hectares of irrigated lands (Kevin Houck, CO Department of Natural Resources, personal communication, Feb-ruary 5, 2014). Throughout the rest of the region, about 207 dams were damaged, 9 low
hazard dams were lost, 223 diversion structures were damaged or destroyed, and about $350,000 worth of stream gauge equipment needs replacement (Kevin Houck, CO De-partment of Natural Resources, email communication, February 5, 2014). As a result of the flood, restoration of critical floodplain areas and non-structural flood mitigation efforts have been accelerated for the city of Longmont (Brad Schol, City of Longmont, email communication, November 26, 2013).
Figure 2. Two three-dimensional hydrographs of daily streamflow for the St. Vrain Creek at USGS Gauges 06724000 in Lyons, CO (top) and 06725450 below Longmont, CO (bottom).
Figure 3. Hydrograph comparison between the upstream (at Lyons in black) and downstream (below Longmont in red) hydrographs, at the median value (solid line), between the 25th and 75th percentiles (darker filled regions), and between the min and max values (lighter filled regions).
Distribution and abundance of Colorado’s eastern plains native fishes have declined since 1900, such that many are state-listed and in need of conservation activities (Bestgen and Fausch 1997; Bestgen 1989). Special status fish species in this portion of St. Vrain Creek include: the state threatened brassy minnow (Hybognathus hankinsoni) and common shiner (Luxilus cornutus); the state species of special concern Iowa darter (Etheostoma
ex-ile) and stonecat (Noturus flavus). Additional species that will likely become listed by the
State of Colorado include the plains topminnow (Fundulus sciadicus) and the orangespot-ted sunfish (Lepomis humilis). Anthropogenic changes including stream barriers, altered flow regime, siltation, channelization, changes in water quality, and introduced species have been implicated in the demise of native taxa (Bestgen and Fausch 1997).
The largest impoundment along the St. Vrain Creek, Ralph Price Reservoir, was com-pleted in 1969 and impounds about 25 million cubic meters (mcm), which is equivalent to about 22% of average annual streamflow volume, 24% of the average streamflow volume during the irrigation season, and the volume of water depleted from St. Vrain Creek be-tween Lyons and Longmont on average during the irrigation season. Button Rock Dam at Ralph Price Reservoir stands about 65m high and is about 280m wide. There is no known damage done to the dam due to the flood. In addition to the dam, there are 98 diversions that also impact connectivity of the river and associated fish habitat. New, more fish friendly technology and diversion dam designs could potentially benefit some of the en-dangered fish populations, and damage done by the flood may have provided an opportuni-ty to enhance some of the infrastructure, although flood insurance will not pay for such en-hancements.
The City of Longmont is the largest city along the St. Vrain Creek, and may potentially have the most significant positive impact on the creek since it holds the largest minimum flow water right with a decree date of July 10, 2001 at a rate of 350 cfs for recreation. Alt-hough it holds a very junior water right, if more and more water rights are forfeited over time assuming farmers or their children choose a different lifestyle, the water right held by the City of Longmont will become more and more senior, for the benefit of both the envi-ronment and kayakers.
Longmont seems to place a high priority on flood risk mitigation followed by the eco-nomic growth around the river corridor, in addition to the beauty of the river from a trail user perspective (Rochat 2013; Schol and Wolfrum 2013). Prior to the September 2013 Flood, the city expressed interest in redeveloping the St. Vrain corridor within its city lim-its by expanding the floodplain, hence reducing flood peaks in highly developed, expen-sive urban areas near the river, and keeping the corridor aesthetically pleasing to attract more trail users (Rochat 2013). In order to expand the floodplain and make room–for-the-river, the City of Longmont expects to spend about $25 million purchasing private proper-ty, performing the environmental restoration work, and cleaning up the area to improve the bike paths, and hopes that the improvements will save more than $25 million in avoided flood damage in the future. As a result of the flood and the associated destruction of the bike paths along the river, the City of Longmont is reacting much more quickly to address the issues along the river corridor, and has accelerated budget planning for physical im-provements and property purchases (Brad Schol, City of Longmont, email communication, November 26, 2013). These decisions by the city of Longmont effectively illustrate the important feedback that flooding has on society’s view of and care for the river and the parian ecosystem. It is important to note that the impetus behind care for the river and ri-parian ecosystem is primarily financial (including flood damage reduction and city revenue from taxes on expensive riverside property) and secondly, recreational and aesthetic value.
3. Sources and Methods
In addition to the ecological and geomorphic status of the river, data regarding history of man-induced impacts on the river and other current societal decisions was primarily tak-en from literature as cited above. These data and literature findings were useful in support-ing some of the development of the MCDA and assumptions made about stakeholder pref-erences. However, the strongest component of the work, perhaps, was communicating and meeting with stakeholders within the region.
In order to gain perspective on the municipal and engineering aspects of the flood miti-gation problem, interviews were conducted and email communication was initiated with the city Planning Manager with the City of Longmont, Brad Schol; Engineering Techni-cian with the City of Longmont, Joe Hafner; Don D’Amico, Ecological Systems Supervi-sor/Wetland Ecologist for City of Boulder Open Space and Mountain Parks Department; and a Professional Engineer with a focus on fluvial geomorphology, Anthony Alvarado who is consulting the City of Loveland in response to the flood in the neighboring Big Thompson River watershed. An email conversation with Brad Schol gave insight into the general opinion of the City of Longmont regarding the flood, the riparian corridor, and the motivations for restoring portions of the river’s natural habitat, which are highlighted in the Multi-Criteria Decision Analysis section. Joe Hafner provided useful links to a variety of sources, especially access to an interactive map outlining all the damage, repairs, plans, pictures, and reports along the St. Vrain due to the September flood. An in-depth interview with Anthony Alvarado gave insight into general responses from cities along the Front Range of Colorado, constraints of the system of flood insurance through the Federal Emer-gency Management AEmer-gency (FEMA), channel stability, flood mitigation measures that will be implemented along the river, and an engineer’s perspective on the flooding issues. Dr. Robert Zuellig, an ecologist with the U.S. Geological Survey at the Fort Collins Science Center, is an expert in aquatic macroinvertebrate ecology and has spent much time
study-ing in the St. Vrain watershed. He provided us with a number of papers and reports from his personal library that may have otherwise been difficult to access (Eder et al. 1974; Ward 1975).
In order to reconcile varying stakeholder preferences as deduced from communication with stakeholders, a multi-criteria decision analysis (MCDA) was performed to transpar-ently, and as objectively as possible, support decision making in response to flooding in the region. MCDA is a powerful methodology that allows opinions from various stake-holders to be considered for several different criteria when evaluating the various impacts of a small, finite list of management or mitigation alternatives, and has been used in as-sessing flood mitigation (Levy et al. 2007; Lim and Lee 2009). According to Levy et al. (2007), MCDA increases decision-making effectiveness, efficiency, and transparency by enhancing communication among stakeholders. It also improves emergency response, land management, and resource allocation in addition to making assumptions and choices more explicit, increasing stakeholder satisfaction, saving lives, and reducing flood management costs (Levy et al. 2007).
In MCDA, several preliminarily feasible alternatives, multiple criteria and sub-criteria, and associated rankings called relative importance factors (RIFs) are determined by stake-holders and decision makers according to their preferences, which were not solicited, but were rather imposed as a part of this preliminary study. Rankings are made for both sub-criteria and main sub-criteria, and to combine these rankings into an overall score or ranking for each alternative, multiple techniques were used. These methods include: the weighted average method (WAM), compromise programming (CP), Preference Ranking Organiza-tion Method for Enrichment EvaluaOrganiza-tions (PROMETHEE), and hybrid techniques. All combinations of 6 solution techniques, 5 stakeholder groups, and 2 sub-criteria rankings were analyzed, totaling to 60 scenarios where a final score for each alternative was calcu-lated and alternatives were then ranked from 1 to 5, with 1 being the best ranked and 5 be-ing the worst ranked. More details about the MCDA setup can be found in Appendices A and B.
4. Results
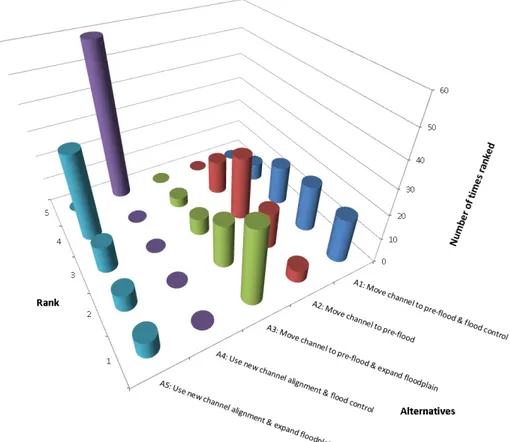
The main result of the MCDA shows the feasibility and desirability of making “room-for-the-river”, as was accomplished in the Netherlands (van Stokkom et al. 2005) and other locations (Warner et al. 2013), both from the perspective of flood control and riparian eco-system sustainability, effectively displaying the complementary relationship between the two. This result is supported by observing results of MCDA output as shown in Figure 4, which displays the number of times for all 60 analyses that each alternative is ranked first through fifth. Therefore, the third alternative (A3) to move the river back to its pre-flood channel and expand the floodplain is ranked first most of the time, followed by Alterna-tives 1 then 5.
Figure 4. Number of times each alternative is ranked 1 (best) through 5 (worst) based on MCDA re-sults for all solution techniques, sub-criteria RIFs, and stakeholder groups
Results varied among stakeholders significantly according to the relative importance factors assigned as preferences for each stakeholder. The stakeholder group labeled “mu-nicipalities” almost unequivocally ranked the alternatives in order of A1, A3, A2, A5, and A4 (descriptions of these alternatives can be found in Table 1 in Appendix A). Other stakeholder groups however, did not have such clear alternative selections and tended to rank Alternative 3 the highest. An interesting case is that the “environmental organiza-tions” stakeholder group picked Alternative 1 containing traditional, structural flood con-trol over Alternative 2, which does not have any additional flood mitigation, because of the presumption that flood control in Alternative 1 includes channelizing the river and remov-ing wood to improve its discharge capacity, and Chin et al. (2008) presented evidence that most people view woodless rivers as being more aesthetically pleasing than rivers with wood.
Sensitivity of MCDA results to selection of different criteria or poor assessment of per-formance for various alternative solutions was analyzed. Primary conclusions from the first sensitivity analysis is that replacing physical and recreational criteria with more socially “potent” criteria such as the number of people or headgates to move tends to favor Alterna-tive 2, the alternaAlterna-tive most similar to no action or indecisiveness, followed by AlternaAlterna-tive 1, then Alternative 3, and then Alternative 5 surprisingly being ranked 5th (worst) the most.
The second sensitivity analysis simply removed one sub-criteria, presuming that no di-versions needed to be moved due to the new channel location, nor were people unhappy with the river flowing through their property. In this scenario, Alternative 3 is no longer
ranked 1st the most, but Alternatives 1 and 5 are ranked 1st more often, followed by Alter-native 2. However, AlterAlter-native 3 is ranked 2nd more often than any other alternative indi-cating that perhaps there was more disagreement about some of the other alternatives. Eve-ryone seemed to agree that Alternative 3 was a good 2nd choice, in which case it might be the better alternative in the end for all the stakeholders as a whole. This highlights the fact that data needs to be solidified before running an MCDA in order to have more certainty on the extent of the damages, in this case whether or not the river is meandering around a particular headgate and through the land of unhappy private property owners.
Overall, Alternative 3 seemed to be a good compromise between environmental mitiga-tion, flood mitigamitiga-tion, and other societal preferences, although a mixture of alternatives may eventually be adopted. Analysis of these results is offered in the next section and dis-cusses the use and application of the MCDA results in a real world setting.
5. Analysis and Synthesis
For the majority of stakeholder groups, it was assumed that the economic component of the alternatives would be the most important issue. The costs, both immediate and fu-ture, of implementing each plan ultimately determine its feasibility, and in turn the likeli-hood of implementation. Stakeholder groups will obviously have varying priorities, in-formed by both their knowledge of areas such as hydrology and ecology, as well as by their personal interests. This assessment of prioritization represents a best guess as to the thought process for each stakeholder group, and should therefore be taken with an appro-priate level of uncertainty.
Additionally, MCDA analysis should not be considered a selection mechanism for the alternative, but rather a decision support system that aids decision-makers in selecting an alternative. Therefore, it may not be helpful to recommend that Alternative 3 be selected, but rather that Alternative 3 and 5 seem to sufficiently support physical, ecological, and social values in such a way that makes them socially tractable options even though they may have significant implications for private property owners, residents, and commerce near the river. A hybrid of alternatives may be used where concepts from each alternative are used to provide a more socially tractable solution. For example, a hybrid alternative may expand the floodplain in a particular river segment improving flood conditions at a downstream reach, where structural flood protection could be constructed to further reduce flood damage risk of costly infrastructure.
Despite the uncertainties in the multi-criteria decision analysis performed as a result of this study, using MCDA as a decision support framework achieves the first objective of this study by systematically and transparently analyzing the complementary relationships between flood mitigation and riparian ecosystem health. The setup and methods on this analysis are detailed within this document, and can be used as a framework for informing future decisions regarding the river, flood mitigation, and environmental restoration. In the next section, the final objective of the study is achieved by providing several recommenda-tions on how to use an MCDA decision support framework while considering uncertainties of such analyses.
6. Recommendations
As a result of this analysis of the St. Vrain Creek, a demonstration on the use of a framework has been made by which water system managers, city planners, irrigation
com-panies, conservation districts, and environmental organizations can open up pathways of communication that may result in win-win decisions benefiting both flood mitigation and the environment. Since stakeholder preferences were not elicited and many assumptions about the physical state of the system pre- and post-flood were made, we do not recom-mend any alternative within this study, but rather recomrecom-mend how to perform a more thor-ough analysis that reduces uncertainties highlighted within this study regarding assessment of the state of the system and the MCDA.
Prior to starting any flood mitigation, the hydrologic and geomorphic setting should be studied in order to establish an understanding of the physical system within which ecology and society are constrained. Sampling, monitoring, and modeling should all be a part of evaluating the current system state. For example, floodplain inundation modeling studies can help define the floodplain for particularly large or unusual floods, or sampling fish abundance or biodiversity can help define ecosystem health prior to any catastrophic flood event.
Then, also prior to any major flood event, decision-makers should interview, survey, and hold workshops in order to interact with stakeholders to establish the following:
1. Plausible solution alternatives while archiving inappropriate ones, 2. Objective criteria and sub-criteria,
3. A matrix of alternative performance for each sub-criteria, 4. Relative importance factors for all sub-criteria, and 5. Relative importance factors for all main criteria
An initial set of alternatives needs to exclude any absurd alternatives, and results of this study seem to indicate that alternatives should likely include some aspect of the “room-for-the-river” concept. Criteria should be selected as tangible, measurable representations of the state of the system. An MCDA should be performed for every combination of solution techniques, stakeholder opinions, and various sets of weightings in order to gauge the amount of diversity in opinion and technique bias. Decision-makers should then present re-sults to stakeholders for feedback and discussion, ideally in an objective manner, and after agreeing on a particular alternative or hybrid of alternatives, decision-makers should take preliminary action to implement such alternatives prior to flood events. Actions may re-quire purchasing water rights and private property within the floodplain, and saving up money for improving infrastructure in an environmentally-friendly manner since FEMA policies restrict use of funds to upgrade infrastructure (FEMA 2013).
After a sufficiently thorough but quick investigation after a flood event, alternatives that seemed plausible prior to the investigation may no longer be feasible options, and therefore, alternatives may need to be altered or hybridized. Using expert knowledge of the system and the potential solutions, decision-makers revise and recalculate the MCDA with adjusted values based on expert knowledge in order to quickly implement flood mitigation strategies and apply for FEMA insurance before the application deadline. No FEMA loans can be used for upgrades to infrastructure, unless required by code (FEMA 2013), and therefore it is recommended that prior to any major flood event, zoning, codes, and addi-tional money be set aside to plan for such disastrous events. If not socially or politically tractable before flood events, any new zoning and code developments may be more readily acceptable within two years of a flood event when complacency about floods is perhaps at a minimum (Grigg, 1999). Thus, decision-makers restrained from acting proactively for flood mitigation and environmental restoration must respond to the opportunity provided
by this important feedback mechanism of nature, namely flood damage and awareness, by engaging with the public not only after floods but prior to floods.
Finally, decision-makers should keep communication pathways open to stakeholders, the public, and scientists, in order to provide a feedback loop between outcomes of coupled flood mitigation and environmental restoration projects, the stakeholders and general pub-lic, and scientific knowledge of hydrologic, geomorphic, ecological, and social processes and interactions. Such communication may indeed prove to be a key component to finding complementary relationships between societal desires related to flood protection and envi-ronmental health, particularly health of the riverine landscape. Scientific knowledge of making room-for-the-river is at very early developmental stages, and will improve only as case studies present themselves, which requires publishing findings and assessments as well as outcomes of non-structural flood mitigation projects. Books, magazines, newspa-pers, blogs, internet sites, and other public media present avenues for communicating find-ings, plans, and goals to the public and stakeholders, in addition to helping the public em-brace environmental stewardship particularly in view of flood mitigation techniques.
As communication about the complementary relationship between flood mitigation and environmental stewardship becomes more widespread in literature and schools, there is a higher likelihood adoption by decision makers including water resource managers, water-shed stewardship programs, city planners, and other communities. Decision support sys-tems that incorporate environmental criteria and stakeholder preferences should penetrate more deeply into decision making contexts, especially regarding water and land-use man-agement, because they may potentially reveal non-dominated solutions that incorporate complementary relationships between the environment and society.
Appendix A: MCDA Setup
Alternatives in the MCDA incorporate feasible flood restoration plans using both struc-tural and non-strucstruc-tural flood control measures, specifically those non-strucstruc-tural tech-niques expanding the floodplain by moving residential and commercial developments out of the floodplain. Five alternatives were considered, all of which include rebuilding major infrastructure such as roads, pipelines, diversion structures, and canals. Alternatives were selected primarily to enhance understanding of the relationship between the riparian eco-system and flood protection, using the room-for-the-river concept. Table 1 lists the alterna-tives and a brief description of each. Alternative 2 resembles most closely the status quo alternative, where the river is moved back to its pre-flood channel and nothing more is done to mitigate floods. Alternatives 1 and 3 add to Alternative 2 by implementing “flood control” or by “expanding the floodplain”, respectively. Alternatives 4 and 5 consider leav-ing the channel in its post-flood state, where it “naturally” conformed. Flood control for Alternatives 1 and 4 primarily means insulating critical areas of the city using traditional structural flood protection such as dikes, levees, and other engineering man-made struc-tures. Expanding the floodplain for Alternatives 3 and 5 refers to ensuring that the river has room to flood by purchasing residential and commercial developments or other man-made infrastructure within the historical floodplain of the river and converting the land back to a sufficiently “natural” ecosystem state. In this study, expanding the floodplain in Alterna-tives 3 and 5 assumes implementing land zoning policies that ensure new developments in critical areas near the river do not occur, as well as policies for new land development elsewhere in the watershed that require retention ponds and various water treatment
tech-niques to reduce further degradation of water quantity and quality not only during floods but other times as well.
Table 1. Descriptions of each flood restoration alternative
ID Alternative
A1 Move channel to pre-flood & structural flood control A2 Move channel to pre-flood & nothing more
A3 Move channel to pre-flood & expand floodplain A4 Use new channel alignment & structural flood control A5 Use new channel alignment & expand floodplain
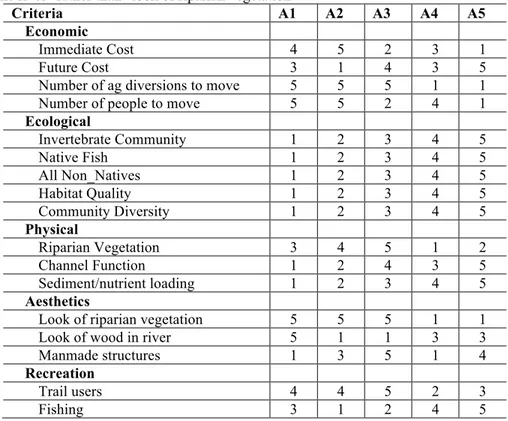
Table 2 displays each alternative and criteria used in the analysis in addition to the qualitative scores showing how well each alternative satisfies each particular sub-criterion. Within the MCDA, given a particular sub-criterion, we scored each alternative on a range from 1 to 5, where 1 is the worst and 5 is the best. These scores were transcribed from the two following qualitative scales:
1. Poor (1), Fair (2), Good (3), Very Good (4), and Excellent (5) 2. Very Low (1), Low (2), Medium (3), High (4), and Very High (5)
Reasons for the performance evaluation for each alternative and criterion are discussed in Appendix B.
Table 2. Criteria performance under various criteria. In future studies, these should be obtained and assessed in the most objective manner possible, incorporating only objective criteria such as “biomass near the river” rather than “look of riparian vegetation”
Criteria A1 A2 A3 A4 A5
Economic
Immediate Cost 4 5 2 3 1
Future Cost 3 1 4 3 5
Number of ag diversions to move 5 5 5 1 1
Number of people to move 5 5 2 4 1
Ecological Invertebrate Community 1 2 3 4 5 Native Fish 1 2 3 4 5 All Non_Natives 1 2 3 4 5 Habitat Quality 1 2 3 4 5 Community Diversity 1 2 3 4 5 Physical Riparian Vegetation 3 4 5 1 2 Channel Function 1 2 4 3 5 Sediment/nutrient loading 1 2 3 4 5 Aesthetics
Look of riparian vegetation 5 5 5 1 1
Look of wood in river 5 1 1 3 3
Manmade structures 1 3 5 1 4
Recreation
Trail users 4 4 5 2 3
Fishing 3 1 2 4 5
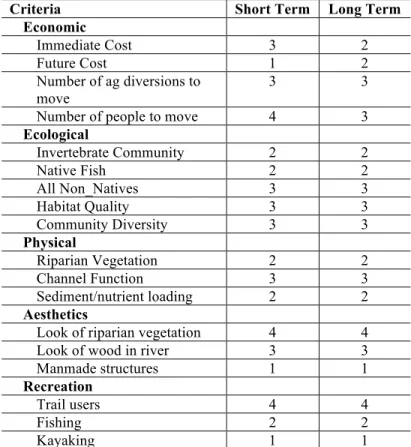
Both sub-criteria and main criteria were then assigned RIFs according to assumed stakeholder preferences as shown in Table 3 and Table 4, respectively. Sub-criteria RIFs are aggregated into a score for each of the five main criteria, which are then aggregated in-to a score for a particular stakeholder group via main criteria RIFs.
Table 3. Relative importance factors for sub-criteria as determined in the short-term and in the long-term
Criteria Short Term Long Term
Economic Immediate Cost 3 2 Future Cost 1 2 Number of ag diversions to move 3 3
Number of people to move 4 3
Ecological Invertebrate Community 2 2 Native Fish 2 2 All Non_Natives 3 3 Habitat Quality 3 3 Community Diversity 3 3 Physical Riparian Vegetation 2 2 Channel Function 3 3 Sediment/nutrient loading 2 2 Aesthetics
Look of riparian vegetation 4 4
Look of wood in river 3 3
Manmade structures 1 1
Recreation
Trail users 4 4
Fishing 2 2
Kayaking 1 1
Table 4. Relative importance factors (RIFs) for the main criteria. In this preliminary study, RIFs were imposed for the set of hypothetical stakeholder groups, but in future studies RIFs should be solicited from stakeholder groups
Criteria Municipali-ties Agricul-ture Conserva-tion Districts Environmen-tal Organiza-tions Residen-tial land owners Economic 4 4 4 2 4 Ecological 1 1 2 4 1 Physical 2 3 3 1 2.5 Aesthetics 3 2 1 3 2 Recreation 3 1 1 3 2
The various techniques used to calculate final scores for each alternative are i) the weighted average method (WAM), ii) compromise programming (CP) with the first norm, iii) CP with the second norm, iv) CP with an infinite norm, v) Preference Ranking Organi-zation Method for Enrichment Evaluations (PROMETHEE), and vi) a hybrid of PROME-THEE and the weighted average method. The weighted average method simply calculates the weighted average of each alternative’s score based on the relative importance factor and ranks the alternatives according to the highest scoring values. Compromise program-ming attempts to minimize the “distance” from the best value (in this case, all rankings have their best value at 5 and worst at 1). Distances are then rescaled so that the scores range from 0 to 1 with 0 being the worst and 1 being the best. The weighted average meth-od then ranks the alternatives based on the weighted average of each of these scores and
their relative importance factors. The “distance” can be normalized according the first, se-cond, or infinite norm, where the second norm tends to place a larger weight on alterna-tives with scores that tend to be closer to the best value and the infinite norm tends simply select the alternative(s) with the best score for a particular sub-criteria. PROMETHEE per-forms pairwise comparisons of each alternative with every other alternative, scores alterna-tives with a binary operator (1 if better than another alternative, 0 if worse than another al-ternative), and ranks the alternatives according to the weighted average of the relative im-portance factors and the binary operator values. PROMETHEE can enforce indifference in comparisons between scores, but there was assumed to be no indifference since this was a purely qualitative analysis with a sufficiently discrete scale. Due to the setup of the tech-nique, PROMETHEE favors the alternatives that outperform others in count, not in magni-tude.
Appendix B: Reasoning for MCDA Scoring
This appendix describes the reasoning for each of the five main criteria in addition to each sub-criterion. Reasons were a combination of information gathered from interviews, case studies, literature, and the authors’ knowledge about the various subjects, and scores were assembled through several group discussion sessions amongst the authors given the following reasoning:
Economic
Immediate cost
Costs incurred to implement the alternative in the short-run (Rochat 2013)(Rochat, 2013 ~ $25.5 million for flood control option). Short-run costs are the best for Alternative 2, the alternative closest to no action. Immediate costs for Alternative 5, though, are very large due to the need to move both people and diversions, as well as buying properties (but not flood control structures as in Alternative 1 or 4).
Future cost
In the event of another catastrophic flooding event were to occur, how would the costs compare between each scenario. Additionally, water rights purchases cost $10,000 per ac-ft on average, not including transaction costs due to court fees and lawyers [Colorado Divi-sion of Water Resources (CDWR), 2013]. A degree of flood protection is presumed to sig-nificantly improve future costs, and therefore A3 and A5 are given the highest scores, even higher than A1 and A4 that utilize traditional flood control techniques because of the un-certainties associated with design such structures.
Number of diversion structures to move
This criteria mainly distinguishes between leaving the river in its new channel and moving it back to its prior channel. Therefore, this criteria includes both the number of diversion structures that would need to be moved if the diversion structures are no longer sitting in the river channel, and the number of unhappy property owners with a new river channel flowing through their property. The first three alternative score the best, and the last two al-ternatives score the worst in this criteria.
Number of people to move
For expanding the floodplain, cities or other interested parties need to purchase private properties in order to make room for the river. In order for this to happen people need to be willing to move and value money offered for their property more than their property.
Ecological
Invertebrate community, native fish, non-native fish
Species richness and diversity of these three groups are generally improved with habitat complexity and heterogeneity. Widened floodplains provide a greater riparian resource for the aquatic food web via spatial subsidies.
Habitat quality, community diversity
Habitat quality and community diversity is improved with channel complexity and a higher amount of wood in the channel.
Physical
Riparian vegetation
The composition, health, and diversity of the riparian vegetation community in the short term (several years). Riparian vegetation as it relates to physical criteria improves with more environmentally-friendly solutions, but is not good for the new channel, where ma-ture riparian vegetation does not currently exist.
Channel function
Does the river function naturally or are limiting factors (e.g., diversions, dams, riprap, etc.) inhibiting river function? Flood control prevents natural river functioning, which drops scores of Alternative 1 and 4. Otherwise, the more environmentally-friendly the solution, the better the channel functions.
Sediment/nutrient loading
Is there sufficient sediment in the channel? Is there enough vegetation decomposition to fa-cilitate ecological function? Using the old channel is presumed to be less potentially erodi-ble and therefore sediment or nutrient supply-limited, but increases as the potential for en-vironmental restoration increases assuming that natural sediment or nutrient loading is ide-al.
Aesthetics
Look of riparian vegetation
Describes how people generally value aesthetics of riparian vegetation. It is presumed that people prefer riparian vegetation in the old channel better than the new because the vegeta-tion is more mature and contains large bushes and trees.
Look of wood in river
Describes how people generally value aesthetics of the river with wood in it. According to Chin et al. (2008), rivers with less natural wood tend to be more appealing to the general public, which was therefore incorporated into the performance of alternatives. Wood is taken from the river in both the flood control scenarios, but wood is still presumably block-ing up the old river path in Alternative 4
Manmade structures
In general, structures that are manmade are viewed aesthetically negatively,. Therefore, flood control alternatives are bad, and expanding the floodplain is good, although there are presumably more ugly diversion structures if the river channel moved and old diversion structures are simply left in old locations.
Recreation Trail users
Shade for the users is preferred as it provides coolness during hot summer days or cover when raining. Additionally, added trees likely play aesthetic role to users as most people like vegetation (Rochat 2013).
Fishing
Kayaking
Kayakers presumably want deep, fast moving channels free of wood and other dangers. Moving the channel back to its pre-flood state makes it deeper, and “flood control” alterna-tives clear wood out of the river, but the new channel is presumably wide and shallow and not suitable for kayaking, and therefore less desirable.
Acknowledgements. This study was performed in an interdisciplinary graduate class on sustaining rivers for biota co-taught by Dr. Kurt D. Fausch, Dr. N. LeRoy Poff, and Dr. Brian P. Bledsoe. We thank Dr. Dar-rell Fontane and Dr. Mazdak Arabi for permission to use their generic MCDA tool built in Microsoft Excel.
References
Allan, J. D. (2004). “Landscapes and riverscapes: The influence of land use on stream ecosystems.” Annual
Review of Ecology, Evolution, and Systematics, 35(1), 257–284.
Beechie, T., Richardson, J. S., Gurnell, A. M., and Negishi, J. (2013). “Watershed Processes, Human Impacts, and Process-based Restoration.” Stream and Watershed Restoration: A Guide to Restoring
Riverine Processes, P. Roni and T. Beechie, eds., John Wiley & Sons, Ltd.
Bestgen, K. R. (1989). “Distribution and Notes on the Biology of Phoxinus eos (Cyprinidae) in Colorado.”
The Southwestern Naturalist, 2, 225–231.
Bestgen, K. R., and Fausch, K. d. (1997). “Ecology of Fishes Indigenous to the Central and Southwestern Great Plains.” Ecology of Conservation of Great Plains Vertebrates, (F. L. K. Samson and F. B., eds.), Springer-Verlag, New York, 125, 131–166.
Bronstert, A., Niehoff, D., and Burger, G. (2002). “Effects of climate and land-use change on storm runoff generation: present knowledge and modelling capabilities.” Hydrological Processes, 16(2), 509–529. Chan, K. M. a, Shaw, M. R., Cameron, D. R., Underwood, E. C., and Daily, G. C. (2006). “Conservation
planning for ecosystem services.” PLoS Biology, 4(11), 2138–2152.
Chin, A., Daniels, M. D., Urban, M. a, Piégay, H., Gregory, K. J., Bigler, W., Butt, A. Z., Grable, J. L., Gregory, S. V, Lafrenz, M., Laurencio, L. R., and Wohl, E. (2008). “Perceptions of wood in rivers and challenges for stream restoration in the United States.” Environmental Management, 41(6), 893–903. Eder, S., Carlson, C., and Frank, W. D. (1974). Aquatic Invertebrate Component and Fish Food Habits
Component. Fort St. Vrain Ecological Investigations. Fort Collins, Colorado, 1–80.
FEMA. (2013). “Disaster help available for privately owned roads.” News Releases,
<http://www.fema.gov/news-release/2013/09/22/disaster-help-available-privately-owned-roads> (Dec. 5, 2013).
Gordon, E., and Meentemeyer, R. K. (2006). “Effects of dam operation and land use on stream channel morphology and riparian vegetation.” Geomorphology, 82(3-4), 412–429.
James, L. D., and Korom, S. F. (2001a). “Lessons from Grand Forks: Planning structural flood control measures.” Natural Hazards Review, 2(4), 22–32.
James, L. D., and Korom, S. F. (2001b). “Lessons from Grand Fork: Planning nonstructural flood control measures.” Natural Hazards Review, 2(4), 182–192.
JW Associates Inc. (2013). “Saint Vrain Wildfire/Watershed Assessment.” Integrated approaches to
water-ecology-planning, <http://www.jw-associates.org/saintvrain.html> (Nov. 26, 2013).
Kundzewicz, Z. W. (2002). “Non-structural flood protection and sustainability.” Water International, 27(1), 3–13.
Levy, J. K., Hartmann, J., Li, K. W., An, Y., and Asgary, A. (2007). “Multi-Criteria Decision Support Systems for Flood Hazard Mitigation and Emergency Response in Urban Watersheds.” Journal of the
American Water Resources Association, 43(2), 346–358.
Lim, K.-S., and Lee, D.-R. (2009). “The spatial MCDA approach for evaluating flood damage reduction alternatives.” KSCE Journal of Civil Engineering, 13(5), 359–369.
Lukas, J., Wolter, K., Mahoney, K., Barsugli, J., Doesken, N., and Ryan, W. (2013). “Severe flooding on the Colorado Front Range: A preliminary assessment.” Front Range Rain Event and Floods - September
2013, <http://wwa.colorado.edu/resources/front-range-floods/assessment.pdf> (Feb. 13, 2014).
Rochat, S. (2013). “Longmont looking at ways to redevelop river without ruining the view.” Times-Call
Saghafian, B., Farazjoo, H., Bozorgy, B., and Yazdandoost, F. (2007). “Flood Intensification due to Changes in Land Use.” Water Resources Management, 22(8), 1051–1067.
Schol, B., and Wolfrum, N. (2013). “Longmont Launches St. Vrain Corridor Study.” City of Longmont:
Press Releases, <http://www.ci.longmont.co.us/news/pr/2013/vrainbluprint.htm#.UpTGA_nkt8E> (Nov.
26, 2013).
Van Stokkom, H. T. C., Smits, A. J. M., and Leuven, R. S. E. W. (2005). “Flood Defense in The Netherlands.” Water International, 30(1), 76–87.
Tollan, A. (2002). “Land-use change and floods: what do we need most, research or management?” Water
science and technology, 45(8), 183–190.
Verkerk, J., and Buuren, A. van. (2013). “Space for the river: A condensed state of the art.” Making Space
for the River: Governance Experiences with Multifunctional River Flood Management in the US and Europe, J. F. Warner, A. van Buuren, and J. Edelenbos, eds., IWA Publishing, London, UK, 15–28.
Ward, J. (1975). “Bottom fauna-substrate relationships in a northern Colorado trout stream: 1945 and 1974.”
Ecology, 56(6), 1429–1434.
Warner, J., Edelenbos, J., and Buuren, A. van. (2013). “Making space for the river: Governance challenges.”
Making Space for the River: Governance Experiences with Multifunctional River Flood Management in the US and Europe, J. Warner, A. van Buuren, and J. Edelenbos, eds., IWA Publishing, London, UK, 1–
13.
Wohl, E. (2001). Virtual Rivers: Lessons from the Mountain Rivers of the Colorado Front Range. Yale University Press.
Wohl, E. (2005). “Compromised rivers: understanding historical human impacts on rivers in the context of restoration.” Ecology and Society, 10(2).
Wohl, E., and G. David. (2013). “Saint Vrain Drainage Basin.” St. Vrain Creek Watershed, <http://warnercnr.colostate.edu/~ellenw/front_range/StVrain.php> (Nov. 25, 2013).