Atmos. Chem. Phys., 10, 5573–5592, 2010 www.atmos-chem-phys.net/10/5573/2010/ doi:10.5194/acp-10-5573-2010
© Author(s) 2010. CC Attribution 3.0 License.
Atmospheric
Chemistry
and Physics
Aerosols in the tropical and subtropical UT/LS: in-situ
measurements of submicron particle abundance and volatility
S. Borrmann1,2, D. Kunkel1, R. Weigel2, A. Minikin3, T. Deshler4, J. C. Wilson5, J. Curtius6, C. M. Volk7,C. D. Homan7,*, A. Ulanovsky8, F. Ravegnani9, S. Viciani10, G. N. Shur8, G. V. Belyaev11, K. S. Law12, and F. Cairo9 1Max-Planck-Institute for Chemistry, Particle Chemistry Department, Germany
2Institute for Atmospheric Physics, Johannes-Gutenberg-University, Mainz, Germany 3Institut f¨ur Physik der Atmosph¨are, DLR, Oberpfaffenhofen, Germany
4Department of Atmospheric Science, University of Wyoming, Laramie, WY, USA 5Department of Mechanical Engineering, Denver University, Denver, CO, USA
6Institute for Atmospheric and Environmental Sciences, Goethe University of Frankfurt, Germany 7Department of Physics, Wuppertal University, Wuppertal, Germany
8Central Aerological Observatory, Dolgoprudny, Moscow Region, Russia 9Institute of Atmospheric Science and Climate, ISAC-CNR, Rome, Italy 10National Institute of Optics (INO), CNR, Florence, Italy
11MDB-Myasishchev Design Bureau, Zhukovsky-5, Moscow Region, Russia
12UPMC Univ. Paris 06, Universit´e Versailles St-Quentin, CNRS/INSU, LATMOS-IPSL, Paris, France *now at: KNMI, De Bilt, The Netherlands
Received: 16 October 2009 – Published in Atmos. Chem. Phys. Discuss.: 18 November 2009 Revised: 30 April 2010 – Accepted: 30 May 2010 – Published: 23 June 2010
Abstract. Processes occurring in the tropical upper tropo-sphere (UT), the Tropical Transition Layer (TTL), and the lower stratosphere (LS) are of importance for the global cli-mate, for stratospheric dynamics and air chemistry, and for their influence on the global distribution of water vapour, trace gases and aerosols. In this contribution we present aerosol and trace gas (in-situ) measurements from the trop-ical UT/LS over Southern Brazil, Northern Australia, and West Africa. The instruments were operated on board of the Russian high altitude research aircraft M-55 “Geophys-ica” and the DLR Falcon-20 during the campaigns TROCCI-NOX (Arac¸atuba, Brazil, February 2005), SCOUT-O3 (Dar-win, Australia, December 2005), and SCOUT-AMMA (Oua-gadougou, Burkina Faso, August 2006). The data cover submicron particle number densities and volatility from the COndensation PArticle counting System (COPAS), as well as relevant trace gases like N2O, ozone, and CO. We use
these trace gas measurements to place the aerosol data into a
Correspondence to: S. Borrmann
(stephan.borrmann@mpic.de)
broader atmospheric context. Also a juxtaposition of the sub-micron particle data with previous measurements over Costa Rica and other tropical locations between 1999 and 2007 (NASA DC-8 and NASA WB-57F) is provided. The sub-micron particle number densities, as a function of altitude, were found to be remarkably constant in the tropical UT/LS altitude band for the two decades after 1987. Thus, a param-eterisation suitable for models can be extracted from these measurements. Compared to the average levels in the period between 1987 and 2007 a slight increase of particle abun-dances was found for 2005/2006 at altitudes with potential temperatures, 2, above 430 K. The origins of this increase are unknown except for increases measured during SCOUT-AMMA. Here the eruption of the Soufri`ere Hills volcano in the Caribbean caused elevated particle mixing ratios. The vertical profiles from Northern hemispheric mid-latitudes be-tween 1999 and 2006 also are compact enough to derive a parameterisation. The tropical profiles all show a broad maximum of particle mixing ratios (between 2 ≈ 340 K and 390 K) which extends from below the TTL to above the ther-mal tropopause. Thus these particles are a “reservoir” for
5574 S. Borrmann et al.: Aerosols in the tropical and subtropical UT/LS vertical transport into the stratosphere. The ratio of
non-volatile particle number density to total particle number den-sity was also measured by COPAS. The vertical profiles of this ratio have a maximum of 50% above 370 K over Aus-tralia and West Africa and a pronounced minimum directly below. Without detailed chemical composition measure-ments a reason for the increase of non-volatile particle frac-tions cannot yet be given. However, half of the particles from the tropical “reservoir” contain compounds other than sul-phuric acid and water. Correlations of the measured aerosol mixing ratios with N2O and ozone exhibit compact
relation-ships for the tropical data from SCOUT-AMMA, TROCCI-NOX, and SCOUT-O3. Correlations with CO are more scat-tered probably because of the connection to different pol-lution source regions. We provide additional data from the long distance transfer flights to the campaign sites in Brazil, Australia, and West-Africa. These were executed during a time window of 17 months within a period of relative vol-canic quiescence. Thus the data represent a “snapshot pic-ture” documenting the status of a significant part of the global UT/LS fine aerosol at low concentration levels 15 years af-ter the last major (i.e., the 1991 Mount Pinatubo) eruption. The corresponding latitudinal distributions of the measured particle number densities are presented in this paper to pro-vide data of the UT/LS background aerosol for modelling purposes.
1 Introduction
In the upper troposphere and lower stratosphere (UT/LS) aerosols influence the radiative budget and the actinic fluxes for photochemical reactions, serve as condensation nuclei for altocumulus and cirrus cloud formation (Kr¨amer et al., 2009), and provide sites for heterogeneous chemical reac-tions (Borrmann et al., 1997).
Of particular importance for many of the aerosol and cloud related processes in the tropics is the so-called Tropical Tran-sition Layer (TTL) within the UT/LS. It is defined as the altitude band between an upper “boundary level” somewhat above the thermal tropopause and the level of net zero ra-diative heating as lower “limiting surface” (Fueglistaler et al., 2009). This lower boundary often also is close to the level of neutral buoyancy where convection – with the excep-tion of occasional overshooting – does not suffice to lift air parcels any higher. Based on measurements over Costa Rica and Australia, Park et al. (2007), proposed that the TTL may consist of two layers: The upper TTL being characterised by slow radiatively driven vertical ascent, and the lower TTL being influenced by convective outflow. In the lower TTL detrainment of air occurs which was lifted from as far be-low as the boundary layer and possibly processed by deep convective cumulonimbus clouds. In the recent review paper by Fueglistaler et al. (2009), a “synthesis definition” for the
TTL is given by specifying a lower TTL “boundary” level of
2=355 K potential temperature (equivalent to 150 hPa am-bient pressure, or 14 km of altitude) and a TTL top level with the corresponding values of 425 K, 70 hPa, and 18.5 km. Since the tropical tropopause typically is located at potential temperatures 2 ≈ 380 K, or roughly 16 to 18 km altitude, it is situated within the TTL. The latitudinal boundaries of the TTL are given by the subtropical jets and thus the TTL can be considered as sub-volume of the UT/LS region, and as interface between the free troposphere and the stratospheric overworld. The intermediate dynamical and radiative charac-teristics of the TTL with several weeks of air residence times (Pl¨oger et al., 2010; Kr¨uger et al., 2009) allow microphysi-cal and chemimicrophysi-cal processes to greatly affect tropospheric air entering the stratosphere.
The aerosols in the tropical upper troposphere and TTL most likely contribute significantly to the particles of the global stratospheric Junge layer (Brock et al., 1995), and may influence the transport of water vapour into the stratosphere (Corti et al., 2008; Gettelman et al., 2009; Luo et al., 2003a). Water vapour contained in the upwelling air is removed in significant amounts within the TTL through freeze drying in thin visible, subvisible and opaque cirrus. This is the basis of the stratospheric water vapour tape recorder phenomenon (Mote et al., 1996; Randel et al., 2001; Randel et al., 2004). The formation of cirrus and subvisible cirrus is dependent on the properties of the aerosol (Thomas et al., 2002; Peter et al., 2003; Luo et al., 2003b; Davis et al., 2010) although the exact mechanisms leading to nucleation and cloud forma-tion in the TTL still are unknown (Froyd et al., 2009). From in-situ cloud and submicron aerosol particle data, de Reus et al. (2009), showed that in the tropical upper troposphere typically one in 3000 aerosol particles can be activated to form an ice particle with occasional values as high as one in 300 and as low as one in 30 000. More recently Froyd et al. (2010), presented air-borne mass spectrometric com-position measurements of ice residues from tropical cirrus and subvisible cirrus clouds. They concluded that most ice residuals consisted of internal mixtures of neutralised sul-phate and some organics (similar to liquid sulphuric acid droplets) and that mineral dust or other heterogeneous nuclei do not play a role in cirrus formation. How much this can be generalised is an open question as other studies indicate the importance of metals (Cziczo et al., 2009, and references therein), mineral dust (DeMott et al., 2003; Zimmermann et al., 2008; Kulkarni and Dobbie, 2010), and organics (Murray et al., 2010).
According to current belief, the major source for aerosol particles in the lower stratosphere is gas-to-particle conver-sion of precursor gases like OCS, CS2, and SO2 ultimately
forming binary sulphuric acid/water droplets (Thomason and Peter, 2006; Wilson et al., 2008; see especially Sipil¨a et al., 2010). Brock et al. (1995) suggested that fine and ultrafine particles present or formed in the tropical upper troposphere can be transported into the stratosphere. Organic components
S. Borrmann et al.: Aerosols in the tropical and subtropical UT/LS 5575 also may be involved (Ekman et al., 2008; Froyd et al.,
2009) in the homogeneous new particle formation. This is supported by mass-spectrometric in-situ measurements from Murphy et al. (1998), who found that “organic material was almost always present” in the UT/LS particles. In addition, the UT/LS particle mass spectra from Murphy et al. (1998), indicated the presence of metals like iron, magnesium, and even mercury. Also Nielsen et al. (2007) detected solid par-ticles of unknown origin in the tropical lower stratosphere. A study based on numerical simulation of observed in-situ data indicates that ion induced nucleation in the UT/LS fa-cilitates gas to particle conversion for the H2SO4/H2O
sys-tem (Lee at al., 2003; Lovejoy et al., 2004) and thus may be an important source of UT/LS aerosols. According to Lee et al. (2004), inside tropical upper tropospheric cirrus clouds new particle nucleation events can occur. However, the sig-nificance of this source for the global UT/LS aerosol and the underlying mechanisms are still unknown. Based on recent laser ablation mass spectrometric in-situ measurements in the TTL over Costa Rica, Froyd et al. (2009) showed that signif-icant numbers of particles with sizes above 500 nm contain oxidised organic compounds. They also conclude that the chemical composition of these larger particles in the tropi-cal TTL depends on tropitropi-cal dynamics, regional sources (im-plying boundary layer processes as well) and the occurrence of overshooting cumulonimbus clouds. Furthermore, evi-dence has been presented by Popp et al. (2006), Hervig and McHugh (2002), suggesting (like Hamill and Fiocco based on theoretical considerations already in 1988) that nitric acid trihydrate (NAT) particles are present in the tropical transi-tion layer. Based on numerical simulatransi-tions of the micro-physics and thermodynamics and on global modelling, it was hypothesised that these may even form a “tropical tropopause NAT belt” (Voigt et al., 2008) although robust evidence for this is still lacking.
A comprehensive, recent overview of the mechanisms un-derlying stratospheric aerosol microphysics and chemistry, as well as observations, volcanic influence, climatology, trends, and modelling of stratospheric aerosols including ref-erences to the relevant literature were presented by Thoma-son and Peter (2006) in the WRCP SPARC Assessment Re-port No. 4 and in Chapter 3 of WMO (1999).
Summarising, the aerosols in the upper troposphere and lower stratosphere seem to originate (1) from gas-to-particle conversion processes, possibly involving organic substances, and possibly influenced by ions induced from cosmic rays, as well as (2) from lifting processes (like deep, overshoot-ing convection) which transport gases and particulate ma-terials from the boundary layer to the UT/LS. (3) Cirrus clouds also may play a role as sources for submicron par-ticles. (4) Aerosols present in the tropical UT may form a reservoir of particles amenable for transport into the lower stratosphere. (5) With respect to the chemical composition of the aerosol particles, sulphuric acid-water solutions are as-sumed to be the major components in the lower stratosphere
while more complex composition including organic materi-als may be found in the TTL. Also, metmateri-als, possibly soot and biomass burning residues can play a role for the chemical composition.
It is quite clear that the mechanisms controlling particle production, ageing and composition, as well as the global spatial and temporal distribution of the sources are to a large extent unknown or at least un-quantified for the tropical UT/LS and the TTL. Obviously, this short (and incomplete) survey of the recently gained knowledge demonstrates that an increasingly complex picture evolves with respect to the microphysics and dynamics of the tropical UT/LS and in par-ticular the TTL aerosols. This complexity is also reflected in CCM and CTM (e.g., Palazzi et al., 2009; Pl¨oger et al., 2010) and mesoscale models (e.g., BOLAM; Fierli et al., 2009) which include TTL properties.
The aims of this study are: (1) To provide in-situ data for submicron particle number densities at altitudes above 14 km during the time of relative volcanic quiescence (from Jan-uary 2005 until August 2006, although at the end of this period a small eruption played a role). The data include, in addition to the local mission flights, transfer flights of the Russian M-55 high altitude research aircraft “Geophys-ica” and the DLR Falcon-20 from Europe to Brazil (TROC-CINOX, 2005), to Northern Australia (2005), and to West Africa (SCOUT-AMMA, 2006). (2) To relate these measure-ments to 1999–2007 data from other tropical locations like Costa Rica and to earlier data from Hawaii. (3) To show ver-tical profile in-situ data of submicron particle number con-centrations up to 20 km altitude from Brazil, West Africa and Northern Australia, and place these into a broader at-mospheric context (4) To present and discuss results from measurements of non-volatile residues.
The main instruments used to obtain the data are spe-cialised condensation particle counters (CPCs). For the M-55 “Geophysica” this is the COPAS (COndensation PArticle counter System; see Weigel et al., 2009) while an NMASS instrument was operated by the University of Denver on the NASA DC-8 and NASA WB-57F. Similar instruments were implemented on the German DLR Falcon-20 and a balloon borne CPC was utilised by the University of Wyoming. In addition measurements of gaseous species like N2O, ozone
and CO from the M-55 “Geophysica” flights are presented in connection with the aerosol data.
2 Atmospheric context of the TROCCINOX, SCOUT-O3, and SCOUT-AMMA field campaigns
The measurements presented here originate from local flights of the M-55 “Geophysica” and the German DLR Falcon-20 research aircraft during the campaigns: TROCCINOX (from Arac¸atuba, Brazil; Schumann, 2005), SCOUT-O3 (based in Darwin, Australia; Vaughan et al., 2008; Brunner et al., 2009), and SCOUT-AMMA (from Ouagadougou, Burkina
5576 S. Borrmann et al.: Aerosols in the tropical and subtropical UT/LS
1
Figure 1 (FIGURES‐100504)
1
2
3
4
5
6
7
8
9
10
11
12
13
14
15
16
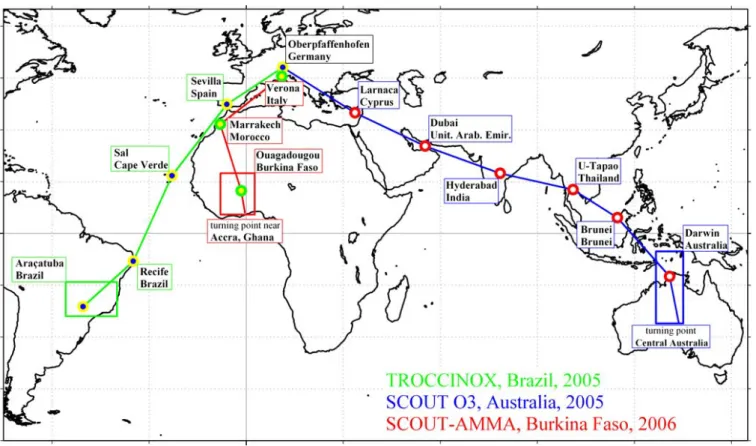
Fig. 1. Routes of the transfer flights for the M-55 “Geophysica” with intermediate landings between January 2005 and August 2006. The
boxes indicate the areas where local research flights were carried out.
Table 1. Locations and times of the tropical campaigns TROCCINOX, SCOUT-O3, and SCOUT-AMMA with the Russian M-55
“Geophys-ica” and the German DLR Falcon-20 research aircraft.
TROCCINOX SCOUT-O3 SCOUT-AMMA
Time period Jan–Mar 2005 Nov–Dec 2005 Jul–Aug 2006
Location of local mission flights Arac¸atuba Brazil Darwin Australia Ouagadougou Burkina Faso at latitude and
lon-gitude 21◦803700S lat. 50◦2503400W long. 12◦280000S lat., 130◦500100E long. 12◦2201300N lat. 1◦3102900W long. Transfer flights originating from Oberpfaffenhofen Germany Oberpfaffenhofen Germany Verona Italy at latitude and longitude 48◦50000N lat. 11◦170000E long. 48◦50000N lat. 11◦170000E long. 45◦2304500N lat. 10◦5301900E long. Transfer flight
time period to cam-paign site 20 Jan 2005 until 27 Jan 2005 4 Nov 2005 until 12 Nov 2005 31 Jul 2006 until 1 Aug 2006 Return transfer flight period 24 Feb 2005 until 2 Mar 2005. 9 Dec 2005 until 17 Dec 2005 16 Aug 2006 until 17 Aug 2006 Campaign website http://www.pa.op.dlr.de/
troccinox/
http://www.ozone-sec.ch.cam. ac.uk/scout o3/field campaigns/ Darwin/
http://amma.igf.fuw.edu.pl
Reference for cam-paign overview
Schumann (2005) Vaughan et al. (2008), Brunner et al. (2009)
S. Borrmann et al.: Aerosols in the tropical and subtropical UT/LS 5577 Faso; Cairo et al., 2010a). Also data are shown from the
transfer flights to the various campaign locations. The flight routes of these transfers are shown together with the inter-mediate stops in Fig. 1. Table 1 provides relevant details of the campaigns, the transfers, as well as websites for the par-ticipating research aircraft, their instrumentation, and flight patterns. In the time frame of the M-55 “Geophysica” trans-fer flights to Brazil and to Australia the DLR Falcon-20 also travelled at lower altitudes to these campaign locations per-forming measurements underway.
2.1 Atmospheric background in 2005 and 2006
The following paragraphs briefly describe – mostly from a trace gas measurement perspective – the broader atmospheric situation during which the campaigns were performed.
Quasi biennial oscillation: According to the analysed data from the Singapore station (as presented by the Institute for Meteorology, Freie Universit¨at Berlin), the QBO (marked by the 10 m/s isotachs) was in its westerly phase between 80 to 30 hPa in January 2005 and between 80 and 70 hPa still in September 2005. Afterwards the easterly phase was fully established throughout the stratosphere. The follow-ing downward propagatfollow-ing westerly phase passed the 30 hPa level in February 2006 and reached flight altitudes in May 2006. Thus TROCCINOX took place in the westerly phase, SCOUT-O3 in the easterly, and SCOUT-AMMA again in the beginning westerly QBO phase (Cairo et al., 2010a; Brunner et al., 2009).
Boundary layer influence through convective outflow: SCOUT-AMMA was performed during the West African monsoon wet season. In order to characterize the TTL over West Africa Homan et al. (2010), analysed CO, CO2, and
other trace gas data. From the CO2 measurements they
conclude that convective outflow significantly influenced the composition of the TTL between the 350 K and 370 K poten-tial temperature levels by importing boundary layer air. At the same time the ozone data indicate the presence of more aged air. Law et al. (2010), analysed air mass origins in the TTL during August 2006 using domain filling trajecto-ries over West Africa. Whilst most air masses were already residing in the TTL during the 10 days prior to the measure-ments, up to 39% of the air masses in the mid-TTL below 370 K were “perturbed” by injection of lower tropospheric air from Asia, India, and oceanic regions (Law et al., 2010). Fierli et al. (2010), used a regional mesoscale model together with the M-55 “Geophysica” observations of water vapour, ozone, CO2, and aerosol to demonstrate that signatures of the
detrainment from deep convection of mesoscale convective systems can be found as high as 17 km, and possibly higher in some cases. Furthermore, the vertical ozone profiles seem to indicate (Homan et al., 2010) that – in comparison with West Africa in August 2006 – the TTL over Darwin in
De-cember 2005 was much more influenced by uplift from the regional boundary layer.
Cross hemispheric transport: Real et al. (2010) used BOLAM mesoscale model calculations (Fierli et al., 2010) in conjunction with trace gas measurements to confirm the presence of biomass burning plume remnants from central African fires in the upper troposphere. These were sampled during the M-55 “Geophysica” flight on 13 August 2006 with corresponding signatures in CO, CO2, NO, NOy, and
submicron aerosols. According to their study the pollutants remained over central Africa for 9 to 12 days before being lifted to the measurement altitude near Accra at 350 K to 360 K potential temperature altitudes. Thus interhemispheric transport may contribute to the composition of the TTL over West Africa.
Overshooting convection: Also from the analyses of two flights by Homan et al. (2010), it was concluded that over-shooting convection did not have a major influence on the TTL composition for West Africa, while the in-situ mea-surements from Northern Australia, and also from Brazil provided direct evidence for this process (de Reus et al., 2009; Corti et al., 2008). Fierli (unpublished) and Khaykin et al. (2009), do show evidence for overshooting over West Africa. As a result evaporation of the ice particles lead to hy-dration within the TTL and lower tropical stratosphere (Corti et al., 2008) during TROCCINOX and SCOUT-O3.This is in reasonable agreement with the analysis of Law et al. (2010), although they found an influence from lower stratospheric air in the mid and upper TTL during the SCOUT-AMMA cam-paign period.
Isentropic mixing of extratropical stratospheric air and cross subtropical tropopause transport: Based on the in-situ measurements of N2O Homan et al. (2010), estimated
the contribution of aged extratropical stratospheric air within the TTL over West Africa to be zero at levels up to 370 K and to be smaller than 20% at higher altitudes (≈390 K). 2.2 Instrumentation for submicron particle and trace
gas measurements
The aerosol number concentration of ambient aerosol par-ticles with size diameters between 6 nm and roughly 1 µm was measured using two independent COndensation PAr-ticle counter Systems (COPAS, Weigel et al., 2009), each having two channels. Three of the four channels sam-ple the ambient aerosol with cut-off diameters (in terms of 50% detection efficiency) of 6, 10 and 14 nm, respec-tively. Because of the inlet design the upper size limit for the sampled particles is roughly 1 µm. The total aerosol number concentration in cm−3 for particles with diameters larger than 6, 10 and 14 nm is denoted as N6, N10 and N14 throughout this paper, while the particle mixing ratios
(in number of particles per milligram of air) are given in lower case as n6, n10, n14, or n. The fourth channel heats
5578 S. Borrmann et al.: Aerosols in the tropical and subtropical UT/LS 2
Figure 2:
1718
19
20
21
22
23
24
25
26
27
28
Fig. 2. Number densities and variability of submicron particles N5, N6, N10 (i.e. with size diameters larger than 5 nm, 6 nm, 10 nm, and smaller than ≈1 µm) as function of geographical latitude and altitude (in potential temperature) from the transfer flights. In all panels the filled dots and open circles associated with the black lines represent medians of five degree latitude bins and the coloured data points are 15 s flight time averages. Upper left panel: The line with the open circles includes flights between Germany and Brazil (20 to 27 January 2005; return: 24 February until 2 March 2005). The filled symbols refer to the transfer to Australia (4 until 12 November 2005) and back (9 until 17 December 2005). Upper right panel: Concentrations (N10)of the transfers from Europe to Burkina Faso (31 July and 1 August 2006) and back (16 and 17 August 2006). Lower panels: Latitudinal profiles of N5in the 9 to 12 km altitude band between Europe and Brazil (left) and between Europe and Australia (right).
250◦C (for a flow rate dependent duration between 3 and 6 s) prior to the detection of the grown droplets. This way volatile ambient particles completely evaporate and only par-ticles containing non-volatile residues larger than 10 nm are counted as number density N10nv (cm−3) or mixing ratio n10nv (mg−1). For stratospheric measurements this implies that binary solution droplets of sulphuric acid and water or ternary H2SO4/H2O/HNO3 droplets evaporate resulting in
zero counts of this channel. Only if, for example, particles of meteoric origin are contained inside these growing droplets their metallic or mineral core will not evaporate and the resid-ual particles are detected as non-zero counts (see e.g., Curtius et al., 2005).
From the 1 Hz data delivered by COPAS typically 15 s av-erages are calculated and displayed as running means in the figures below. The counting statistics are such that the sensor detects around 100 counts per second for ambient concentra-tions as low as 20 particles per cm3. Only at atmospheric particle concentrations as small as 2 cm−3the count rate of the heated channel can drop to values as low as 30 per 15 s.
In such (rare) circumstances fluctuations in the data may be due to counting statistics. At the cruise speed of the M-55 “Geophysica” (near 200 m s−1)these 15 s flight-time aver-ages correspond to 3 km horizontal resolution along the flight path and for the typical ascent rate of 10 m s−1a vertical res-olution of 150 m results for the vertical profiles. The data of this paper represent the aged aerosol fraction because ei-ther no “new particle formation” events occurred during the flights or such data were removed. (Usually such “nucleation events” are associated with particle number densities N6
be-ing much larger than N14(Curtius et al., 2005; Heintzenberg
et al., 2003).) A full experimental characterisation of CO-PAS with laboratory and aircraft borne experiments has been performed by Weigel et al. (2009).
Also on board of the M-55 “Geophysica” a Multiwave-length Aerosol Scatterometer (MAS; Cairo et al., 2004, 2010b; Buontempo et al., 2006) was operated, which is a backscatter sonde for in-situ measurements of optical air and aerosol parameters. The MAS measures volume backscat-ter ratio and depolarization ratio of the air in the vicinity of
S. Borrmann et al.: Aerosols in the tropical and subtropical UT/LS 5579 the aircraft at 532 nm and 1064 nm with a time resolution of
5 s. For the backscatter ratio the measurement precision is 5% and the accuracy 0.05. Its data can be used for the de-tection of cloud and aerosol particle ensembles and based on the polarization measurements, shape, and hence phase, of the optically active particles (i.e. those with size diameters larger than approximately 0.2 µm) can be discerned.
Nitrous oxide was measured on the M-55 “Geophysica” with 90 s time resolution by means of the High Altitude Gas Analyzer (HAGAR; Volk et al., 2000; Homan et al., 2010) which is a two-channel in-situ gas chromatograph. The pre-cision and accuracy of the N2O measurements is better than
1.5%. Carbon monoxide measurements were provided with 0.25 Hz sampling rate, a lower detection limit of a few ppbv, 1% precision, and 6–9% accuracy by the COLD (Cryogeni-cally Operated Laser Diode; Viciani et al., 2008) instrument. The Fast OZone ANalyzer (FOZAN; Yushkov et al., 1999; Ulanovsky et al., 2001) delivered ozone mixing ratios at a rate of 1 Hz with an accuracy of 10%. The ambient tem-perature, was measured using a Thermo Dynamic Complex (TDC) probe with an accuracy of 0.5 K (Shur et al., 2007), while other relevant parameters as position and true air speed have been adopted from the onboard navigational system UCSE (Unit for Connection with the Scientific Equipment; Sokolov and Lepuchov, 1998).
Measurements of particle concentrations (here N7, N10
and N5)also were performed on board of the DLR
Falcon-20 within the 9 to 12 km altitude band deploying a set of on board CPCs (Weinzierl et al., 2009; Minikin et al., 2003). Other data for this paper originate from balloon-borne in-situ measurements by means of a condensation particle counter (Rosen and Hofmann, 1977) during the SCOUT-AMMA campaign (2006) from Niamey, Niger, Africa. The particle measurements from the DC-8 and WB-57F (both NASA op-erated) were performed between 1999 and 2007 adopting a CPC of type NMASS from the University of Denver (Wilson et al., 1983; Brock et al., 2000). The Russian M-55 “Geo-physica” and the NASA WB-57F are high altitude research aircraft capable of reaching 21 km and 16 km, respectively, while the NASA DC-8 and DLR Falcon 20 have a ceiling near 12 km, and the balloons ascend to ≈30 km. These plat-forms provided access to the tropical middle and upper tro-posphere, the lower stratosphere, and the TTL.
3 Results and discussion
3.1 Background concentrations of submicron particles in the UT/LS
The latitudinal distribution of the measured particle num-ber concentrations N5, N6, N10from the transfer flights (see
Fig. 1, Table 1) is shown in Fig. 2. The upper panels cover al-titudes between 12 km (2 ≈ 350 K) and 18.7 km (2 ≈ 460), and the lower panels correspond to potential temperatures
3 Figure 3: 29 30 31 32 33 34 35 36 37 38 39 40
Fig. 3. Summary of the submicron particle concentration latitude
profile data of Fig. 2 from the transfers of the DLR Falcon-20 and the M-55 “Geophysica” between Europe and Brazil, Australia, West Africa in 2005 and 2006.
from 315 K to 355 K for the altitude range from 9 km to 12 km. Figure 3 shows the medians of this data, including additional DLR Falcon-20 measurements from the transfers to West Africa which are not shown in Fig. 2.
From the data at potential temperature levels above 367 K, and slightly above the tropopause, an increase in particle number densities from values near 20 cm−3 at higher lat-itudes to values around 100 cm−3 can be seen in Figs. 2 and 3 for the transfer routes. The increase towards the tropics originates from the fact that the M-55 “Geophysica” was mostly flying at constant cruising altitudes (and always above the tropopause) which implies that in the northern lat-itudes stratospheric air was sampled and at lower latlat-itudes air masses closer to the tropopause were encountered. Al-though in Fig. 3 there are small differences between the M-55 “Geophysica” measurements during these transfers, over-all the values and their latitudinal changes are remarkably close. The number concentrations of 10 to 50 particles per cm3 from the M-55 “Geophysica” flight across the Saha-ran desert in Fig. 3 fit well into the Saha-range of concentrations found at the same latitudes during the other flights. Thus for the times between January 2005 and July 2006 the mea-sured number densities of small particles were fairly homo-geneous along the different latitude bands. At lower altitudes within the 315 K to 355 K levels the DLR Falcon-20 data show values between 100 and 500 particles per cm3. From six CARIBIC flights across Africa in the year 2000 Heintzen-berg et al. (2003) reported values for N18, which were up to
factor of five higher than what we measured for N14during
the SCOUT-AMMA transfers. Since the flight altitudes of the DLR Falcon-20 and the CARIBIC commercial airliners were well within the tropical mid to upper troposphere, it is not surprising that the number densities differ and that the variability – as seen in the lower panels of Fig. 2 – is much larger than above the tropopause.
5580 S. Borrmann et al.: Aerosols in the tropical and subtropical UT/LS
Fig. 4. Vertical profiles of COPAS particle mixing ratios as function of potential temperature (in K) for the transfer to/from Darwin and
the local flights in Australia. The symbols are medians of 10 K bins and the bars denote 25% and 75% percentiles. Left panel: Vertical
n10profile measurements during the intermediate descents and ascents from the transfer flight airports between Oberpfaffenhofen (“OPH”, Germany) and Darwin (Australia). The denominations (and colours) refer to the geographical locations of these airports with “m” (dark green), “st” (blue), and “t” (red) standing for “mid-latitude”, “sub-tropical”, and “tropical”. Similarly, the mid-latitude and sub-tropical data are comprehended in the blue and green curves. Right panel: Vertical profiles of n10obtained over Darwin. Here the colour code refers to the flight dates on the right side of the legend and the small points represent 15 s averages. The potential temperature of the cold point tropopause was near 375 K.
3.2 Vertical profiles of submicron particle mixing ratios in the tropical UT/LS between January 2005 and August 2006
A subset of the n6, n10, n14, n10nv vertical profiles obtained
from the transfers to and from Darwin and the local flights from Darwin and Ouagadougou is shown in Figs. 4 and 5.
The left panel in Fig. 4 contains the COPAS vertical pro-file measurements from the landings and take-offs for the intermediate stops between Germany and Australia. The data are classified into tropical, sub-tropical, and mid-latitude profiles. For this placement of the respective airport lo-cations the updated “K¨oppen-Geiger climate classification” was adopted (Kottek et al., 2006). Evidently, the particle mixing ratios over the entire altitude range increase towards the tropics (left panel). The right panel contains the data from the individual local flights over Darwin showing a distinct
maximum between 360 K and 380 K. (Note: According to the flight trajectories the values above 8000 particles per mg on 16 November 2005 at 360 K may have been caused by the M-55 “Geophysica” crossing its own contrail; Weigel et al., 2009). Figure 5 contains the local profiles from Oua-gadougou in West Africa. Here the right (green) ensemble of points also indicates a strong increase of particle mixing ratios (like in the right panel of Fig. 4) near 360 K within the TTL. (The red points (left curve) are discussed in Sect. 3.4.) For placing the measurements into a more general perspec-tive a summary of the data is provided in the left panel of Fig. 6. The vertical profiles from Brazil, Burkina Faso, and Australia are shown (both: M-55 “Geophysica” above 350 K, and DLR Falcon-20 below 340 K) together with previously published data (Brock et al., 1995) from extratropical lati-tudes (purple line) and the tropics (black line). The cold point tropopause above Ouagadougou was between 365 and 370 K,
S. Borrmann et al.: Aerosols in the tropical and subtropical UT/LS 5581 above Darwin around 375 K, and near 380 K over Arac¸atuba.
The tropical profile from Brock et al. (1995) contains data from northern and southern hemispheric tropical locations between 1987 and 1994, where the Pinatubo period was re-moved. Between roughly 340 K and 440 K all tropical pro-files exhibit remarkable closeness over the 19 years and over the different locations around the globe. At the same time the significant difference between tropical and extratropical profiles is evident (also when comparing with the left panel of Fig. 4). Apparently – somewhat in analogy to the (global) stratospheric Junge layer higher above – a kind of layer of small particles spans the tropical band with maximum mix-ing ratios between 340 and 390 K. This broad maximum ex-tends from below the TTL to above the thermal tropopause. Based on model calculations and trajectory analyses (Pl¨oger et al., 2010; Kr¨uger et al., 2009; Fueglistaler et al., 2004) the time for upward transport from 340 K to 400 K roughly is 1 to 2.5 months. Thus the interpretation from Brock et al. (1995), of the tropical upper troposphere being a source for stratospheric particles seems to be valid for the global tropical latitude belt. Furthermore, when disregarding the long time gaps between the samplings and ignoring the large perturbations caused by the 1991 Mt. Pinatubo eruption, the profiles in Fig. 6 suggest that the characteristics of this par-ticle source have remained rather constant over almost two decades. At altitudes between 440 K and 500 K some dif-ferences occur, the origin of which remains unclear. For the observations in Burkina Faso a small volcanic eruption is the most likely cause (see Sect. 3.4). The increase over Brazil probably is connected with import of mid-latitude air because Arac¸atuba is at 22◦S and close to the subtropical jet.
The closeness of the tropical vertical profiles allows us to formulate a parameterisation of submicron particle abun-dance for the use in microphysical, chemical, or global chem-istry and transport models. The parameterisation n(θ ) in Eq. (1) represents the tropical n10 particle background
mix-ing ratios in number of particles per milligram of air as mea-sured with the COPAS systems during the 2005/2006 tropical campaigns (excluding the SCOUT-AMMA data from above 420 K because of the volcanic perturbation) and holds for al-titudes between 360 K and 480 K:
n(θ ) = c + A ·exp(−τ · θ ) (1)
c= 138.04 mg−1, A = 8.4038×10¹²mg−1, and τ = 0.060044 K−1.
A parameterisation according to Eq. (1) with differ-ent coefficidiffer-ents can be similarly derived from the Brock et al. (1995), data which then represents the time pe-riod from 1987 until 1994 and is valid between 360 K and 500 K: c=67.605 mg−1, A=7.2198×10¹¹mg−1, and τ = 0.053193 K−1.
Both parameterisations (see right panel of Fig. 6) are close to each other for potential temperatures below 420 K and above they are in agreement within a factor of two. The in-crease observed at higher altitudes with respect to the data
5 Figure 5: 51 52 53 54
Fig. 5. Vertical profiles of ambient particle number mixing ratios ni from all of the M-55 “Geophysica” local flights out of Oua-gadougou (Burkina Faso) in August 2006. The small points are 15 s averages and the open symbols represent medians of 10 K bins with 25% and 75% percentiles. The red points are the values for non-volatile particles (n10nv). The cold point tropopause during SCOUT-AMMA was roughly between 365 and 370 K.
from Brock et al. (1995), is of unknown origin. However the difference in number mixing ratios is small enough that – for most practical purposes – both sets of parameters can be used.
To further compare the M-55 “Geophysica” measurements with other tropical data, Fig. 7 juxtaposes the 2005/2006 profiles from Burkina Faso, Brazil and Northern Australia with results from the two NASA operated research aircraft WB-57F and DC-8. These measurements are from the campaigns: ACCENT (1999), SOLVE (1999), CrystalFace (2002), SOLVE2 (2003), the AURA Validation Experiment (2004, 2005, 2006) and TC4 (2007). The latitudinal range covered by the data extends from south of 23◦N to north of 23◦S (with the major part north of 5◦S). The M-55 “Geo-physica” data fit well into the range of values given by the NASA DC-8 and WB-57F measurements, which again demonstrates the uniformity of the tropical particle layer between the continents. Only above West Africa between 370 K and 390 K the mixing ratios seem to be slightly higher than over the other locations. Also, the West African profiles during SCOUT-AMMA significantly deviate towards higher particle number mixing ratios above 430 K due to a volcanic
5582 S. Borrmann et al.: Aerosols in the tropical and subtropical UT/LS
Fig. 6. Summary of all tropical profiles for submicron particle mixing ratios n from 2005 and 2006. The solid symbols in the left panel are
10 K potential temperature bins with medians, 25%, and 75% percentiles. The black (purple) line shows the results from Brock et al. (1995), representing tropical (extra-tropical) measurements with the NASA ER-2 between 1987 until 1994. The symbols with circles are n6(red and green), and n10(blue) COPAS data from the M-55 “Geophysica”. The measurements below 350 K are from the DLR Falcon 20 (red – n13; blue – n10; green – n5). Right panel: Two parameterisations derived from the n6, n10vs. potential temperature (2) data in the left panel. The lowest and highest levels of the cold point tropopause for SCOUT-AMMA, TROCCINOX, and SCOUT-O3 are indicated by the lines.
eruption (see Sect. 3.4). Clearly, considering the large scat-ter in the data for each potential temperature level in Fig. 7 the parameterisations according to Eq. (1) can serve only as guideline.
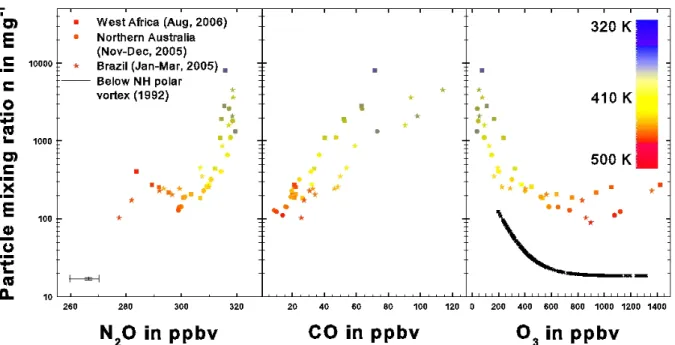
In Fig. 8 the correlations between the submicron particle mixing ratios and concurrent in-situ measurements of N2O,
ozone and CO are presented in order to provide some “map-ping” of the aerosol data on trace gases related to atmo-spheric dynamics. Since the gas phase variables are mea-sured in different sampling periods (from 1 s for ozone, 4 s for CO, to 90 s of N2O), and because the data are binned in
10 K potential temperature intervals, the number of result-ing vertical profile data points is not large. There is a pos-itive correlation between CO and the particle mixing ratio because of the import of pollution from upwind tropospheric sources like Asia and India for SCOUT-AMMA (Law et al., 2010) and from Indonesia (in connection with strong convec-tive activity there) for Darwin (Brunner et al., 2009). Real et al. (2010) showed that biomass burning activities took place in Central Africa at the time of the SCOUT-AMMA campaign and that these significantly influenced the air over
West Africa. Air parcels of a given CO abundance contained higher aerosol loadings (upper “branch” in the middle panel of Fig. 8) for West Africa and Australia than for Brazil (lower “branch”). This probably for the most part reflects the differ-ent intensities of the biomass burning activities in the three regions. The correlation between the mixing ratios of N2O
and the particles is compact with respect to the data from the different locations. The increase in particle mixing ra-tios with decreasing N2O over West-Africa (red squares in
the left panel of Fig. 8) is due to the influence of the canic eruption as discussed in Sect. 3.4. Under non vol-canic conditions the correlation probably follows the Brazil data (asterisks). For comparison one data point (266 ppbv of N2O, 17 particles mg−1)is shown as median of 97
mea-surements with 25% and 75% percentiles for both, N2O and
particle mixing ratios. This data is from the lower part and the outflow region of the 1992 northern hemispheric polar vortex. While N2O has a long lifetime, is well mixed within
the troposphere, and has only one sink in the stratosphere, the ozone abundance is influenced by tropospheric photo-chemical sources and is not well suited as dynamical tracer
S. Borrmann et al.: Aerosols in the tropical and subtropical UT/LS 5583 in particular in the tropics. As Law et al. (2010)
demon-strate, this might lead to differences in lower TTL gradients because the ozone concentrations in the TTL vary signifi-cantly in dependency of location and season. For these rea-sons it is not surprising that the data from the campaigns are on different “branches” of the correlations shown in the right panel of Fig. 8. Correlations between ozone and submicron particle mixing ratios with similar shape were described in Borrmann et al. (1995), for the lower part and the outflow re-gion of the polar vortex. For comparison a parameterisation of the corresponding NASA ER-2 measurements from Jan-uary 1992 is shown in the right panel of Fig. 8 as black line. Like the point with N2O=266 ppbv this data was obtained
six months after the large Mt. Pinatubo volcanic eruption and represents the altitude band from 12 km to 18 km (i.e. potential temperatures between 337 K and 441 K). Despite this eruption the submicron particle mixing ratios were sig-nificantly below the levels encountered in the tropics in 2005 and 2006. Inside the 1991/1992 polar vortex the particle con-centrations were low because of the subsidence of air from the mid-stratosphere and because at the time of the measure-ments not much Pinatubo aerosol had yet penetrated into the vortex interior. In this scenario ozone could well be used as dynamical tracer in correlations with the measured (accumu-lation mode) particle mixing ratios (Borrmann et al., 1995) roughly for time scales of up to 10 months.
3.3 UT/LS vertical profiles of submicron particle num-ber densities from mid-latitudes between 1999 and 2006
The data available from the test and transfer flights allow us to assess the variability of the particle number concentra-tions at northern-hemispheric mid-latitudes. The measured
N10 concentration data are shown in Fig. 9 as function of
pressure altitude and potential temperature for various Eu-ropean locations as well as for a large number of balloon flights from Laramie, Wyoming, USA (see Deshler et al., 2003). These mid-latitude profiles are remarkably close to-gether above 15 km, such that a parameterisation (including the balloon data) with respect to the potential temperature θ (for the range between 380 and 490 K) can be extracted:
N (θ ) = A0+A1·exp(−τ1·θ ) + A2·exp(−τ2·θ ), (2) with coefficients: A0= 6.8548 cm−3, A1= 2.6827×108cm−3, A 2= 4.6062×109cm−3, τ1=0.040062 K−1, τ 2=0.047782 K−1.
Here the particle number concentration N (in cm−3) is
calculated as function of 2 (in K) and to obtain the mix-ing ratio the correspondmix-ing factor includmix-ing ambient pressure and temperature needs to be applied. (We provide the con-centration profiles here rather than the corresponding mix-ing ratios because the temperature measurement system on the M-55 “Geophysica” was changed and tested and as con-sequence we do not have reliable data for several flights.)
Fig. 7. Overview over the available tropical and subtropical
in-situ aircraft measurements of submicron particle mixing ratios. The black points are data from the Caribbean, the Gulf of Mexico, and Hawaii from 1999 until 2007 and the yellow symbols denote their medians and percentiles (Source: University of Denver group). The coloured lines show the M-55 “Geophysica” measurements from Northern Australia (green), Burkina Faso (blue) and Brazil (red).
The closeness of the profiles indicates that in the mid-latitude lower stratosphere under background conditions the submi-cron particle population is under a stable equilibrium regime starting roughly 5 years after the 1991 Mt. Pinatubo erup-tion. In the time between 1999 and 2006 there was no major volcanic eruption and as result the background particle num-ber concentrations were significantly below the levels of the period between the 1982 and 1991 eruptions of El Chichon and Mt. Pinatubo (Borrmann et al., 1993, 2000; Brock et al., 1993). In the same time between 1999 and 2006 a signifi-cant increase of commercial air traffic occurred as the growth rates of revenue passenger miles consistently were near 5% per year according to IATA data. It had been conjectured that rising commercial air traffic may lead to increases in strato-spheric aerosol loadings (Hoffman, 1990). Judging from the – admittedly sparse – data sets in Fig. 9 most likely there are no striking increases in total particle number densities despite the strong changes in air traffic. If the air traffic in-fluences particles with sizes above the accumulation mode in the stratospheric background aerosol these influences may be
5584 S. Borrmann et al.: Aerosols in the tropical and subtropical UT/LS
8
Figure 8:
71
72
73
74
75
76
77
78
79
80
81
82
83
84
85
Fig. 8. Correlation of submicron particle mixing ratios n with trace gases N2O, CO, and ozone for West Africa, Northern Australia, and Brazil. The data points are medians of 10 K potential temperature intervals. The black curve in the right panel is a parameterisation of the 1992 NASA ER-2 data from below the northern hemispheric polar vortex for comparison (see text for details).
more subtle. It is important to keep in mind that at altitudes below ≈400 K the mid-latitudes are “flushed” with air from the tropics between July and October. During the remainder of the year the Brewer-Dobson circulation leads to an import of air from above. For this reason there is some variability in the profiles because these were measured at different seasons throughout the years.
3.4 Volcanic influence on the UT/LS aerosol over West Africa
The particle number mixing ratios in the vertical profiles from West Africa (2006) in Figs. 5, 6 and 7 show significant deviations from the other tropical profiles for altitudes above 430 K. These are atmospheric features because such devia-tions were not observed in the vertical profiles over Verona, Italy, and Marrakech, Morocco, during the transfer flights. An intercomparison of the COPAS data measured from the M-55 “Geophysica” over Ouagadougou, Burkina Faso, in August 2006, and the balloon borne CPC measurements of the University of Wyoming group over Niamey, Niger, (2◦100800E longitude, 13◦2901100N. latitude) on 31 July 2006 is shown in Fig. 10. Considering the different nature of the two platforms (i.e., fast flying aircraft vs. slowly ascending balloon) and the difference in location (Ouagadougou vs. Ni-amey with ≈430 km separation) the agreement between the two different instruments is good for the theta levels between 360 and 460 K. In the balloon data the rate of increase in mix-ing ratios with altitude is stronger than for COPAS at theta
levels above 450 K. Furthermore, the balloon data show that the enhanced particle number densities are reaching up to
≈550 K, forming a broad layer. The presence of this layer is confirmed also by Khaykin et al. (2009), where all bal-loon flights from Niamey are presented. Because the en-hancement does not occur in the mid-latitude and subtrop-ical profiles over Verona, Italy, and Marrakesh, Morocco, the stratospheric enhancement seems to be confined to the tropical belt. The most likely cause of these increases is the eruption of the tropical stratovolcano Soufri`ere Hills on Montserrat Island in the West Indies (16◦4205600N. latitude, 62◦110800W longitude, 1050 m a.s.l.), which occurred on 20 May 2006 (Carn et al., 2007) and roughly two months before the measurements in West Africa. The amount of SO2
in-jected into the stratosphere was estimated to be 0.1 Tg of sul-phur (i.e., the equivalent to 0.2 Tg of SO2)based on satellite
observations (Carn et al., 2007). In Fig. 5 the left curve (red points, square symbols) shows the measurements of non-volatile particle mixing ratios n10nvfrom the heated COPAS
channel. Above 420 K the absolute number of non-volatile particles decreases with altitude with increasing total particle number mixing ratios. Thus the ratio of non-volatile to total particle mixing ratios strongly declines with height. Also, the MAS backscatter sonde reported enhanced backscatter ratio with no depolarisation in this altitude region with peak values of 1.3 for the backscatter at 19.3 km. Profiles mea-sured by the balloon borne version of MAS, which was launched on different balloon missions from Niamey during SCOUT-AMMA, also regularly detected such increases in
S. Borrmann et al.: Aerosols in the tropical and subtropical UT/LS 5585 9
Figure 9:
8687
88
89
90
91
92
93
94
95
96
97
Fig. 9. Mid-latitude vertical profiles of COPAS particle number densities (N10)from the M-55 “Geophysica” flights between 2002 and 2006 (as medians of 10 K altitude bins and 25%, 75% percentiles). The grey line is an average profile from balloon borne CPC measurements of the University of Wyoming from 1996 until 2008. The yellow curve is the parameterisation of Eq. (2) as derived from the 380 K to 490 K data of this panel (note: The left and right ordinates do not correspond to each other).
backscatter. This supports the interpretation of the aerosols being of volcanic origin, because (1) the fraction of volatile (i.e. binary sulphuric acid-water solution droplets) particles becomes larger with altitude (see also Sect. 3.5) and (2) the non-depolarisation of the aerosol indicates the presence of spherical (i.e., liquid phase) particles. Although the Soufri`ere Hills eruption provided the largest single sulphur input into the stratosphere between 1991 and 2006, its amount was small compared to the 20 Mt of SO2 from Mt. Pinatubo
(Chapter 3 in WMO, 1999). Prata et al. (2007) showed by means of satellite cloud top temperature measurements that the overshooting of the eruption plume core from Soufri`ere Hills reached the stratosphere and the evolution of the cloud was tracked for example by CALIPSO measurements of SO2
(e.g., http://earthobservatory.nasa.gov). The eruption cloud developed inhomogeneities three days after the eruption and the air masses containing the volcanic SO2 were confined
mostly within the tropical belt while moving towards Africa. Such inhomogeneity is reflected in the particle mixing ratio data of the vertical profile in Fig. 10. Over Niamey, Niger, above 475 K, values near 1000 particles per milligram of air were encountered on 31 July 2006, while the air masses sam-pled over Burkina Faso 4–13 days later contained mixing
ratios only half as high. Between 375 K and 450 K the in-struments show identical values for both locations. From the vertical profile two months after the eruption it can be con-cluded, that the ageing of the volcanic aerosol had not yet proceeded to the point where sedimentation of the particles from the layer above 18 km enhances the number densities found in the TTL. Similarly, after the Pinatubo eruption it took more than six months (in mid-latitudes) until the aerosol at the tropopause had significantly increased (Borrmann et al., 1997; Keim et al., 1996).
3.5 Non-volatile components in the tropical UT/LS sub-micron aerosol
From the values for N10nv and N10 it is possible to
calcu-late the non-volatile fraction, f . This is the number den-sity N10nvof particles which do not evaporate when heated
to 250◦C divided by the total number concentration N10 of
ambient particles. The resulting vertical profiles from the tropical data are shown in Fig. 11 for South America, North-ern Australia, and for West Africa. The two profiles over Australia and Burkina Faso exhibit a broad maximum for f between 360 K and 460 K with its highest value at 400 K.
5586 S. Borrmann et al.: Aerosols in the tropical and subtropical UT/LS 10
Figure 10:
9899
100
101
102
103
104
105
106
107
108
Figure 11: (next page)
109Fig. 10. Intercomparison of the individual n10 particle mixing ratio measurements of the balloon launch on 31 July 2006 from Niamey, Niger, with the n14data of all local M-55 “Geophysica” flights from Ouagadougou (Burkina Faso). The COPAS data points in the left panel represent 15 s averages while the balloon data (larger red points) are averaged over 5 s. In the right panel the same data are displayed as function of potential temperature with the blue points designating the median (with 25% and 75% percentiles) from 10 K altitude bins (note: The left and right ordinates do not correspond to each other).
This peak roughly extends from the thermal tropopause well into the lowermost stratosphere and includes the upper part of the TTL. Such a maximum is not present in the data from Brazil where the ratio f remains fairly constant around 20% from 390 K to 490 K. At 360 K the ratio f attains values near 10%. (For comparison: Values as high as 70% to 80% were reported by Curtius et al. (2005), for meteoric dust subsiding inside the polar vortex within the same potential temperature band.) We believe this decrease in non volatility from 400 K to 360 K in Fig. 11 is not an instrumental artifact, because (1) the efficiency of the pre-heating device of the N10nv
chan-nel was extensively characterised in the laboratory (Weigel et al., 2009) for low pressures (70 hPa to 300 hPa) and (2) the values for f from the DLR Falcon-20 well match those from the M-55 “Geophysica” at 350 K for SCOUT-AMMA while the difference for TROCCINOX at 350 K is not large.
With altitude above roughly 400 K the non-volatile frac-tion f decreases in all profiles (except for Brazil), which in-dicates that the higher one probes into the stratosphere the more the volatile sulphuric acid-water solution droplets dom-inate the aerosol. This certainly is the case for the measure-ments over West-Africa, where f is below 10% at the highest altitudes because of the volcanic contribution. A significant increase, however, is observed in the profiles over Northern Australia above 460 K for which we do not have an
expla-nation. The lowest levels of f (near 5%) observed at high altitudes over West Africa are most likely a consequence of the Caribbean volcanic eruption because after an eruption the oxidation of the gaseous SO2to H2SO4leads to binary
H2SO4/H2O solution droplets.
It is difficult to find conclusive explanations for the ob-served vertical profiles of f without additional measure-ments and model calculations. Despite the lower non-volatile
fraction the absolute number densities of non-volatile
parti-cles below the tropopause still is similar or larger than in the lower stratosphere. This follows from the higher total am-bient particle number densities as can be seen for example in Fig. 5. For the differing profile from Brazil it should be borne in mind that the flights were performed at latitudes near 22◦S, which is at the Southern edge of the tropical belt and close to the subtropical jet. Differences between the dry and wet seasons, the position of the ITCZ, and the level of biomass burning activity play a role for the volatility of the sampled particles. The non-volatile cores of the parti-cles most likely are not a result of gas-to-particle conversion processes. This implies that these particles originate from the local or remote boundary layer and may have undergone in-cloud processing during upward transport. The minimum of f at 360 K might be a result of cloud scavenging (or ice cloud formation) at or below the tropopause. The volatile
S. Borrmann et al.: Aerosols in the tropical and subtropical UT/LS 5587
11
110
Fig. 11. Ratio f of non-volatile particle number concentration N10nv to total ambient particle number density N10 as function of altitude (points: 15 s flight time averages; Symbols: medians, 25% and 75% percentiles of 10 K bins). The data are from the lo-cal flights over Arac¸atuba (Brazil, 2005), Darwin (Australia, 2005), West Africa (red points and line above 360 K). Similarly, thermod-enuder measurements of N7from the DLR Falcon-20 are included (without individual data points) where available for potential tem-perature levels below 350 K.
H2SO4/H2O droplets are subject to scavenging also.
How-ever for those droplets there would be two sources, namely in-situ formation in the TTL and transport from below, while for the non-volatile particles there is only uplift from be-low. This could result in a decrease of f at the tropopause. Clearly such arguments remain speculative without detailed modelling and further measurements. Also, without direct measurements of the chemical composition of these particles (e.g., like in Murphy et al., 1998; Froyd et al., 2009, 2010; or Schmale et al., 2010) no conclusive explanation for the ob-served features in the profiles can be given. If – as concluded by Brock et al. (1995) – the tropical upper troposphere is a source reservoir of aerosol particles for the global strato-sphere, then our data suggest that those particles arriving in the tropical stratosphere contain significant amounts of non-volatile components. Following Froyd et al. (2009), this can be due to the fact, that convection rapidly carries air from the boundary layer aloft and that often biomass burning residues reach the tropical UT/LS.
4 Summary and conclusions
In this contribution we present aircraft-borne in-situ mea-surements of submicron particle abundance and volatility from the 9 to 12 km altitude range, the UT/LS, and the TTL over Southern Brazil (TROCCINOX campaign, 2005), West Africa (SCOUT-AMMA, including balloon-borne measure-ments from Niger, 2006), and Northern Australia (SCOUT-O3, 2005). Also measurements are considered from previ-ous campaigns with NASA high altitude research aircraft in Hawaii and Costa Rica dating back to 1999.
The transfer flights from Europe to the tropical campaign locations showed that at potential temperature levels above 367 K the ambient particle number densities range from 20 cm−3at higher latitudes to values around 100 cm−3in the tropics and that the geographical distribution of the particle abundance was rather homogeneous along the different lati-tude bands.
The vertical profiles of the particle mixing ratio over West Africa, Brazil and Northern Australia between 55◦N to 20◦S are remarkably similar within the potential temperature band from 340 K to 430 K and fit well into the earlier data from 1987 to 1994 (Brock et al., 1995). The tropical vertical profiles all show a broad maximum of particle mixing ra-tios in the altitude band between 340 K and 390 K. Since the maximum extends from below the TTL to above the ther-mal tropopause, this supports the suggestion by Brock et al. (1995), that the tropical aerosol layer acts as a continuous source of particles for the maintenance of the global strato-spheric Junge aerosol layer. Above 430 K, the profiles from 2005 and 2006 differ from the 1987 to 1994 data by show-ing higher values at all levels up to roughly 500 K. Only for the vertical profiles over West Africa from 2006 do we have an explanation: the volcanic eruption of Soufri`ere Hills on
5588 S. Borrmann et al.: Aerosols in the tropical and subtropical UT/LS Montserrat is the likely cause of that increase. However, at
all altitudes the data are reasonably compact and a parame-terisation for use in models could be extracted.
Correlations of the measured aerosol mixing ratios with N2O and ozone exhibit compact relationships for all three
tropical campaigns. The volcanic enhancement over West Africa caused high particle mixing ratios to be associated with low N2O. Correlations with CO exhibit a likelihood
– but not a compact correlation – of high particle abun-dance with high CO. Probably this is a result of the different biomass burning source characteristics over the three conti-nents.
Analyses of the vertical profiles at mid-latitudes show that the particle number densities as function of altitude re-mained fairly constant with time between 1996 and 2008 above 15 km. No major trends of increases or decreases can be discerned from the available (and small) data base.
The measurements of the non-volatile number fraction of the submicron particles provided useful – albeit limited – ad-ditional information on the particle properties in the trop-ical UT/LS region. In the profiles over West Africa the proportion of volatile particles increases with altitude. This is in agreement with the notion that at higher altitudes binary sulphuric acid/water solution droplets are the major aerosol constituents resulting from the volcanic eruption. Over West Africa and Northern Australia a broad maximum with 55% of the particles containing non-volatile cores was found di-rectly at and above the tropical tropopause. The profiles from Brazil exhibit constant non-volatile fractions of 20% to 25%, without maximum, for altitudes above 390 K. The measure-ments in Brazil took place close enough to the subtropical jet region, such that mixing with extratropical air masses may have led to the differing profiles here. If the tropical upper troposphere provides a reservoir of particles for the strato-spheric Junge aerosol layer, then these “source”-particles consist of not only sulphuric acid and water, but also of non-volatile components. A variety of processes may be respon-sible for the observed vertical profiles of non volatile parti-cle number densities including deep convection of boundary layer air, biomass burning residues being uplifted into the tropical UT/LS, and long-range transport of pollutants.
Advanced instrumentation and modeling, as well as more field campaigns specifically dedicated to the properties of the aerosols and clouds in the TTL and the tropical UT/LS are much needed in order to clarify some of these issues, which have strong links to radiation, climate, and atmo-spheric chemistry. Better geographical coverage with trop-ical UT/LS data is very important, especially over Africa, South East Asia and the oceans.
Acknowledgements. The SCOUT-O3 and TROCCINOX projects
were funded by the European Commission through Contracts 505390-GOCE-CT-2004-505390 and EVK2-2001-00122. The M55 “Geophysica” campaign was supported by the EEIG-Geophysica Consortium, CNRS-INSU, EC Integrated Projects AMMA-EU (Contract Number 004089-2), SCOUT-O3, CNES,
and EUFAR. The DLR Falcon-20 campaigns were funded through TROCCINOX, SCOUT-O3, AMMA-EU, and DLR. The balloon-borne experiments of the University of Wyoming received fund-ing from the US National Science Foundation (ATM-0437406) and J. C. Wilson acknowledges the NASA Upper Atmosphere Research Program and Radiation Sciences Program for supporting the mea-surements and data analysis presented here.
Based on a French initiative, AMMA was built by an international scientific group and funded by a large number of agencies, espe-cially from France, the United Kingdom, the United States, Africa, and – for us – German sources. It has been a beneficiary of a major financial contribution from the European Community Sixth Frame-work Programme (AMMA-EU). Significant financial support for our activities with the M-55 “Geophysica” in Brazil, Australia, and Burkina Faso also was supplied by the Max Planck Society. S.B. would like to extend special thanks to Susan Solomon for intense discussions, and gratefully acknowledges the support for his 2009 sabbatical from the NOAA Chemical Sciences Division in Boulder, CO, USA. The help of Andreas K¨urten, (Goethe University of Frankfurt, Germany) for the primary data quality control and data collection in Darwin, Australia, is gratefully acknowledged as are helpful comments from Thomas Peter (ETHZ). We thank Stefano Balestri, Ana Alfaro Martinez (ERS), and the entire “Geophysica” crew (in particular the pilots and engineers). Also we acknowledge logistical support from the AMMA Operations Centre in Niamey, Niger. The local authorities, scientists and staff in Darwin (Australia), Arac¸atuba (Brazil), and Ouagadougou (Burkina Faso) were excellent hosts, and we thank for their collaboration, hospitality and often extraordinarily un-bureaucratic efficient help during these difficult and challenging campaigns in the tropical environments.
The service charges for this open access publication have been covered by the Max Planck Society. Edited by: R. MacKenzie
References
Borrmann, S., Dye, J. E., Baumgardner, D., Wilson, J. C., Jonsson, H. H., Brock, C. A., Loewenstein, M., Podolske, J. R., and Ferry, G. V.: In-situ measurements of changes in stratospheric aerosol and the N2O-aerosol relationship inside and outside of the polar vortex, Geophys. Res. Lett., 20, 2559–2562, 1993.
Borrmann, S., Dye, J. E., Baumgardner, D., Proffitt, M., Margitan, J., Wilson, J. C., Jonsson, H. H., Brock, C. A., Loewenstein, M., Podolske, J. R., and Ferry, G. V.: Aerosols as dynamical tracers in the lower stratosphere: The aerosol vs. ozone correla-tions after the Mount Pinatubo Eruption, J. Geophys. Res., 100, 11147–11156, 1995.
Borrmann, S., Solomon, S., Dye, J. E., Baumgardner, D., Kelly, K. K., and Chan, K. R.: Heterogeneous reactions on stratospheric background aerosols, volcanic sulfuric acid droplets, and type I PSCs: The effects of temperature fluctuations and differences in particle phase, J. Geophys. Res., 102, 3639–3648, 1997. Brock, C. A., Jonsson, H. H., Wilson, J. C., Dye, J. E.,
Baumgard-ner, D., and Borrmann, S.: Relationships between optical extinc-tion, backscatter and aerosol surface and volume in the