with geography textbooks
Yvonne Behnke
Nordidactica
- Journal of Humanities and Social Science Education
2016:1
Nordidactica – Journal of Humanities and Social Science Education Nordidactica 2016:1
ISSN 2000-9879
How textbook design may influence learning
with geography textbooks
Yvonne Behnke
Humboldt-Universität zu Berlin, Germany
Abstract: This paper investigates how textbook design may influence students’ visual attention to graphics, photos and text in current geography textbooks. Eye tracking, a visual method of data collection and analysis, was utilised to precisely monitor students’ eye movements while observing geography textbook spreads. In an exploratory study utilising random sampling, the eye movements of 20 students (secondary school students 15–17 years of age and university students 20–24 years of age) were recorded. The research entities were double-page spreads of current German geography textbooks covering an identical topic, taken from five separate textbooks. A two-stage test was developed. Each participant was given the task of first looking at the entire textbook spread to determine what was being explained on the pages. In the second stage, participants solved one of the tasks from the exercise section. Overall, each participant studied five different textbook spreads and completed five set tasks. After the eye tracking study, each participant completed a questionnaire. The results may verify textbook design as one crucial factor for successful knowledge acquisition from textbooks. Based on the eye tracking documentation, learning-related challenges posed by images and complex image-text structures in textbooks are elucidated and related to educational psychology insights and findings from visual communication and textbook analysis.
KEYWORDS:GEOGRAPHY TEXTBOOKS, TEXTBOOK DESIGN,IMAGE-TEXT RESEARCH,GRAPHICS, PHOTOGRAPHS,EYE TRACKING
About the Author: Yvonne Behnke is a graduate designer of visual
communication and a doctoral student of geography education at the Humboldt Universität zu Berlin. The main emphasis of her professional work and her scientific research is educational media. Her research focus lies in the visual aspects of educational media (print and digital), such as textbook design, image-text relationships, visuals (graphics, photos), textbook analysis and eye tracking as a visual analysis method.
Introduction
The collation and presentation of information in society today is becoming increasingly visual and spatial in nature (Lowrie et al. 2011). Information presented in textbooks, including geography textbooks, reflects the knowledge of a society (Bardy Bölsterli 2014). Consequently, how clearly, aesthetically and coherently information is visualised has become a crucial factor for successful knowledge acquisition from current geography textbooks. Nevertheless, visuals have traditionally possessed an important role in geography instruction, as “the creation and interpretation of visual images has always been important to geography and is what makes geography unique” (Thornes 2004, p.793).
In recent years, an increase in the number of visuals utilised in geography textbooks has been apparent (Janko & Knecht 2014). An analysis of contemporary geography textbooks reveals that they contain complex image-text structures and varied forms of visualisations (e.g., photos, infographics, maps, and satellite images). Hence, the challenge for learners is to identify and select the content-relevant information from the variety of depicted materials, then to organise that information into a coherent representation and finally to integrate this representation into existing knowledge (de Koning et al. 2010; Schnotz et al. 2014).
Notwithstanding the widespread use of visuals in geography textbooks, little is known about learners’ attention paid to visuals contained in geography textbooks. Within this context, Morgan (2014, p.75) stated that the design features of textbooks are perhaps the least considered or understood aspects of textbooks. Although Janko and Peskova (2013) analysed types of visuals utilised in geography textbooks, and Janko and Knecht (2014) developed a research instrument for sorting visuals in geography textbooks and assessing their instructional qualities, the need to conduct further research is also emphasised. Likewise, in the field of textbook research, to date only a few general recommendations have been made with regard to the learning-fostering design of visuals in geography textbooks (Fuchs et al. 2014). This recommendations mainly refers to well-known rules from Gestalt theory, such as figure/ground, proximity, similarity, and continuity (see LaSpina 1998), which has been supplemented by recommendations from multimedia learning (e.g., Cognitive Theory of Multimedia Learning, Mayer 2005), such as the signal principle, multimedia principle, and coherence principle.
Nevertheless, well-designed textbooks have the potential to make learning more fun, lasting, and meaningful, and may actively engage learners’ cognition in many ways (e.g., visual processing, analytical thinking, posing questions, testing hypothesis, and verbal reasoning) (Morgan 2014). Therefore, the instructional design of image-text combinations and the design of visualisations utilised in image-textbooks could be crucial factors that may influence their educational effectiveness (Janko & Peskova 2013; Peeck 1993).
Furthermore, assumptions from pedagogical psychology, such as the emotional
design hypothesis, suggest a relationship between learners’ positive emotions (e.g.,
(e.g., from textbooks) (Mayer & Estrella 2014). Moreover, studies have reported that positive emotional design may reduce the perceived difficulty of learning tasks, may increase motivation, satisfaction, and perception towards learning materials and may foster content comprehension (Park et al. 2015; Plass et al. 2010; Um et al. 2012).
In contrast, numerous studies in image-text research have revealed that students have some difficulty in interlinking complex image-text relations and processing information from visuals in textbooks (Hochpöchler et al. 2012; Mason et al. 2015; Schnotz et al. 2014). Hence, the aforementioned aspects indicate the importance of further research regarding the design and utilisation of visuals in geography textbooks. This paper thus investigates how the design components of current geography textbooks may influence students’ attention processes by examining the following questions: With what visual intensity do students utilise visuals in geography textbooks while completing a task? How does textbook design influence students’ visual attention to depicted graphics and photos? To answer these questions, interdisciplinary observation methods were applied to connect aspects of geography education and visual communication with aspects of text-image research and textbook research.
Theoretical Background
Current research investigates cognitive, affective and behavioural effects of learning with media with the aim of integrating emotion, motivation, and affective variables into existing models of learning with multimedia, such as Mayer’s (2005) Cognitive Theory of Multimedia Learning (CTML) (Park et al. 2014). Against this background, Moreno’s (2006) Cognitive affective theory of learning with media (CATLM) expands Mayer’s CTML by including emotional and motivational factors such as self-regulatory skills and learner preferences. Within this context, recent studies have revealed that cognitive processing and learning results in multimedia learning can be affected by constructs such as “situational interest”, “positive emotions”, or “confusion” (Leutner 2014).
These constructs may also affect learners’ visual attention (e.g., to depicted textbook elements). Visual attention is the first step in visual perception processes, even before sensory registration and cognitive processing of a visual stimulus (Geise 2011). Therefore, learners’ attention to specific textbook content should be the first step in knowledge acquisition from textbook elements, followed by conscious perception and information processing. Visual attention is the selective process that controls students’ awareness of the depicted textbook content and induces which details of the depicted materials students become conscious of (Pettersson 1995). According to Pettersson (1999), attention may be controlled automatically, guided by instructions or determined by the specific demands of a particular task. However, visual perception is extremely selective, and learners can focus their visual attention only on a small area of the depicted elements in a textbook spread at once (de Koning et al. 2009). Consequently, the aim of instructional design in the context of a
geography textbook should be to guide students’ attention visually through the depicted materials to support knowledge acquisition. Besides attention, content comprehension is important for knowledge acquisition from textbooks because the ability to extract the main ideas and concepts from depicted textbook elements is one crucial factor in constructing coherent representations (de Koning et al. 2010). Nevertheless, visual attention plays an important role in acquiring knowledge from textbooks, as it is an important prerequisite for content comprehension.
Eye movements reflect human thought processes (and also visual attention processes) and thus, they offer a “window to the mind” (Holsanova 2014). Eye tracking as a non-reactive reception concomitant method allows the recording of participants’ eye movements while observing a stimulus, thereby gaining insight into the process of media reception (Duchowski 2007; Geise 2011; Holmqvist et al. 2010).
With this method, eye movements such as saccades and fixations can be recorded and analysed. Saccades are rapid eye movements from one area of interest to another, while the visual perceptiveness is severely limited. During a fixation, the gaze stabilises over one area of interest, which enables the visual perception and cognitive processing of visual information (Duchowski 2007; Joos et al. 2003). The fixation duration may vary according to the task parameters (Rakoczi 2012). During the first stage of visual perception, eye movements are primarily driven by a visual match; thereafter, they are affected by conceptual matches (de Groot et al. 2015). Hence, a fixation duration from about 330 milliseconds shall be assumed for the conscious perception and cognitive processing of images (Joos et al. 2003; Geise 2011).
Two theoretical assumptions underlie the eye tracking methodology. The
immediacy assumption suggests that visual information will be processed immediately
when the information is encountered, and the eye-mind assumption states that processing visual information is closely linked to the focus of visual attention (Just & Carpenter 1980). Even though the absoluteness of the eye-mind assumption has been discussed for some time (i.a., Hyönä 2010), there is widespread agreement on a relationship between visual perception, visual attention and cognitive processing of information (Hochpöchler et al. 2012; Holsanova 2014; van Gog & Scheiter 2010).
However, eye movement patterns are highly individual and may vary according to task parameters (Rakoczi 2012). Moreover, eye tracking only depicts which areas are observed with what intensity, but not the results or why several areas are not observed (Rakoczi 2012; Voßkühler 2010). Therefore, it is necessary to triangulate eye tracking with additional evaluation methods (e.g., written evaluation, questionnaire, textbook analysis) and to interpret eye tracking data in relation to findings from other research fields (e.g., pedagogical psychology, information design).
Method and Random Sampling
Participants
In an exploratory random sample, eye movement data from 20 students (eight from secondary school, 15–17 years old; twelve university students 20–24 years of age; total M=19.3; SD=2.78; three male) were analysed. The university students were enrolled at Potsdam University, Germany in psychology, linguistics, biology or French language. Geography students were excluded from the study because the study did not rely on expert knowledge. The secondary school students came from different schools in the federal state of Brandenburg, Germany (grade nine to thirteen). 22 students participated in the experiment for either payment (10 euro) or course credit. Recorded data from two participants had to be excluded from the analysis because of missing data. Thus, data from 20 participants were analysed.
Materials
Participants’ eye movements were recorded by an EyeLink® 1000 (desktop mount) with a 1000-Hz sampling rate. The stimuli were comprised of five double-page spreads of German geography textbooks (2012–2013) from different German federal states covering an identical topic (the nutrition cycle in tropical rainforest). Taken from five separate textbooks (see Figure 1).
FIGURE 1
Objects of research (A-E)
For each selected textbook spread, the content was presented utilising similar elements: text, graphics, and photos. However, they differed with regard to their layout and their visual and textual content presentation. Furthermore, to ensure the
comparability of the textbook spreads with regard to the participants’ visual attention paid to the depicted textbook elements (graphics, photos, text), the topic “nutrient cycle in tropical rainforest” was selected on the grounds of the following criteria: (1) the topic is covered in the curricula for secondary schools of all German federal states, (2) the topic is developed through similar tasks, and (3) the topic had already been taught in the geography lessons of the participants. In Brandenburg, the topic “nutrient cycle in tropical rainforest” is covered in the curriculum for grade nine (the participants attended at least grade nine). Due to the German federal education system, this topic is covered in different grade levels (between six and nine) in several federal states. Therefore, the selected textbook spreads had been derived from textbooks of grade 9/10 (Berlin, Berlin/Brandenburg), grade 7/8 (Lower Saxony, Saarland) and grade 5/6 (Hessen). However, the selected grade 5/6 textbook spread from Hessen was printed identically in the grade 7/8 Edition for North Rhine-Westphalia (adopting textbook spreads with identical topics from editions of different federal states is a common practise of schoolbook publishers in Germany).
Procedure
A two-stage test with randomised test sequences was developed. Each participant observed five different textbook spreads on a screen in full colour and in random order. In the first stage, participants were given the task of observing the entire textbook spread to determine the issue explained on the textbook spread; meanwhile, participants’ eye movements were recorded. No time limitations were imposed during any of the test stages. During the second stage, the same spread appeared a second time and the participants completed one task from the exercise section while the participants’ eye movements were recorded a second time.
Based on the selected test tasks of spreads A–E, areas of interest (AOI) were defined. AOIs allow separate data recordings of each marked element (e.g. dwell duration, first entry, fixation count, order of observed AOI). In this study, AOIs are all textbook elements (graphics, photos, text) that contain information to solve the set task and all textbook materials that refer to the set task.
Eye tracking recordings demonstrate which areas of a textbook spread were observed with what intensity, but not with which result a task was completed. Therefore, after completing the task on the screen, the participants were asked to write down the task solution in keywords on an evaluation sheet. This evaluation sheet was collected directly after notation, thus no notes to previously observed textbook spreads remained with the participants. Overall, each participant observed five different textbook spreads (A–E) in two test stages, and completed five set tasks.
After completing the eye tracking examination, each participant completed a questionnaire. The questionnaire aimed to analyse participants’ preferences with regard to textbook design, and will be further specified in the results section.
The eye tracking data were aligned with the questionnaire, the written task evaluation and a textbook analysis of spreads A–E. Hereafter, the research results
were affiliated with educational psychology insights and insights derived from visual communication and textbook analysis.
Results
To analyse how the external characteristics (image-text ratio, image size) and image content of the depicted visuals influenced the participants’ attention while observing textbook spreads, the image-text ratio and image content of spreads A–E were determined by textbook analysis methods. Within this paper, data will be presented with a focus on the participants’ visual attention to the graphics, photos and text elements of the textbook spreads.
Eye Tracking Data
The eye-tracking test provided static visualisations (heat maps, gaze plots and trains of vision as PDF-files), dynamic visualisations (gaze replays as MP4-files) and numerical datasets (dwell duration, AOI). The static and dynamic data visualisations are graphical representations of the recorded eye tracking data. They allow researchers to visually retrace participants’ eye movements while observing the textbook spreads. Furthermore, visualisations provide a first impression of the intensity with which certain areas of the textbook spread were observed and which textbook elements were not, or were only superficially, observed. (see Figure 5 and Figure 8).
A fixation duration of about 330 milliseconds is assumed for conscious visual perception and conscious cognitive processing of visual impressions (Geise 2011; Joos et al. 2003). Therefore, Table 1 depicts the number of counted fixations from 300 milliseconds on spreads A–E added over all 20 participants for each page element (photos, graphics, and text) and reveals how frequently the participants fixated on certain points on the page while solving the task.
TABLE 1
Fixation count, stage 2: number of fixations
A B C D E Text 479 567 366 573 593 Headline 4 19 8 0 8 Captions 26 42 17 8 23 Task 213 351 106 184 175 Additional textboxes 48 – – 0 14 Photo 1 1 1 1 3 1 Photo 2 0 25* – – 2 Photo 3 4 7 – – 4 Photo 4 2 1 – – – Photo 5 10 – – – – Photo 6 6 – – – – Graphic 1 398 64* 19 34 182* Graphic 2 – 67* 111* 94* 18 Graphic 3 – 15 12 – 1
*= This graphic/photo was mentioned in the task.
– = No further resources (photos/graphics, links) were depicted.
Table 1 reveals participants’ visual focus on the text elements of spreads A–E because most fixations were counted on text elements (text, task) for each of the five textbook spreads.
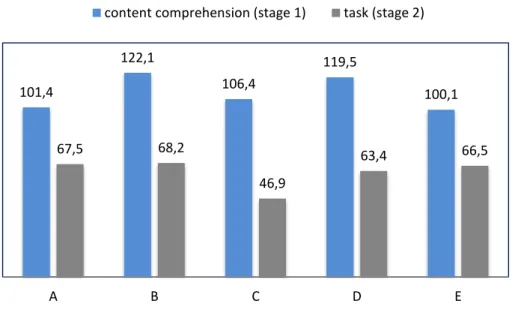
Figure 2 represents the mean dwell duration (in seconds) of all 20 participants on spreads A–E in both stage 1 (content comprehension) and stage 2 (task). Fixations from 100 milliseconds were counted.
FIGURE 2
Mean dwell duration in seconds averaged over all 20 participants
101,4 122,1 106,4 119,5 100,1 67,5 68,2 46,9 63,4 66,5 A B C D E
Comparing the values of Figure 2 (mean dwell duration in stage 2) with the values of Table 2 (mean dwell duration in AOI in stage 2) reveals the fixation time participants spent on relevant elements for solving the task in relation to the mean dwell duration on the whole textbook spread.
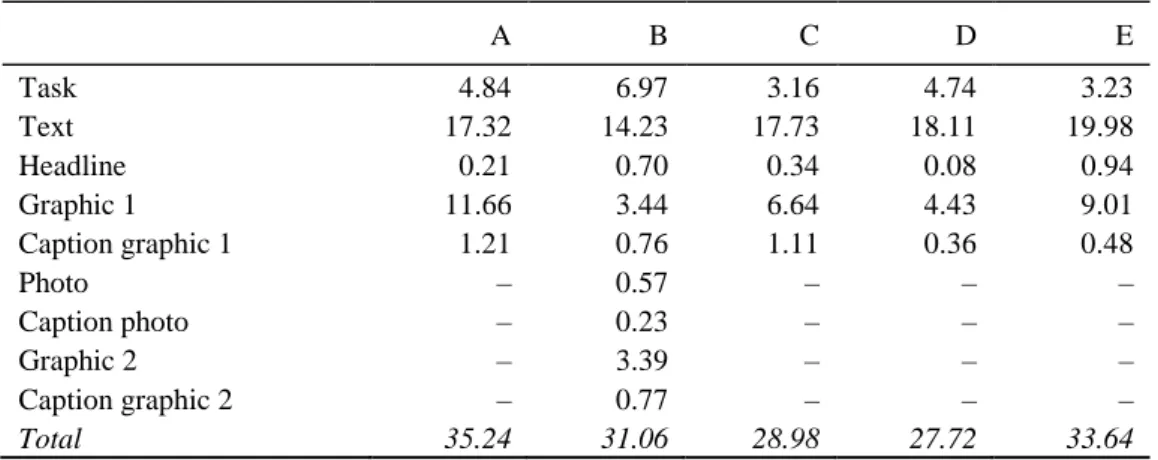
Table 2 depicts the mean dwell duration of all participants on the AOIs. All materials from textbook spreads A–E that included information to solve the set task and textbook materials to which the set tasks referred were marked as an AOI. Fixations from 100 milliseconds were recorded.
TABLE 2
Mean dwell duration of all 20 participants on AOIs while solving the task (in seconds)
A B C D E Task 4.84 6.97 3.16 4.74 3.23 Text 17.32 14.23 17.73 18.11 19.98 Headline 0.21 0.70 0.34 0.08 0.94 Graphic 1 11.66 3.44 6.64 4.43 9.01 Caption graphic 1 1.21 0.76 1.11 0.36 0.48 Photo – 0.57 – – – Caption photo – 0.23 – – – Graphic 2 – 3.39 – – – Caption graphic 2 – 0.77 – – – Total 35.24 31.06 28.98 27.72 33.64
– = No further resources (photos/graphics, links) were depicted.
Table 2 demonstrates that longest fixation time was counted in the text sections of spread A–E while solving the set task. Therefore, Table 2 also reveals participants’ marked focus on the text elements of the tested textbook spreads while solving the set tasks.
Figure 3 demonstrates the order in which participants observed the textbook elements containing relevant information for completing the task (AOIs) in stage 2. Therefore, fixations from 100 milliseconds were counted. The diagram depicts on which elements participants fixated from the first to the fifth fixation, added over all 20 participants as well as over spreads A–E. Fixations, which, amongst others, might indicate searching processes, might also be included in the measurement.
FIGURE 3
Order of observed AOIs in spreads A–E while completing the task
The diagram demonstrates that a majority of participants first fixated on the task (as expected), followed by fixating on the text, and then on the graphics. However, Figure 3 only provides data about the order of fixated textbook elements, but not about the fixation duration. Furthermore, Figure 3 depicts solely the first five fixations, which are typically followed by a number of further fixations.
Written Evaluation
By means of a questionnaire, participants assessed the visual quality of the examined textbook spreads A–E (see Table 4). The questionnaire aimed to analyse possible preferences with regard to the design of the analysed textbook spreads. Therefore, participants allocated ranks ranging from one (best) to five (worst) for each of the five textbook spreads in five categories: design, comprehensibility, graphics, text, and orientation. Thus, the lowest number of points represents the best rating. Consequently, the best overall value per category is 100 points = mark 1.0 (20 participants; five categories, each ranked with one).
TABLE 3
Evaluation questionnaire
Design Graphics Text Comprehensibility Orientation Total
A 72 73 63 69 72 349
B 62 63 59 66 66 316
C 60 47 48 47 49 251
D 68 77 76 67 65 353
E 38 40 54 51 48 231
As indicated by the questionnaire evaluation (Table 3), spread E obtained the best overall score of 231 (mark 2.31), spread D (353 points, mark 3.53) achieved the worst score, and spread A (349 points, mark 3.49) received the second worst score. A
0 10 20 30 40
1. fixation 2. fixation 3. fixation 4. fixation 5. fixation
N u m b e r o f fi xati o n s
Order of fixated textbook elements
Task Text Headline Graphics Captions Photo
preference for the textbook design of spread E might be apparent from the distance to rank 2 (spread C, 251 points, mark 2.51), as well as from the rating for the categories design (39 points, first rank) and graphic (first rank, 40 points). However, none of the analysed textbook spreads A–E obtained a very good rating (1.0–1.5).
The written task was evaluated according to a points system. According to this system, the maximum possible value was four per task. Therefore, the maximum possible value per test spread was 80 (20 participants; maximum four points). Figure 4 depicts the sum of all points reached by the participants per test spread.
FIGURE 4
Written task evaluation
A comparison of the written task evaluation (Figure 4) and the evaluation of the questionnaire revealed similarities between the participants’ ranking of textbook design (Table 4) and the written task evaluation (Figure 4). For example, it is apparent that spread E in the written task evaluation also obtained the best results (60 points) by a clear margin of 12 points to rank 2 (spread C, 48 points). Furthermore, spread D (41 points) and spread A (42 points) obtained equally low scores in the written task evaluation and the questionnaire evaluation. However, a notable exception is the poor written task outcome of spread B, which obtained 35 points, the worst result in the written task evaluation.
In the following, the collected data from spread E (best result; Figure 5) and spread B (worst result; Figure 8) will be analysed and compared with each other.
Discussion
The data analysis will focus on possible relationships between participants’ preferred textbook design and attention to visuals. The gaze plot (participant 21;
42 35 48 41 60 0 10 20 30 40 50 60 70 80 A B C D E Point s
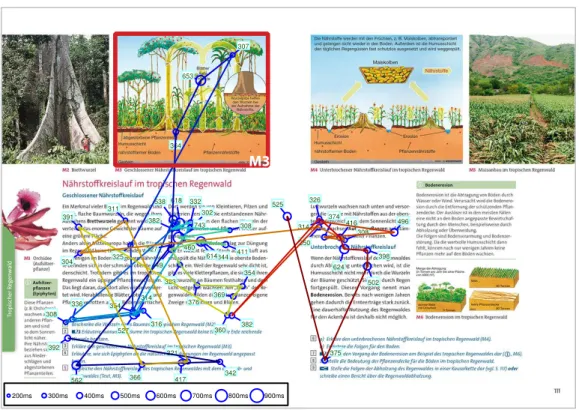
Figure 5) illustrates an exemplary visual pattern of how the participants observed spread E during completing the task. On average, the participants paid the most attention to the task and certain areas on the text section and some attention to graphic M3. Highlighted with a red line, Figure 5 depicts the to task three related graphic M3).
FIGURE 5
Gaze plot for spread E while completing the task (Participant 21)
As demonstrated in Figure 5, the set task for spread E contains one link to an infographic (M3, closed nutrient cycle). Infographic M3 is, relative to its size (100 × 85 mm), highly detailed, but the included text is limited to keywords and the graphic content is limited to one topic (closed nutrient cycle). However, one crucial element of infographic M3 (i.e., arrows that depict the function of the nutrient cycle) is transparent and superimposed over the highly detailed graphic and therefore is difficult to identify. With regard to this, studies from image-text research indicate that information processing from graphic visualisations could be fostered if the salient elements of graphics provide relevant information (Boucheix et al. 2013; Lowe & Boucheix 2010). Furthermore, the textbook analysis revealed several content duplications. For example, the caption of M3 is nearly identical to the sub-headline on page 111. Moreover, information contained in graphic M3 is also provided in the text. Regarding this issue, Mayer (2009) states in his CTML that presenting duplicated
information does not automatically result in a higher learning effect. In contrary, it might cause the redundancy effect.
The analysis of the numerical data revealed amean dwell duration of 66.5 seconds on spread E while completing the task (see Figure 2). In this, the participants dwelled an average of 33.64 seconds (Table 2) on AOIs, which is 50.59% of the total trial duration. Of these 33.64 seconds of dwell duration, the participants spent 19.98 seconds on the text section and 9.01 seconds on graphic M3 (Table 2). As shown in the pie chart below (Figure 6), amongst all depicted visuals in spread E, graphic M3 obtained the most visual attention. This may indicate that visual and textual linking between tasks and task-related textbook elements might yield higher attention to related visuals. However, most fixations, as well as the longest dwell duration, were measured on the text elements of spread E.
FIGURE 6
Spread E: Distribution of fixations (in percent) while completing the task
Text section 58.08% Headline 0.78% Captions 2.25% Tasks 17.14% Additional Textboxes 1.37% Photo M1 0.10% Photo M2 0.20% Photo M5 0.39% Graphic M3 17.83% Graphic M4 1.76% Graphic M6 0.10% Total Text Total Graphicis 19.69% Total Photos 0.69%
FIGURE 7
Spread E: Order of observed AOIs while solving the task; all 20 participants added
Figure 7 depicts the order of observed AOIs while completing the task. The diagram demonstrates that a majority of participants first fixated on the task (as expected). This was followed by an identical number of participants fixating on the task and on the graphic. However, Figure 7 depicts solely the first five fixations, which are typically followed by a number of further fixations. Therefore, the high number of fixations on the headline in Figure 7 may contradict the percentage distribution of fixations (Figure 6), but it might be an indicator of short attention spans with respect to the headline. Notwithstanding the participants’ good rating for the graphics in spread E (first rank, 40 points, Table 3) and the best result in the written task evaluation (Figure 4), the participants’ main focus of attention (number of fixations, Table 1; fixation duration, Table 4; gaze plot for spread E, Figure 5) was measured on the text elements of spread E.
0 2 4 6 8 10 12 14
1. fixation 2. fixation 3. fixation 4. fixation 5. fixation
N u m b r o f fi xati o n s al to ge h te r
Order of fixated textbook elements
Text Task Graphic Caption Headline
FIGURE 8
Gaze plot for spread B while completing the task (Participant 9)
The gaze plot (Participant 9; Figure 8) depicts an exemplary visual pattern of the participants’ eye movements and observed textbook areas on spread B while completing the task. Additionally, Figure 8 illustrates the task-related materials, highlighted with a red line. As demonstrated in Figure 8, the set task for spread B (task 3) refers to three visuals and to the text section (graphic 68.2, graphic 69.1, photo 68.2). This also contrasts to the task in spread E, which solely refers to one graphic (M3), and to the tasks in spreads A, C and D, which also refer to one visual.
Graphic 68.2 represents an infographic consisting of two graphics (the nutrient cycle in tropical rainforests before deforestation and tropical rainforests after deforestation [Figure 8]). This representation form is known as a paired graphic (Boucheix et al. 2013). The purpose of paired graphics is to compare the graphics to each other to identify similarities and differences. The left-hand side of infographic 68.2 depicts the closed nutrient cycle in tropical rainforests, and the right-hand side demonstrates the disturbed nutrient cycle. Thus, graphic 68.2 also represents an infographic describing a processing function (the nutrient cycle in tropical rainforests). In addition, the caption of 68.2 also implies that the graphic depicts two different aspects: “the short-circuit nutrition cycle in tropical rainforests and the consequences of rainforest deforestation”. Therefore, the learner has to determine the interrelationship between the two aspects. Consequently, to solve task 3 utilising graphic 68.2, the learner must first analyse and decode both graphics to understand the processing function of the “nutrient cycle”, identify similarities and differences
between the graphics, analyse the interrelationship between the nutrient cycle and rainforest deforestation, and align the result with the task to determine which information is relevant for solving the task (Bétrancourt et al. 2012). However, several studies from image-text research have revealed that information processing from graphic visualisations is a highly complex process that represents a cognitive challenge to students (Boucheix et al. 2013; Vries & Lowe 2010). Consequently, depicting too many different aspects of one topic in one graphic may hinder information processing.
We turn now to the second graphic with reference to task 3: infographic 69.1. This graphic depicts “changes effected by the exploitation of the tropical rainforest” (caption). The most salient elements are two white arrows on the top edge of the graphic, marked with the capital letters A and B and the keywords “high” and “low”. Although task 3 refers to graphic 69.1, the meaning of the white arrows remains uncertain because they refer only to task 1 in the exercise section. Therefore, to utilise graphic 69.1 in task 3, task 1 must first be completed. However, task 3 contains no reference to task 1. Because the tasks in the textbook will not always be completed by each learner one after the other, the reference to graphic 69.1 and the graphic content might induce challenges in information processing, particularly as the salient graphic elements (arrows) do not correspond to relevant information for completing task 3 (Boucheix et al. 2013; de Koning et al. 2010). Furthermore, graphic 68.2 includes all relevant information for completing task 3. Therefore, the reference to graphic 69.1 in task 3 is redundant and might lead to the redundancy effect (Mayer 2009).
Photo 68.3. (soil surface in secondary forest) represents the third reference in task 3. The depicted photo is poorly contrasted and predominantly in brown tones. Moreover, the picture does not provide a reference to enable the observer to specify the size ratio of the image content. Because of the described external characteristics, photo 68.3 is neither a salient element in textbook spread D, nor does it represent an attractive image motif. Furthermore, task 3 lacks instructions regarding which aspects of photo 68.3 should be analysed to complete the task. This could be a crucial factor, as photos represent holistic information and might be interpreted in many different ways. Therefore, it is necessary to provide clear instructions on how to analyse the photo to identify the information relevant for completing a task (Pettersson 2015).
The analysis of eye tracking data revealed a mean dwell duration of 68.2 seconds on spread B while completing the task (Figure 2). Here, the participants dwelled an average of 31.06 seconds on the AOIs (Table 2), which is 46.22% of the total trial duration. This result is surprising, as 68.2 seconds is the longest measured total dwell duration amongst spreads A–E, but the dwell duration on the AOIs of spread B is lower compared to that of spread E (50.59%), although the task refers to three different visuals. Consequently, the data evaluation of the AOIs (Table 2) demonstrates that increasing the number of referred materials is not automatically accompanied by increased dwell duration on AOIs (cf. Figure 9 and Figure 6). Rather, the dwell duration on the referred visuals in spread B was shorter compared to that of spread E (spread B: total of graphic 68.2 + graphic 69.1 + photo 68.3 = 7.4 s, in contrast to graphic M3 in spread E = 9.01s). This might lead to the conclusion that the
task-referred visuals were more superficially observed in spread B than in spread E. Furthermore, a significantly longer dwell duration in the task of spread B was measured compared to spreads A, C, D and E (Table 2). One possible explanation for the participants’ lack of visual attention to the three task-referred visuals might be
cognitive overload (Chandler & Sweller 1991; Plass et al. 2010). Cognitive overload
occurs when the learning material is too complex (e.g., too many different resources) or the learners’ previous knowledge is too limited. In such a case, many learners do not utilise all the depicted materials; rather, they select the representations perceived to be most promising and/or easiest to process (Oestermeier & Eitel 2014). As shown in the pie chart below (Figure 9), most fixations were measured on text elements in spread B.
FIGURE 9
Spread B: Distribution of fixations (in %) while completing the task
Text section 48,92% Headline 1.64% Caption 3.62% Task 30.28% Photo 68.1, 0.09% Photo 68.3 2.16% Photo 69.3A 0.60% Photo 69.3B 0,09% Graphic 68.2 5.52% Graphic 69.1 5,78% Graphic 69.2 1.29% Total Text 84.47% Total Graphics 12.60% Total Photos 2.93%
FIGURE 10
Spread B: Order of observed AOIs while solving the task
Figure 10 depicts the order of observed AOIs. As in spread E, in spread B, the participants primarily fixated on the task. However, Figure 10 demonstrates that the largest number of fixations, from the second to the fifth fixation, were measured on text, and considerable visual attention was paid to the task, in contrast to spread E. Very little visual attention was paid to task-referred photo 68.3 and only limited visual attention was paid to graphics 68.2 and 69.1 during the first five fixations. The participants’ poor ratings for spread B with regard to comprehensibility (66 points, second least) and quickly finding information for solving the task (66 points, second least) (questionnaire, Table 3) might indicate that the participants perceived some difficulties while completing the task. Further, the design of graphics 68.2 and 69.1 and the picture motif of 68.3 might have influenced the participants’ visual attention. Additionally, the poor task outcome of spread B (35 points = 43%; Figure 4) could be induced by the high number of referred materials in task 3, and the limited visual attention that participants paid to referred visuals 68.2, 68.3 and 69.1 (Table 1, Figure 9). Consequently, it could be assumed that the more different resources are interlinked in one task, the poorer the task outcome is likely to be. However, because knowledge acquisition through visuals and text is a complex process that might be influenced by various factors, the number of depicted materials is only one possible factor amongst others that might influence students’ visual attention to specific textbook content.
Conclusions
Findings from the current study may verify textbook design as one crucial factor (amongst others) for successful knowledge acquisition from textbooks because how coherently a textbook layout is organised and how clearly the content of depicted visuals is designed might influence the degree of visual attention paid to textbook
0 2 4 6 8 10 12 14 16 18 20
1. fixation 2. fixation 3. fixation 4. fixation 5. fixation
N u m b e r o f fi xati o n s/ 20 p ar tici p an ts
Order of fixated textbook elements
Text Task Graphic1 Caption1 Headline Graphic 2 Caption2 Photo Caption Photo
elements. This would be in accord with Morgan (2014) who emphasized the crucial role of well-designed textbooks for students’ learning process, and with LaSpina (1998) who argued that good textbook design requires the expert guidance of well-articulated layouts in which clarity and complexity are not mutually exclusive.
Furthermore, the data evaluation revealed that participants’ ratings for design and comprehensibility of the tested textbook spreads A–E (Table 4) corresponded in many aspects with the results of the textbook analysis from a visual communication perspective and with findings from educational psychology. Moreover, participants rated those textbook spreads best which also obtained the best results in the written task evaluation. Consequently, it might be concluded that participants were able to assess the visual quality of the examined textbook spreads A–E in relation to their effectiveness and efficacy of their individual learning process.
This might be of significance, as studies suggest that subjective norms and subjective perceived self-efficacy, ease of use and usefulness are important factors for the acceptance and efficacy of educational media (Joo et al. 2014). This would be supported by the emotional design hypothesis (Mayer 2014) and by Moreno’s Cognitive Affective Theory of Learning with Media (CATLM), which assume that emotions, motivation and behaviour are, in addition to cognitive variables, crucial factors in learning with educational media (Park et al. 2014).
Moreover, studies suggest that motivational features can improve student learning by fostering generative processing as long as the learner is not continually overloaded with extraneous processing or overly distracted from essential processing (Mayer 2014). However, though attention is one important prerequisite for comprehension processes, studies addressing the attention-comprehension gap have stated that attention paid to a depicted visual (graphic or photograph) does not automatically mean content comprehension (St. Amant & Meloncon 2015). Therefore, learning-effective textbook design should consider findings from pedagogical psychology, multimedia learning and information design. This would also support studies from educational psychology that emphasise the importance of the purposeful design of learning materials in relation to content and learner; a purposeful design of learning materials may support learners in understanding the meaning of the provided information (Holmqvist Olander, Brante, & Nyström 2014).
Therefore, several factors should be considered, such as the clarity and coherence with which information in graphic visualisations is presented. A textbook layout that guides the learner through the depicted resources and enables the student to easily identify relevant information includes visual and textual linking between related materials, and the instructional, didactical, technical and aesthetic quality of depicted visuals (Pettersson 2015), to name only a few.
Furthermore, this eye-tracking investigation revealed a disparity between the number of visuals depicted in the analysed geography textbooks and participants’ visual attention to depicted graphics and photos on the tested geography textbook spreads A–E. Interestingly, graphics were often looked at rather superficially; exceedingly little attention was paid to the depicted photos, and a marked focus on text elements was observed. Within this context, Pintó and Amettler (2002 p. 341)
stated, “Science teachers should be aware that an image is worth more than thousand words only if the reader knows the codes to interpret and to design images”. Thus, it can be assumed that notwithstanding the omnipresence of visuals in everyday life, students face challenges while learning with images. Consequently, competencies in decoding visuals (i.e., visual literacy) should be mediated more intensely and practised regularly. This might be essential for geography education, as geography is inter alia defined as a visual discipline because “geography is unique in how it relies on certain kinds of visualities and visual images to construct its knowledges” (Rose 2003, p.212).
Therefore, to construct knowledge from visuals in geography textbooks, visual attention to depicted materials is a crucial factor in the learning process. Particularly, studies from pedagogical psychology reveal that knowledge acquisition through visuals and text in combination is more successful (multimedia effect) than through text or images in isolation (Mayer 2009, Eitel et al. 2013). However, knowledge acquisition from textbooks is a complex process that may be affected by various factors, such as previous knowledge, students’ interests, students’ learning strategies, media specific skills and design that promotes learning (Ainsworth 2006; Schnotz et al. 2011). Therefore, further research is required.
It is important to mention as a concluding remark to classify the experimental results that the study aimed at analysing students’ visual attention to depicted materials in textbooks; not in measuring learning outcome. Additionally, a number of possible limitations in the present study should be taken into account. First, only one type of graphic (infographic) was primarily evaluated. Therefore, for final conclusions and recommendations, a broader research sample is needed with a wider range of graphics (e.g., maps, diagrams, statistics). Further limitations might be found in the small sample size (n = 20), the heterogeneous sample composition, the heterogeneous stimuli, the lack of a prior knowledge test, and the design of the questionnaire (only five questions). Furthermore, the research design (five textbook spreads on the same topic) might affect participants’ attention to the depicted graphics. For these reasons, and based on the findings of this exploratory study utilising random sampling, a supplementary eye tracking study with a larger sample and improved research design is currently in preparation.
References
Ainsworth, S. (2006). DeFT: A conceptual framework for considering learning with multiple representations. Learning and Instruction, 16, pp.183–198.
St. Amant, K. & Meloncon, L. (2015). The Attention-Comprehension Gap: A framework for rethinking information design. Intercom, (Feburary), pp.14–17. Bardy Bölsterli, K. (2014). Kompetenzorientierung in Schulbüchern für die
Naturwissenschaften aufgezeigt am Beispiel der Schweiz. Pädagogische Hochschule
Bétrancourt, M. et al. (2012). Graphicacy: Do Readers of Science Textbooks need it? In E. de Vries & K. Scheiter, eds. EARLI SIG 2 Meeting 2012, Grenoble, August
28-31. Grenoble: EARLI, pp. 37–39.
Boucheix, J.-M. et al. (2013). Learning Novel concepts in E-Media: The power of comparison. The example of Paired graphics. In Proceedings of ICT for Language
Learning, Florence, November 14–15 2012.
Chandler, P. & Sweller, J. (1991). Cognitive Load Theory and the Format of Instruction. Cognition and Instruction, 8(4), pp.293–332.
Duchowski, A. (2007). Eye Tracking Methodology. Theory and Practice 2. Edition., London: Springer.
Eitel, A. et al. (2013). How a picture facilitates the process of learning from text: Evidence for scaffolding. Learning and Instruction, 28, pp.48–63.
doi:1016/j.learninstruc.2013.05.002.
Fuchs, E., Niehaus, I. & Stoletzki, A. (2014). Das Schulbuch in der Forschung.
Analysen und Empfehlungen für die Bildungspraxis., Göttingen: V&R unipress.
Geise, S. (2011). Extended Paper. Eyetracking in der Kommunikations- und Medienwissenschaft: Theorie, Methode und kritische Reflexion. Eyetracking in Communication and Media Studies: Theory, Method and Critical Reflection. Studies
in Communication| Media, 2, pp.149–263.
Van Gog, T. & Scheiter, K. (2010). Eye tracking as a tool to study and enhance multimedia learning. Learning and Instruction, 20(2), pp.95–99.
De Groot, F., Huettig, F. & Olivers, C.N.L. (2015). When Meaning Matters: The Temporal Dynamics of Semantic Influences on Visual Attention. Journal of
Experimental Psychology: Human Perception and Performance, (August 31).
doi:10.1037/xhp0000102.
Hochpöchler, U. et al. (2012). Dynamics of mental model construction from text and graphics. European Journal of Psychology of Education, 28(4), pp.1105–1126. Holmqvist, K. et al. (2010). Eye Tracking: A comprehensive guide to methods and
measures, Oxford: Oxford University Press.
Holmqvist Olander, M., Brante, E.W. & Nyström, M. (2014). The Image of Images as an Aid to Improve Learning. An Eye-Tracking Experiment Studying the Effect of Contrasts in Computer-based Learning material. In CSEDU 2014 – 6th International
Conference on Computer Supported Education using. pp. 309–316.
Holsanova, J. (2014). Reception of multimodality: Applying eye-tracking
methodology in multimodal research. In Carey Jewitt, ed. Routhledge Handbook of
Multimodal Analysis. London: Routledge, pp. 285–296.
Hyönä, J. (2010). The use of eye movements in the study of multimedia learning.
Janko, T. & Knecht, P. (2014). Visuals in Geography Textbooks – Increasing the Reliability of a Research Instrument. In P. Knecht et al., eds. Methodologie und
Methoden der Schulbuch- und Lehrmittelforschung. Bad Heilbrunn: Klinkhardt, pp.
227–239.
Janko, T. & Peskova, K. (2013). Analysing the Types of Visuals in Textbooks of Geography and German Language: Considering the Instructional Functioning of Photographs. Anthropologist, 16(1–2), pp.363–372.
Joo, Y.J. et al. (2014). Structural Relationships between variables of elementary school students’ intention of accepting digital textbooks. In M. B. Nunes & M. McPherson, eds. Proceedings of the International Conference on e-Learning 2014,
July 15–19, Lisbon. IADIS Press, pp. 95–102.
Joos, M., Rötting, M. & Velichovsky, B.M. (2003). Bewegungen des menschlichen Auges: Fakten, Methoden und innovative Anwendungen. In G. Rickheit, T.
Herrmann, & W. Deutsch, eds. Psycholinguistik. Ein internationales Handbuch. Berlin: DeGryter, pp. 142–168.
Just, M.A. & Carpenter, P.A. (1980). A theory of reading: From eye fixations to comprehension. Psychological Review, 87(4), pp.329–354.
De Koning, B.B. et al. (2010). Attention guidance in learning from a complex animation: Seeing is understanding? Learning and Instruction, 20(2), pp.111–122. De Koning, B.B. et al. (2009). Towards a Framework for Attention Cueing in Instructional Animations: Guidelines for Research and Design. Educational
Psychology Review, 21(2), pp.113–140.
LaSpina, J.A. (1998). The visual turn and the transformation of the textbook, Mahwah, New Jersey; London: Lawrence Erlbaum Associates.
Leutner, D. (2014). Motivation and emotion as mediators in multimedia learning.
Learning and Instruction, 29, pp.174–175. doi:10.1016/j.learninstruc.2013.05.004.
Lowe, R.K. & Boucheix, J.-M. (2010). Attention Direction in Static and Animated Diagrams. Lecture Notes in Computer Science (including subseries Lecture Notes in
Artificial Intelligence and Lecture Notes in Bioinformatics), 6170 (September),
pp.304–306.
Lowrie, T., Diezmann, C.M. & Logan, T. (2011). Understanding graphicacy: Students’ making sense of graphics in mathematics assesment tasks. International
Journal for Mathematicas Teaching and Learning.
Mason, L., Pluchino, P. & Tornatora, M.C. (2015). Eye-movement modeling of integrative reading of an illustrated text: Effects on processing and learning.
Contemporary Educational Psychology, 41, pp.172–187.
doi:10.1016/j.cedpsych.2015.01.004.
Mayer, R.E. (2005). Cognitive Theory of Multimedia Learning. In The Cambridge
Handbook of Multimedia Learning. Cambridge: Cambridge University Press, pp. 31–
Mayer, R.E. (2014). Incorporating motivation into multimedia learning. Learning and
Instruction, 29, pp.171–173. doi:10.1016/j.learninstruc.2013.04.003.
Mayer, R.E. (2009). Multimedia Learning, Cambridge: Cambridge University Press. Mayer, R.E. & Estrella, G. (2014). Benefits of emotional design in multimedia instruction. Learning and Instruction, 33, pp.12–18.
Moreno, R. (2006). Does the modality principle hold for different media? A test of the method-affects-learning hypothesis. Journal of Computer Assisted Learning, 22(3), pp.149–158.
Morgan, K.E. (2014). Decoding the Visual Grammar of Selected South African History Textbooks. Journal of Educational Media, Memory, and Society, 6(1), pp.59– 78.
Oestermeier, U. & Eitel, A., (2014). Lernen mit Text und Bild. Retrieved November 10, 2015 from http://www.e-teaching.org/didaktik/
Park, B., Plass, J.L. & Brünken, R. (2014). Cognitive and affective processes in multimedia learning. Learning and Instruction, 29, pp.125–127.
doi:10.1016/j.learninstruc.2013.05.005.
Peeck, J. (1993). Increasing picture effects in learning from illustrated text. Learning
and Instruction, 3(3), pp.227–238.
Pettersson, R. (2015). Information Design 3. Image Design, Wien: International Institute for Information Design.
Pettersson, R. (1999). Attention – an Information Design Perspective. In Vision Plus
6. Drawing the Process: Visual Planning and Explaining International Institute for Information Design (IIID), Vienna, Austria, July 8-10,. pp. 1–18.
Pettersson, R. (1995). The Learning Helix. In The 27th Annual Conference of the
International Visual Literacy Association, Chicago, October 18-22, 1995. pp. 1–13.
Pintó, R. & Amettler, J. (2002). Students’ difficulties in reading images. Comparing results from four national research groups. International Journal of Science
Education, 24(3), pp.333–341.
Plass, J.L. et al. (2010). Cognitive Load Theory J. L. Plass et al., eds., New York: Cambridge University Press.
Rakoczi, G. (2012). Eye Tracking in Forschung und Lehre. Möglichkeiten und Grenzen eines vielversprechenden Erkenntnismittels. In G. Csanyi, F. Reichl, & A. Steiner, eds. Digitale Medien – Werkzeuge für exzellente Forschung und Lehre. Münster: Waxmann 2012, pp. 87 – 98.
Rose, G. (2003). On the Need to Ask How, Exactly, Is Geography ‘Visual’. Antipode, (3), pp.212 – 221.
Schnotz, W. et al. (2014). Strategy Shifts During Learning from Texts and Pictures.
Journal of Educational Psychology, April.
Schnotz, W. et al. (2011). What Makes Text-Picture-Integration Difficult? A Structural and Procedural Analysis of Textbook Requirements. In RICERCHE DI
PSICOLOGIA. pp. 103–135.
Thornes, J.E. (2004) The Visual Turn and Geography (Response to Rose 2003 Intervention). Antipode, 36(5), pp.787–794. doi:10.1111/j.1467-8330.2004.00452.x. Um, E. ‘Rachel’ et al. (2012). Emotional design in multimedia learning. Journal of
Educational Psychology, 104(2), pp.485–498.
Voßkühler, A. (2010). Blickbewegungsmessung an Versuchsaufbauten, Berlin: Logos. De Vries, E. & Lowe, R.K. (2010). Graphicacy: What Does the Learner Bring to a Graphic? In Proceedings of the EARLI SIG Meeting 2010, Tübingen, August 26–28. Tübingen.
Picture credits
Figure 1
Spread A: Krause, K., Werner, S. 2013. Terra Geographie 9/10 Berlin und
Brandenburg. Stuttgart: Klett. 50-51.
Spread B: Felsch, M., Heß, H., Marth, U. 2012. Seydlitz 9/10 Geographie Berlin. Braunschweig. Schroedel: 68-69.
Spread C: Heit, E., Ernst M. (ed.). 2012. Diercke Erdkunde Saarland Gymnasium 7.
Schuljahr. Braunschweig: Westermann 26-27.
Spread D: Flath M., Rudyk, E. (ed.) 2012. Unsere Erde Hessen 1. Berlin: Cornelsen 176-177.
Spread E: Bahr, M. et al. (2013). Durchblick. Erdkunde 7/8. Niedersachsen.
Differenzierende Ausgabe. Braunschweig: Westermann, 110-111.
Figures 2 , 3, 4, 6, 7, 9, 10 Own figures and calculation Figure 5
Own figures and calculation
Background image: Bahr, M. et al. (2013). Durchblick. Erdkunde 7/8. Niedersachsen.
Differenzierende Ausgabe. Braunschweig: Westermann, 110-111.
Figure 8
Background image: Felsch, M., Heß, H., Marth, U. 2012. Seydlitz 9/10 Geographie
Berlin. Braunschweig. Schroedel: 68-69.
Table 1–5