Setting the seeds for a green growth
-A Study of biofuel development in Indonesia’s transport
sector
Sophia Aaman
Henrik Hessel Lundberg
Master of Science Thesis
KTH School of Industrial Engineering and Management Energy Technology EGI-2017-0069-MSC
SE-100 44 STOCKHOLM Master of Science Thesis EGI 2017:0069
Setting the seeds for a green growth
-A Study of biofuel development in Indonesia’s transport sector
Sophia Aaman Henrik Hessel Lundberg Approved
Date
Examiner Semida Silveira
Supervisor
Fumi Harahap, Dilip Khatiwada Commissioner Contact person
Acknowledgement
The authors would like to thank family and friends for being supportive and helpful throughout all of the five years of education at The Royal Institute of Technology. You have kept our spirits high and we couldn’t have done it without you, so thank you! We would also like to give a special thanks to the interviewees, their time and knowledge made this thesis possible. We are forever grateful for the warm welcome you all showed us. Finally, we would like to thank Fumi Harahap and Dilip Khatiwada for all your support and guidance in this project. Your helpfulness has made this project what it is! A special thanks is also directed to Semida Silveira for being our examiner.
Abstract
Climate change poses as one of the major environmental issues on a global scale today, with one of the largest contributor to the climate change being the greenhouse gas (GHG) emissions. GHG emissions in turn is known to a large extent originate in anthropogenic energy use, especially fossil fuel usage. This leads to almost a quarter of the global emissions today being emitted from the transport sector as the sector is primary fueled by fossil fuels.
Biofuels have been promoted as a strong candidate for fossil fuel substitution as it has similar properties while being renewable. However, even as biofuels have been increasing annually since 2008 globally, there are still concerns associated with the usages that have hindered its replacement of fossil fuels.
Indonesia, one of the most populated countries in Southeast Asia, is projected to be one of the world’s leading economies in 2050. In 2030, Indonesia in projected to have doubled its energy consumption since 2014, indicating that the decisions and actions taken today in Indonesia will have a significant impact on the future fuel consumption. This, in combination with being the largest producer of palm oil in the world, gives it a great potential to be in a leading position in the future production of biofuels, especially biodiesel from palm oil. Additionally, Indonesia has set mandatory targets for biofuel share in the transport sector which indicates that the country also seeks to promote the usages of biofuels.
This thesis intends to investigate Indonesia’s potential for biofuel development in the transport sector and which factors that could hinder it. More specifically, this study answers the two questions: (i) Which factors
are hampering the development of biofuels in the Indonesian transportation sector from a multi-level perspective? and (ii) What is the projection of the Indonesian transport sector by 2030 in terms of fuel consumption and global warming potential (GWP) and what role could biofuels play in reducing those?
The data used were collected by interviews with stakeholders in Indonesia and a literature study, which afterwards was processed with the tools Multi-Level Perspective (MLP) and Long-range Energy Alternatives Planning (LEAP). MLP is a concept aiming to describe how system transitions happens with the help of an examination of the linkages in between technology and society, whereas LEAP is an energy modeling tool used in order to create energy projections in different policy scenario options. In this research, MLP were used to capture and analyze the factors that influence the future implementation of biofuels in Indonesia from a socio-technical perspective, putting forward key barriers for biofuel implementation in Indonesia. LEAP was used to construct a model of the Indonesian transport sector to project the future fuel consumption and GWP emissions. This was used to examine biofuels importance as a fuel through scenarios where different Indonesian policy actions were appraised. Together, these two methods will provide an enlightening and concluding remark on the future possibilities for biofuels in Indonesia's transport sector in this thesis.
The major finding of the first research question were that biofuels in Indonesia were being introduced in Indonesia as the government saw economic benefits and a solution to the increased energy demand in Indonesia and an increased energy security in going towards a domestic produced energy source. The need for biofuels were also increased due to an increased global sustainability awareness, which also reached Indonesia.
Today, biofuels in Indonesia is in a socio-technical transition pathway to go from a niche innovation to a technology in the regime level, but in order for a breakthrough, a number of barriers needs to be addressed. The most mentioned barriers were the institutional and regulatory barriers, which mainly lays in a lack of cooperation amongst the regulatory institutions and a low rate of success of biofuel laws and regulations. Other barriers were the market barriers, closely connected in a subsidization of fossil fuels in Indonesia and a need for further subsidization of biofuels for the market for biofuels to exist in Indonesia. Furthermore, a technical barrier with the vehicle engine were seen as the engine needs improvements in order for a higher blending of biofuels in the fuel. There was also a concern of the perceived sustainability of biofuels in general (e.g. water scarcity and pollution) which was identified as a hindrance. It was also clear a social
change is needed in order to push the biofuel breakthrough and enable it to reach its full potential. Today, the interviewees mainly see a development for the biofuel biodiesel and not for the biofuel bioethanol in Indonesia, which they mainly concluded as there is currently none or very little production and demand for bioethanol in Indonesia, and as well a lack of governmental support for bioethanol development.
For the second research question four scenarios were used; Business as Usual (a continuation of current trends), Improved Standards (an investigation of higher emissions standards and an increasing fuel efficiency), Biofuel Mandate (a mandatory biofuel share in fuels) and the Low Carbon scenario (a combination of the previous two as well as introduction of electric vehicles, changed car preferences and higher biofuel blending targets). Cars represents a tenth of the vehicle fleet and the share of diesel car amongst the cars are 5% while gasoline stands for 95%, the rest of the vehicles are gasoline driven motorcycles. The main findings were: the total vehicle fleet will have doubled by 2030. This rapid increase could cause stress on the domestic fuel supply, as the yearly fuel consumption is expected to grow from 770 million GJ in 2014 to 1850 million GJ in 2030, an increase by 140%. In the projection the fossil fuels are blended with biofuels, diesel is mixed with biodiesel while gasoline is blended with bioethanol. The annual diesel fuel consumption is projected to increase from 350 million liters to 1100 million in the Business as Usual scenario where the current trend was expected to continue. The implementation of biodiesel and bioethanol in the Biofuel Mandate scenario. Additionally, the Biofuel Mandate scenario resulted in a 12.6% reduction of GHG emissions during the projected period. The cumulative GHG emissions in the projection is estimated to be 1630 million tonnes of carbon dioxide equivalents in 2030 for the Business as Usual scenario. In the transport sector, gasoline is projected to increase from 23 billion liters to 54 billion liters over the period. In the Improved Standards scenario, where the emission standards are increased from Euro2 to Euro6 in 2030 for cars and Euro4 for motorcycles in 2025 as well as an annual fuel economy improvement of 2%, the total fuel consumption is reduced with 20% and GWP by 18%. It was found that the annual GWP could be reduced by almost 31% below the 2014 level, at 47 million metric tonnes of CO2Eq, if the actions of the Low Carbon scenario were achieved.
The barriers associated with the Improved Standards scenario were technical, institutional and regulatory while the Biofuel Mandate scenario also had financial, market and distribution barriers. The Low Carbon scenario had barriers from all of the identified barrier categories. The institutional and regulatory barrier was the most prevailing barrier for all of the scenarios.
The recommended actions based on the content of this thesis is to firstly promote collaboration between governmental institutes, stakeholders and authorities and include all stakeholders in the decision progress, this way, frameworks and regulations will have a chance to improve and increase the knowledge about biofuels in all levels. It is also important to implement a stronger biofuel R&D culture, promote a more sustainable biofuel development and increase the public awareness of biofuels. The implementation of biofuels will have a reducing effect on the total GWP and fossil fuel consumption. Gasoline is projected to remain the predominant fuel in the transport sector. Therefore will actions targeting the reduction or substitution of gasoline be more impactful than those towards diesel. However due to the availability and current production capacity of biodiesel there is still potential for higher share of biodiesel in fuels.
Keywords: Multi-Level Perspective, Long-range Energy Alternatives Planning, Biofuels for transport, Indonesia, Barriers.
Table of Contents
1. Introduction ... 1
1.1 Research Problem ... 1
1.2 Research Significance ... 2
1.3 Research Objective and Questions ... 3
1.4 Structure of the Thesis ... 4
2. Background ... 5
2.1 The Biofuel Technology ... 5
2.1.1 Biofuels ... 5
2.1.2 The Sustainability of Biofuels ... 7
2.2 Study Context ... 8
2.2.1 General Information about Indonesia ... 8
2.2.2 Biofuels in Indonesia ...12
3. Methodology ...17
3.1 Research Approach and Strategy ...17
3.2 Theoretical and Conceptual Framework ...18
3.2.1 Framework for Determine Factors Hampering the Biofuel Development: The Multi-Level Perspective ...18
3.2.2 Projections and Scenario Analysis with LEAP: Indonesia’s Transport Sector by 2030 ...22
3.3 Identification of Relevant Renewable Energy Penetration Barriers ...27
3.4 Research Scope and Limitation ...28
4. Data ...30
4.1 Methods for Data Collection and Analysis ...30
4.1.1 Data Collection ...30
4.1.2 Data Analysis ...32
4.2 Data for Projections and ScenarioAnalysis with LEAP ...32
5. Result ...37
5.1 Identified Factors Hampering the Development of the Biofuel Sector ...37
5.1.1 The Multi-Levels Related to Biofuels in Indonesia ...37
5.1.2 Main Barriers Regarding the Development of the Biofuel Sector in Indonesia as Perceived by Stakeholders ...43
5.1.3 Biofuel Sector Development According to the Actors ...45
5.2 Projections and Scenario Analysis with LEAP: Indonesia’s Transport Sector by 2030 ...46
5.2.1 Projections of Fuel Consumption ...46
5.2.2 Projections of Global Warming Potential ...49
6. Discussion ...51
6.2 Accuracy of Report Findings ...55
7. Conclusion...57
7.1 Summary of Research Findings...57
7.2 Recommendations ...58
7.3 Further Research Orientation...59
8. References ...60
List of Figures
Figure 1. Indonesia’s road transport... 2
Figure 2. World biofuel and bioethanol production 2000-2011. ... 5
Figure 3. Biofuel production stages. ... 6
Figure 4. Indonesian GDP per capita forecast. ... 9
Figure 5. Indonesian population trend 1990-2015. ... 9
Figure 6. Indonesian population forecast 2015-2030. ...10
Figure 7. Share of final energy consumption by sector 2014. ...10
Figure 8. Indonesia’s final energy demand. ...11
Figure 9. Car motorization rate. ...12
Figure 10. 2009-2014 domestic consumption and export of biodiesel. ...13
Figure 11. Products made from CPO. ...14
Figure 12. Palm oil plantation area from 2009-2015 divided in owner of estate ...14
Figure 13. The conceptual framework and methodological approach of the study ...17
Figure 14. A socio-technical system perspective of land based road transportation ...18
Figure 15. The three different levels in MLP ...19
Figure 16. Socio-technical systems includes a number of different groups ...19
Figure 17. Transition shown by the MLP...20
Figure 18. The conceptual framework of the LEAP modeling work process. ...23
Figure 19. The vehicle mileage by vintage. ...24
Figure 20. Lifecycle profile for passenger cars and motorcycles. ...25
Figure 21. System boundaries for the MLP analysis ...28
Figure 22. New cars sales share by car class and engine size. ...33
Figure 23. New cars sales in absolute numbers by car class and engine size. ...33
Figure 24. Motorcycle sales in absolute numbers. ...34
Figure 25. The biofuels in Indonesia's transport sector in a multi-level perspective. ...37
Figure 26. Key actors for biofuels in the Indonesian transport sector. ...40
Figure 27. Annual fuel consumption in 2030. ...46
Figure 28. Annual gasoline consumption ...47
Figure 29. Annual diesel consumption...47
Figure 30. Annual bioethanol consumption. ...48
Figure 31. Annual biodiesel consumption. ...48
Figure 32. Annual electricity consumption. ...49
Figure 33. Annual emissions. ...49
List of Tables
Table 1. Properties of diesel and biodiesel. ... 6
Table 2. Properties of gasoline and bioethanol. ... 7
Table 3. Biodiesel mandate B20 as stated in MEMR regulation 12/2015. ...16
Table 4. Bioethanol mandate as stated in MEMR regulation 12/2015. ...16
Table 5. Summary of the different scenarios. ...26
Table 6. Emission standards for the different vehicles. ...27
Table 7. Barriers and their description. ...28
Table 8. Stakeholders’ occupation, organization type and assigned letter...31
Table 9. The annual vehicle kilometer and specific emission standard for cars and motorcycles. ...35
Table 10. The GWP potential for each of the investigated pollutants. ...35
Table 11. Summary of stock and sales data ...36
Table 12. Results of ranking exercise ...42
List of Abbreviations
EU - European UnionMLP - Multi-Level Perspective
LEAP - Long-Range Energy Alternatives Planning NGO - Non-Governmental Organizations R&D - Research and Development GHG - Greenhouse Gasses CPO - Crude Palm Oil
GWP - Global Warming Potential CO2 - Carbon Dioxide
CO2eq - Carbon Dioxide Equivalents CO - Carbon Monoxide
HC - Hydro Carbon NOx - Nitrogen Oxides N2O - Nitrous Oxide
1
1. Introduction
1.1 Research Problem
Today the world is facing a number of critical environmental issues, one of the most urgent being the climate change. Greenhouse gas emissions (hereafter GHG) emissions, mainly arising from the vast anthropogenic usage of fossil fuels, is one of the largest contributors to climate change (Food and Agriculture Organization of the United Nations [FAO], 2013; Intergovernmental Panel on Climate Change [IPCC], 2007).
Currently, the transport sector stands for 23% of the global energy related CO2-emissions and is also the second largest energy consuming sector in the world, causing as much as 35.9 Gigaton CO2-emissions in 2014 (International Energy Agency [IEA], 2014; IPCC, 2007; Le Quéré et al., 2015). This makes the transport sector one of the main contributors to GHG emissions, due to CO2 being one of the largest GHGs (IPCC, 2007). IEA (2014) predicts the vehicle fleet in the transport sector to be twice as large in 2040, something that will increase the fuel consumption almost as much. The most consumed fuel in the transport sector today is the fossil fuel, some of its benefits being its high energy content and accessibility, but it is also associated with environmental and local health issues (FAO, 2013).
Climate change, being regarded as a ‘wicket problem’ (Levin et al., 2007; Chakrabarty, 2012), needs a complex solution to be solved. An alternative to fossil fuel is therefore often stated as biofuels, as it has potential to solve issues related to energy security, pollution of land and water, rural development and GHG emissions while in the same time, maintaining similar properties as fossil fuels; such as easy to store and use, a high energy content and enough similar physical properties to be used in already existing vehicles (Cordes and Schutter, 2011; FAO, 2013; Vasudevan et al., 2005). These reasons are why the world biofuel consumption, mainly made up by the biofuels bioethanol and biodiesel, increased from 2008 to 2016, and are predicted to continue doing so up to 150 billion liters in 2020, almost doubling the production from 2008 (IEA, 2015a). Indonesia, with a rapid increase in both population and economic growth since the Asian financial crisis in 1997, is today considered as one of the countries that could be a leading producer of biofuels in the future (International Renewable Energy Agency [IRENA], 2017). Indonesia is already the current largest export of biodiesel from palm oil and produced more than 50% of the world palm oil biodiesel production in 2016 (BpGlobal, 2017; IRENA, 2017). Indonesia were also in the top three largest biodiesel producers in the world together with Argentina and Germany in 2016 (Ren21, 2017).
IEAs (2014) projection of a three times larger energy consumption in 2030 from 2000 for Indonesia, together with a declining of Indonesia’s’ national fossil fuel reserves, is raising questions of future GHG emissions and energy security, especially as Indonesia in 2015 stated in their Intended Nationally Determined Contribution (INDC) that they by 2030 would do an unconditional GHG reduction of 29% with Indonesia’s total emissions (Ministry of Energy and Mineral Resources [MEMR], 2015; Ministry of Environment and Forestry [MoEF], 2015). As 77.6% of Indonesia’s primary energy supply came from fossil sources in 2015, Indonesia can be considered as heavily dependent on fossil fuels, putting a strain on Indonesia’s energy security (Wright and Rahmanulloh, 2016). The Indonesian transport sector was the largest energy consumer and accounted for 40% of the final energy consumption in 2013 (MEMR, 2016). For the same year it was the third largest emitting sector with 17.5% of the non-Land-Use Change and Forestry GHG emissions (World Resources Institute, 2017).
Environmental and energy concerns have made the Indonesian government promote renewable energy sources, biofuels being one of these (MEMR, 2015; IRENA, 2017). Indonesia has set a goal of 23% renewable energy sources until 2025, where 10% is expected to be from bioenergy with a significant portion being from biofuels (International Civil Aviation Organization, 2017). To further implement biofuels on the domestic market, a regulation for a biofuel blending mandate was prepared by Indonesia’s Ministry of Energy and Mineral Resources in 2008. This regulation (MEMR regulation 12/2015) decides the minimum blending percent of biodiesel in diesel and bioethanol in gasoline to be 30% and 20% respectively until 2025
2
for the transport sector (Wright and Rahmanulloh, 2016). To assist in establishing this, a biofuel subsidy was implemented, largely financed by a levy on palm oil and palm oil production export (Wright and Rahmanulloh, 2016). This subsidy has been deemed important in fulfilling the goals, but since the subsidy has proven expensive, cuts in the funding has been made, affecting the prices of biofuels in Indonesia and spreading market insecurity (Kharina et al., 2016). This, in combination with the fuel blending mandate from 2015 falling short of the yearly targets, has raised a concern whether the mandate and goal of 2025 is achievable and affected the establishment of biofuels in the transport sector (Kharina et al., 2016; Wright and Rahmanulloh, 2016).
Indonesia turned towards biofuels as a solution to their future energy problems, emitting less GHG emissions and increasing their energy security, but biofuels has also raised questions about both deforestation, farming practices and the food-water-energy nexus, causing its sustainability to be questioned and adding further uncertainty of the future development of biofuels in Indonesia (Janda and Stankus, 2017). In order for Indonesia to fulfill its national goals and promote the further development of biofuels in Indonesia, the issues stated above are necessary to address due to being a hindrance for the development. In light of this, this thesis intends to investigate Indonesia’s biofuel potential for fuel consumption and global warming potential (hereafter GWP) reduction in the transport sector and which factors that could hinder the development of biofuels in Indonesia and be possible barriers. Furthermore, this could also bring forward recommendations in how to best develop the biofuels in Indonesia’s transport sector. As the direction Indonesia heads for now will have a significant impact in the future, it is important to consider the alternatives and possibilities. Given the fact that Indonesia also is the largest producer of palm oil, it has a unique position to frontline the biofuel advancement.
1.2 Research Significance
Indonesia is in focus in this study due to its large contribution to the energy consumption in the world, making its transport sector one of the most interesting in terms of problems such as high GHG emissions, pollutions and high energy consumption. Indonesia had the highest vehicle sale of the region in 2014 and is supposed to almost double its total energy consumption in Indonesia until 2030 (Gaikindo, 2015a; Wijeratne and Lau, 2015). Indonesia as well stands for the largest contribution of energy in Association of Southeast Asian Nations (ASEAN) with nearly 40% of the total energy use in the region (IRENA, 2017). The vehicle fleet of Indonesia consists mainly of two-wheelers which made up more than 81% of the entire road vehicle population in 2014 with buses and trucks making up almost 8% together and passenger cars accounting for the remaining 11% see Figure 1. For the total vehicle population, the annual growth rate has been 9.13% with the two-wheelers being the largest contributor to the motorization. As the total vehicle population reached over 114 million in 2014, the total motorization rate were almost 450 vehicles per 1000 inhabitants. (BPS, 2015)
Figure 1. Indonesia’s road transport. Compilation by authors based on data from BPS (2015).
81% 11%
6%2%
3
Even though Indonesia is still mainly dependent on fossil fuels for the vehicles and motorcycles in the transport sector, the Indonesian government is trying to increase the consumption of biofuels domestically, imposing several regulations, laws and policies regarding the consumption and production of biofuels in Indonesia. Having a rapidly increasing energy sector, combined with a wish to increase the national energy security and being one of the fastest growing economies in the world, gives a unique case for studying a development of one of the most discussed renewable energy sources today. As the transport sector stands for the majority of the biofuel consumption in Indonesia (IRENA, 2017) it’s thereby the most vital area for investigation, therefore this thesis will focus solely on Indonesia’s transport sector. Biofuels in the Indonesian transport sector is also vital to investigate, as Indonesia relies greatly on fossil fuels and is deemed to need more fossil fuels in the future (see chapter 1.1). Due to biofuels being one of few fuels suiting as a replacement for fossil fuels (see chapter 1.1), biofuels need to be further examined. In the energy sector, several other renewable energy sources already exist on the market, but as a replacement for fossil fuels, biofuels are one of few.
By identifying the barriers for the development of biofuels in the transport sector, these key areas could be addressed for intervention, leading to possible solutions for the problems stated in chapter 1.1 in further research. It is also important to evaluate the possible impacts of biofuels in the transport sector as to determine the significance of introducing them as a solution to the issues of chapter 1.1.
This area is also further relevant to examine since few previous studies have investigated biofuels in Indonesia or more specifically, the transition towards a development of biofuel in the Indonesian transport sector. They have either been angled towards the sustainability issues of biofuels in Indonesia (Dillon et al., 2008; Obidzinski et al., 2012), biofuel implementation in Indonesia's transport sector (Jupesta, 2010), palm oil production and biofuels (Paltseva et al., 2016; Petrenko et al., 2016) or biofuel development policies in Indonesia and their implementations (Kharina et al., 2016; Sorda et al., 2010; Zhou and Thomson, 2009). Just a few studies have also looked at bioethanol in Indonesia, e.g. Khatiwada and Silveira (2017) or Khatiwada et al. (2016). The research exists regarding biofuels in Indonesia, but it is only looking at parts of the biofuel sector or from a certain perspective, e.g. sustainability. More studies are needed regarding both bioethanol and biodiesel in Indonesia, focused on an overall development in the transport sector. No study before has likewise investigated the entire scope of both current barriers as well as the projected impact of implementation of biofuels in Indonesia’s transport sector, as this thesis strives to do. As this concludes in recommendations for the development of biofuels in Indonesia's transport sector, it further distinguish it from before mentioned studies.
1.3 Research Objective and Questions
The main objective of this report is to investigate current barriers and project future potential of biofuels in terms of fuel consumption and global warming potential (hereafter GWP) in Indonesia's transport sector. From this, recommendations can be derived for the development of biofuels in Indonesia’s transport sector. The objective is approached by using two different tools, the Multi-Level Perspective (hereafter MLP) and Long-range Energy Alternatives Planning System (hereafter LEAP).
This publication uses the term ‘biofuels’ for liquid biofuels that are used as fuel in the transport sector. In this case, the liquid biofuels in the Indonesian transport sector are bioethanol and biodiesel. ‘Biofuels’ also include the biofuel sector in Indonesia.
The objective is achieved by answering the two main research questions;
1. Which factors is hampering the development of biofuels in the Indonesian transportation sector from a Multi-Level Perspective?
To answer this question, a list with barriers of the development of biofuels in the Indonesian transport sector is presented. The barriers are derived from already existing literature on barriers regarding renewable energy penetration and used in combination with the tool MLP, where the MLP is used as a conceptual
4
guide to explore the barriers for biofuels. This thesis is looking at biofuels in Indonesia from a MLP, obtained by doing both a theoretical examination (both technical and social) of biofuels in general and by linking actors and their perspective on the industry to this.
Based on these findings, recommendations how to further successfully develop biofuels in Indonesia’s transport sector is then presented. Possible factors affecting the biofuel development, such as the Indonesian transport sector and Indonesia's laws and regulations regarding biofuels, is also presented.
2. What is the projection of the Indonesian transport sector by 2030 in terms of fuel consumption and GWP and what role could biofuels play in reducing those?
An energy model is used to determine projections for the development of the Indonesian transport sector until 2030 as well as perform energy policy analysis for different policy scenarios. For the transport sector only motorcycles and private passenger cars are considered and are assumed to be either fueled by gasoline or diesel (see chapter 3). The impacts of biofuels are evaluated in terms of its share to the sector total activity of fuel consumption and GHG emissions. The GHGs will be examined for the total global warming potential (hereafter GWP). This will result in providing data on how the fuel consumption and GWP changes depending on the different policy actions and behavioral changes, which in turn can be useful for shaping steering policies as well as evaluating current mechanics. Recommendations of how to further develop biofuels in Indonesia’s transport sector is presented based on the findings. In order to assess the different policy actions scenarios are used, where a reference case scenario following the business as usual trend is compared to the implementation scenario for each of the actions.
1.4 Structure of the Thesis
The thesis is divided into sevenchapters.The first chapter aims at presenting the problem and the general outline of the thesis purpose; research problem, research significance and the thesis’s objective and research questions.
The thesis continues in chapter two with a general introduction to both the biofuel technology and the case site Indonesia, to lay a foundation to the study. The biofuel technology is examined both from a technical and a sustainable perspective, also in order to identify already possible existing technical and sustainable barriers for biofuels. The section about Indonesia as a country is presenting a general overview of the country with some sections covering biofuels in Indonesia and certain laws, policies and regulations concerning biofuels in Indonesia.
The third chapter describes the methods used in order to reach the objective. The main methods here are the MLP and LEAP, used separately to answer the research questions.
The fourth chapter describes the data used in this thesis.
The result, chapter five, is divided in two parts, 5.1 and 5.2. Chapter 5.1 focuses on analyzing the Indonesian biofuel sector from an MLP perspective, and barriers that hinder the further development of the biofuel sector will also be identified with an extended part of the sustainability aspect of the technology as a possible barrier. It ends with a part focusing on how the participants perceived the further development of the biofuel sector in Indonesia. The second part (5.2), will present the finding of the energy model constructed with LEAP for each of the different policy scenarios. The outcome of the scenarios is compiled together to offer an overview of the variation in terms of fuel consumption and GWP.
In chapter six, the development of the biofuel sector in Indonesia is discussed, from why the sector were introduced until how it may look like in the future. The findings of the report were further discussed as well as their accuracy.
Chapter seven, the conclusion, ends the thesis by concluding the main results as well as suggested recommendations for how to develop the biofuel sector in Indonesia.
5
2. Background
2.1 The Biofuel Technology
Chapter two describes biofuels from a technical perspective in order to gain an understanding of the biofuel technologies and its possible drawbacks and benefits from a technical perspective. These may also serve as a clue to already acknowledged problems in Indonesia with the biofuel technologies, which later on can be taken into consideration in the barrier analysis, giving a greater understanding of the biofuel development in Indonesia. It will also provide a starting point in modeling with the LEAP tool as it provides current conditions of the fuel usage and important characteristics of the fuel.
The sustainability issues are known to be one of the most discussed problems with biofuels, which could serve as a drawback for the biofuel technologies development in Indonesia and is therefore discussed in more detail in this chapter (Food and Agriculture organization of the United Nations [FAO], 2015). What more to acknowledge in this assessment is that it is limited to the first and second generations of biodiesel and the first generation of bioethanol, as these are the only biofuels currently occurring in Indonesia and therefore the ones who will be discussed more in detail (see chapter 3.4).
2.1.1 Biofuels
Biofuels are liquid fuels coming from different kinds of biomass, as for example soybean, palm oil or jatropha and produced through biological processes using the direct product or its byproducts (FAO, 2013). Example of byproducts could be organic waste or logs (Biofuel Indonesia, 2007) but what kind of product used is heavily connected with the probability to grow it in the area, for example is this why biofuels from palm oil is heavily exported by Asia (FAO, 2013).
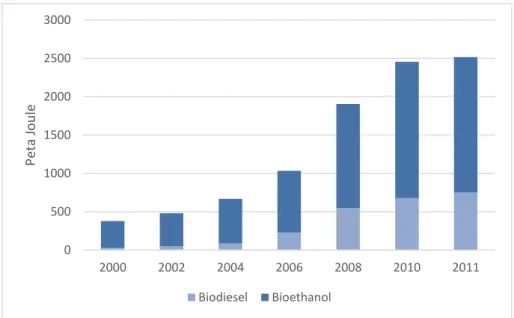
Biofuels has been known as a replacement for crude oil for many decades, but as crude oil was seen as both cheaper and easier to produce, the biofuels has always come as a second choice, resulting in the already established fossil fuel sector working as a barrier for biofuels to come through (Biofuel Indonesia, 2007). As environmental concerns and the concept of peak oil came up on the agenda, biofuels has started to be regarded with more interest (Figure 2) (Biofuel Indonesia, 2007). This led to an increased production of biofuels from 80 billion liters in 2008 to 140 billion liters in 2016 (IEA, 2015a).
Figure 2. World biofuel and bioethanol production 2000-2011. Compilation by authors based on Timilsina (2014). Generally, biofuels can be referred to three different types of plant-based liquid fuels; biodiesel, bioethanol and bio-oil (Vasudevan and Shamra, 2005). What kind of biofuel are depending on mainly three different
0 500 1000 1500 2000 2500 3000 2000 2002 2004 2006 2008 2010 2011 Peta Jo u le Biodiesel Bioethanol
6
characteristics; from what it is produced, how it is produced and what kind of fuel molecules that emerge from the production (Janda and Stankus, 2017). Biofuels can from this be categorized into three different generations;
1st generation; biofuels produced from sources like starch, vegetable oils, animal fats and sugar products.
2nd generation; biofuels made from cellulosic products, usually used to feed livestock, mainly wastes, energy crops or agricultural leftovers.
3rd generation; biofuels made from algae, which can give arise to both biodiesel and some components of gasoline. (Beyene, 2016; Janda and Stankus, 2017)
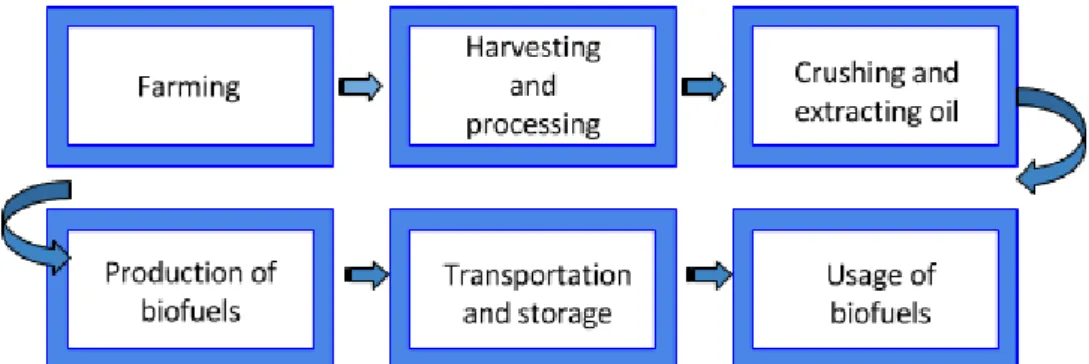
Biofuels are according to Kazamina and Smith (2014) usually produced as following: farming of the feedstock by plantation, harvesting and processing, crushing and extracting oil from the feedstock, transportation of extracted oil to the production factory where the biofuels is produced, transportation and storage of extracted fuel and finally the usage of the fuel (see Figure 3). As seen, the production process of biofuels consists mainly of the agriculture and the processing sector, where the agricultural sector produces the feedstock for biofuels and the processing sector turns the feedstock into biofuels and consumes them (Vasudevan and Shamra, 2005).
Figure 3. Biofuel production stages.Compilation by authors as perceived from Kazamina and Smith (2014). Biodiesel
Biodiesel or green diesel that some call it, can be produced by combining alcohol with different oils from plants, fat from animals or greases, such as for example palm oil, soybean oil or jatropha carcass (Beyene, 2016; Janda and Stankus, 2017). It is generally used as a substitute for diesel oil (Cordes and Schutter, 2011). Biodiesel blending is a common trait around the world, with everything from 5% to 20% biodiesel blending with diesel.
Biodiesel has similar properties as crude-oil based diesel as seen in Table 1.
Table 1. Properties of diesel and biodiesel. Compilation by authors Diffen (2017), Eriksson and Ahlgren (2013) and Vasudevan et al. (2005).
Properties Diesel Biodiesel
Usages In diesel engines In diesel engines
Made from Petroleum/ crude oil Alcohol and oils
Energy content 43.3 MJ/kg 38.0 MJ/kg
GWP (CO2eq) 87.4 g/MJ 40.8 g/MJ
Generally, biodiesel can only use a diesel engine but some blends can go directly into heat and power operators. In older engines, Biodiesel can be used up to a blend rate of 20% without necessary improvements, which is especially interesting in countries with older cars still in usage. Studies have shown that including it in mix with diesel could increase the safety in warmer countries as the flash point for ignition increases and increase the lifetime of various engine components due to the greasing effect (Agarwal, 2006;
7
Vasudevan et al., 2005). However, one drawback could be that the same properties can lead to ignition problems in colder countries and the clogging of fuel filters (Agarwal, 2006). The requirement for newer engines is sometimes seen as the largest technical barrier for implementing biofuels (Janda and Stankus, 2017).
Bioethanol
First generation bioethanol, is made by doing bioethanol from the alcohol coming from fermented agricultural crops containing sugar, such as sugarcane or corn (Beyene, 2016). The second generation bioethanol is cellulosic bioethanol, where a range of different materials’ cellulose (e.g. solid waste or wood) can be used to make the bioethanol, making it relatively easy to obtain (Janda and Stankus, 2017). Bioethanol is generally used as a substitute for gasoline (Cordes and Schutter, 2011). For more information, see Table 2.
Table 2. Properties of gasoline and bioethanol. Compilation by authors based on Diffen (2017), Eriksson and Ahlgren (2013) and Vasudevan et al. (2005).
Properties Gasoline (Petrol) Bioethanol
Usages In gasoline engines In newer gasoline engines
Made from Petrolium/ Crude oil Agricultural crops containing sugar
Energy content ~44.8 MJ/kg ~26.7 MJ/kg
GWP (CO2eq) 87.2g/MJ 56.2 g/MJ
Traditional motors can run on E5 (5% bioethanol and 95% gasoline) as well as E10 but E85 and E100 is only used in motors with a flex-fuel engine. Gasoline also contains more energy per volume compared to bioethanol or in other words, the same amount of bioethanol as gasoline generate less energy to the motor. This makes it harder to sell and a possible market barrier (Janda and Stankus, 2017)
Additionally, this will require the vehicles to have larger fuel tanks or be limited to shorter distances (Agarwal, 2006). However, studies have found that the inclusion of bioethanol will increase performance of engines in terms of torque at lower levels (Thakur et al., 2017).
2.1.2 The Sustainability of Biofuels
The sustainability perspective in this report is a central perspective in many parts, especially when talking about the sustainability of biofuels. The sustainable development concept is famously defined in the report
Our Common Future - Brundtland Report as; “Sustainable Development is development that meets the needs of the present without compromising the ability of future generations to meet their own needs.” (United Nations 1987, p. 41). This
definition serves as this reports view on sustainable development.
There are also a number of other different factors to consider in order to touch the three different pillars of sustainability; the economic, the environmental and the social sustainability (FAO, 2013). To be deemed truly sustainable, biofuels has to be able to meet all of these three pillars. These sustainability aspects in relation to biofuels are therefore discussed below, especially as biofuels for long has gained negative attention in relation to a number of sustainability aspects which are discussed below.
Due to Indonesia being an “emerging economy”, Tukker (2005) deemed it's important for Indonesia to be careful with new technologies in relation to sustainable development and not repeat the sustainability ‘mistakes’ already developed economies have done in regard to new technology. With this in light, the biofuel technology in Indonesia should be carefully monitored in relation to the sustainability concept, particularly as many emerging technologies also have a close relation with social issues (FAO, 2013). Indonesia’s sustainability issues related to biofuels are discussed more in detail below. These sustainability issues have been chosen due to their occurrence in Indonesia and they were the most frequently mentioned during the interviews with stakeholders in the biofuel sector (see chapter 4 and 5.1).
8
Main Sustainability Issues with Biofuels in Indonesia
Biofuels has during a long time been considered sustainable, mainly from the fact that biofuels are considered to release none or a low amount of GHG emissions into the atmosphere. The GHG emissions is one of the largest sources for climate change and therefore it is an important metric to consider regarding sustainability (FAO, 2013; IPCC, 2007). Nowadays, biofuels such as bioethanol and biodiesel is not considered CO2-neutral, but are considered to reduce the emissions in a larger extent than crude-oil based fuels (Janda and Stankus, 2017; Petterson and Grahn, 2012; Zaimes et al., 2017).
When talking about the farming of biofuels, a number of sustainability issues arise. Two of the most spoken about in Indonesia is the loss of biodiversity and land degradation which mainly occur when land has to be altered in order to farm biofuels, putting pressure to turn forest land into a farming area (Beyene, 2016; Cordes and Schutter, 2011). What type of land you alter is also deemed important, as for example rainforest have a higher environmental impact than forestland due to its rich biodiversity (Hidayatno et al., 2011). According to Beyene (2016), another problem is the high amount of water used in the farming and conversion stages of biofuel production, affecting Indonesia’s water security. Cordes and Schutter (2011) state that bioethanol conversion is twice more water consuming than gasoline. The increased farming of biofuels also causes an increased amount of fertilizers and pesticides used, triggering problems with polluted land and water and eutrophication, affecting both humans and animals (Cordes and Schutter, 2011). Another problem related to the farming of biofuels is the food-water-energy nexus, which refers to the interlink in between food, water and energy and that scarcity in one of these areas, is heavily linked to the others and always affect each other (FAO, 2013). The increasing food and water demand, mainly due to an increasing population in Indonesia, causes a food and water vs biofuels problem (Rulliet et al., 2016). Energy security is indeed one of the biggest benefits talked about today with biofuels, which is especially appreciated on the political agenda (Kazamia and Smith, 2014). An improvement of energy security with biofuels for Indonesia would mean less reliance on foreign energy import (e.g. oil import) and more reliance on energy the country can produce by itself and be less influenced of the global market. It could through also make the country more sensitive to environmental phenomena like drought or diseases affecting the harvest as supplies can be volatile (Cacciatore, 2012).
2.2 Study Context
In this chapter, the case context of Indonesia will be presented with specific information on the country and its current trends and future projections. This chapter also gives a background to do an adequate study with the tools MLP and LEAP as it gives insight how historic trends has resulted in the current situation. Biofuel related policies, laws and regulations in Indonesia is presented in the end of this chapter, to give insight in what have been done to implement biofuels nationally in Indonesia and what have been done to develop the biofuel sector.
2.2.1 General Information about Indonesia
Indonesia is a lower middle-income country located in east Asia with a GDP of 942 billion USD1 ranking it as the 9th largest economy worldwide in 2014 (Hawksworth and Chan, 2015; World Development Indicators [WDI], 2017). For the last 25 years the average GDP per capita have grown by 3.44% annually and were around 3700 USD/capita2 by 2014 (WDI, 2017). Projections in Figure 4 suggests that the GDP per capita will pass 5000 USD/capita in 2020 and reach 8350 USD/capita in 2030 if the recent high economic growth continues.
1 In USD from year 2010s currency in dollar. 2 In USD from year 2010s currency in dollar.
9
Figure 4. Indonesian GDP per capita forecast. Compiled by authors based on trends by Knoema (2017).
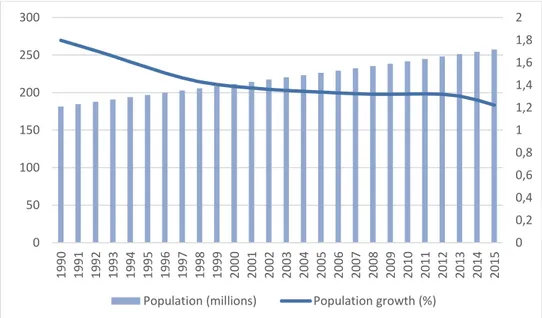
The population of Indonesia reached over a quarter billion in 2013 making it the 4th populous nation in the world (MoEF, 2015; WDI, 2017). The historic population growth rate has been decreasing until it stagnated in the early 2000s and remained so for the following decade, in the recent years it has showed a trend of further reducing its speed as shown in Figure 5. Indonesia’s population growth is expected to follow the current trend of decline as it is estimated to drop below 1% in 2020 and decreasing to 0.7% in 2030. In 2030, it is projected that Indonesia's population will have reached 295 million as can be seen in Figure 6. There is an ongoing urbanization in Indonesia and since 2011, more than half of the population is living in urban areas (WDI, 2017).
Figure 5. Indonesian population trend 1990-2015.Compilation by authors based on data from UN (2015).
0 1 2 3 4 5 6 7 0 1000 2000 3000 4000 5000 6000 7000 8000 9000 2015 2016 2017 2018 2019 2020 2021 2022 2023 2024 2025 2026 2027 2028 2029 2030 GDP per capita (USD 2010) GDP per capita growh (%)
0 0,2 0,4 0,6 0,8 1 1,2 1,4 1,6 1,8 2 0 50 100 150 200 250 300 1990 1991 1992 1993 1994 1995 1996 1997 1998 1999 2000 2001 2002 2003 2004 2005 2006 2007 2008 2009 2010 2011 2012 2013 2014 2015 Population (millions) Population growth (%)
10
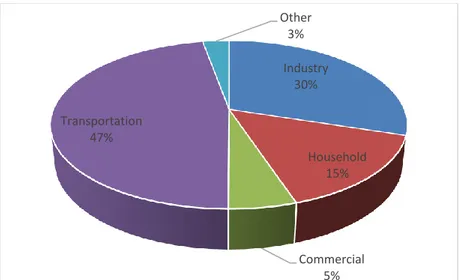
Figure 6. Indonesian population forecast 2015-2030. Compilation by authors based on data from UN (2015). More than 75% of the national primary energy supply came from fossil fuels in 2014, indicating a high reliance on fossil fuels (MEMR, 2016a). As of 2011, Indonesia has been exporting more energy than it uses domestically and have been seen a net energy exporter for decades (WDI, 2007). Due to its large energy consumption increase the last decade, it went from being a net oil export to a net oil importer in 2004 and is today the second largest oil importer in the region, making it want to increase its national energy production due to energy security improvements (IEA, 2015b). Moreover, in terms of fuels for transportation, more than half is directly imported while over a fifth is indirectly imported through crude oil (MEMR, 2016a). Since the transport sector accounted for 47% of the final energy demand in Indonesia 2014 (Figure 7), it plays a major role in terms of energy self-dependence.
Figure 7. Share of final energy consumption by sector 2014. Compilation by authors based on data from MEMR (2016a).
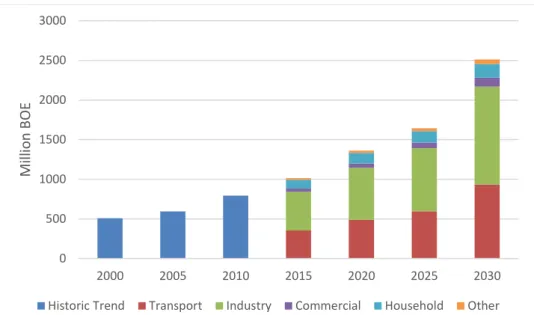
Indonesia’s final energy demand have grown rapidly in the past decades and is projected to continue doing so in the future (Agency for the Assessment and Application of Technology [BPPT], 2016). It is expected to have doubled in the period from 2000-2015 and is projected to grow with 150% in 2030 compared to 2015 (Figure 8). 0 0,2 0,4 0,6 0,8 1 1,2 1,4 230 240 250 260 270 280 290 300 2015201620172018201920202021202220232024202520262027202820292030 Population (millions) Population growth (%)
Industry 30% Household 15% Commercial 5% Transportation 47% Other 3%
11
Figure 8. Indonesia’s final energy demand. Compilation by authors for historic trend data is based on MEMR (2016a) and for Projection the data is based on BPPT (2016).
According to Presidential Regulation No.79/2014 the energy consumption in 2025 should consist of at least 30% gas, 22% coal, less than 25% petroleum and 23% from new energy and renewables, new energy can be sources as nuclear and coal bed methane (Presidential Regulation, 2014). These shares should change to be minimum 25% gas, 24% coal, less than 20% petroleum and at least 31% new energy and renewables in 2050 (President of the republic of Indonesia, 2014). The regulation has been formed as a push to make Indonesia completely self-sufficient in energy (IEA, 2015b).
Agriculture have historically been an important sector in Indonesia as it accounted for 56.2% of the total employment and 23.4% of the GDP in 1989. Even though its significance has declined somewhat it still accounted for 34% of the employment in 2014 and 13.3% of the GDP, making it one of Indonesia’s largest sectors. The area used for agriculture purposes have continued to grow from a quarter of Indonesia's 190 million hectares in 1989 to 31.5% in 2014 (WDI, 2017). Even though Indonesia has a large agricultural sector, it is still a country that is plagued with food security issues and have experienced increased food security problems since 2008. An Asian Development Bank [ADB] study identified grains, horticulture and livestock as some of the major food imports in Indonesia (Quincieu, 2015).
Indonesia’s Vehicle Fleet
In Indonesia, road transport is the dominant form of transportation with almost 85% of the passenger activity (Leung, 2016). However, the settings of the current infrastructure are lacking. More than half a million km of road 34.5% is either damaged or severely damaged which have been identified as a limiting factor to the economic growth but also a safety issue (Badan Pusat Statistik (BPS), 2015; Leung, 2016; Smith et al., 2015). Furthermore, there is an undeveloped road capacity which leads to regularly occurring traffic jams and low traveling speeds, which have been linked to increased fuel consumption (Deedarlianto et al., 2017; Ministry of Transportation, 2015; Leung, 2016). Another concern is the local pollution associated with the road traffic and the diseases with strong correlation to those (Leung, 2016).
Indonesia have also experienced an increasing motorization rate in terms of passenger cars over the recent years with an average annual growth rate of 9% between 2011 and 2015 (BPS, 2015). This have led to car ownership increasing by over a third during that period, as can be seen in Figure 9. A bolstering factor on the influx of passenger cars have been identified as the strong economy (Titikorn, 2016) as well as the introduction of the low-cost green car (Titikorn, 2016; Scherer et al., 2016).
0 500 1000 1500 2000 2500 3000 2000 2005 2010 2015 2020 2025 2030 Mi llio n BOE
12
Figure 9. Car motorization rate.Compiled by authors based on data by BPS (2015).
2.2.2 Biofuels in Indonesia
Since the beginning of the 2000 century, the increased Indonesian living standards in combination with a stronger economic development and an increasing number in population has caused a higher energy demand in line with the increase in GDP. This fact in collaboration with Indonesia as a large net importer of fossil fuels such as oil, coal and gas, caused Indonesia in 2006 under the government of president Susilo Bombang Yudhoyono to steer its sight towards renewable energy sources, mainly biofuels which could be produced domestically (The Business Watch Indonesia [BWI], 2007). The biofuels biodiesel and bioethanol is both produced in Indonesia, where biodiesel is standing for almost all domestic production.
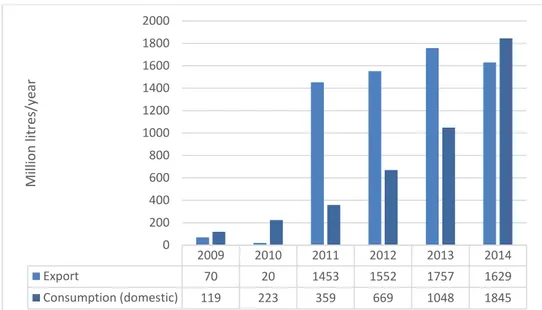
As stated, biofuel production has developed differently when looking at the production rate for biodiesel and bioethanol. The biodiesel production has increased steadily, as have the domestic consumption and the export of biodiesel (Figure 10). The bioethanol production is though still small in comparison (Wright and Rahmanulloh, 2015). According to Wright and Rahmanulloh (2015), this is closely connected with the nonappearance of subsidy support for bioethanol, that ended in 2010 due to infrastructure shortcomings, low feedstock production and insufficient results from the economic support given by the government. A small production still exists in Indonesia, but it's mainly exported (Wright and Rahmanulloh, 2015). When it comes to export of biodiesel, the European Union has long been a key trade partner, but due to increased import taxes, China is now the number one importer with 55% of Indonesian export market of biofuels in 2014 (Wright and Rahmanulloh, 2015). The increased biofuel production and utilization in Indonesia is supposed to increase Indonesia's energy security, create job opportunities, reduce GHG emissions and thus, boost Indonesia’s economy in the long run and decrease poverty (Mukherjee and Sovacool, 2014).
0 10 20 30 40 50 60 0 2 4 6 8 10 12 14 16 2011 2012 2013 2014 2015
13
Figure 10. 2009-2014 domestic consumption and export of biodiesel. Compilation by authors based on data from MEMR (2016b).
The biodiesel in Indonesia is produced from palm oil and to some extent, jatropha carcass whereas bioethanol is mainly made from sugarcane molasses (Wright and Rahmanulloh, 2016). BPPT, a non-ministerial government developing biofuels in Indonesia since 2000, is stating that palm oil and jatropha are the most important crops for developing the biofuel industry in Indonesia, but Indonesia currently also uses sugarcanes molasses to produce biofuels (BWI, 2007). Both the sugarcane molasses and jatropha carcass has been deemed as having lower extraction yield than palm oil and thus needing larger production areas to come up to the same extraction yield as palm oil, something that has shown to be problematic and thus decreasing the chances for these crops market to expand (Wright and Rahmanulloh, 2015).
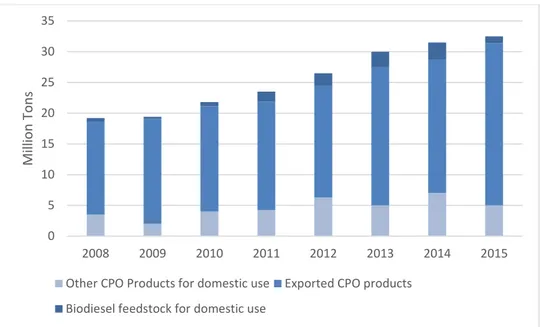
Palm oil is today Indonesia’s most used source for biodiesel and according to Wright and Rahmanulloh in a study from 2016; the only competitive option in the Indonesian market. Indonesia is one of the world's leading producer of palm oil with 25 billion liters palm oil produced/year (Mukherjee and Sovacool, 2014), which is also expected to increase up to 35 billion tonnes in 2016, which is the largest production in the world with more than half of the world'spalm oil biodiesel production (Indexmundi, 2016). According to FAOs statistic division for food and agriculture (FAOSTAT, 2016), more than 70% of the palm oil products is being exported, while the rest was used domestically with 73% used for food products and 12% was used to produce biofuels, accounting for one million metric tonnes fuel. This gives Indonesia plenty of room to use CPO for producing more biodiesel if Indonesia exported less (Figure 11) (Indonesia-Investments, 2016; Wright and Rahmanulloh, 2016).
2009 2010 2011 2012 2013 2014 Export 70 20 1453 1552 1757 1629 Consumption (domestic) 119 223 359 669 1048 1845 0 200 400 600 800 1000 1200 1400 1600 1800 2000 Milli o n lit re s/y ear
14
Figure 11. Products made from CPO.Compilation by authors made by data from Indonesia-Investments (2016) and Wright and Rahmanulloh (2016).
During the last couple of years, there has been an increased interest in expanding palm oil plantations in Indonesia, suggesting an interest in expanding the biofuel palm oil industry, see Figure 12. Today, 15 million hectares is used for oil palm production in Indonesia, making it almost 10% of its total land area (Colchester et al., 2006; Ministry of Agriculture, 2015). The growth in demand for biofuels has caused the government to allocated 20 million more hectares towards palm oil productions, more than doubling the palm oil plantation area and an increase of the present land area of cultivation by 330% (Petrenko et al., 2016). Permission is needed from the government both to be able to farm the feedstock used for biofuels as well as to work the land (IRENA, 2017).
Figure 12. Palm oil plantation area from 2009-2015 divided in owner of estate (Statistics Indonesia, 2015). Biofuel Related Policies, Laws and Regulations in Indonesia
In 2006, Presidential Regulation No.79/2014 established Indonesia's future outlook for biofuel goal in utilization and development; a “5% biofuel in national energy consumption mandate by 2025” (Kharina et al. 2016, p. 8). From 2008, MEMR issued a regulation for a biofuel blending mandate (MEMR Decree
0 5 10 15 20 25 30 35 2008 2009 2010 2011 2012 2013 2014 2015 Milli o n Ton s
Other CPO Products for domestic use Exported CPO products Biodiesel feedstock for domestic use
15
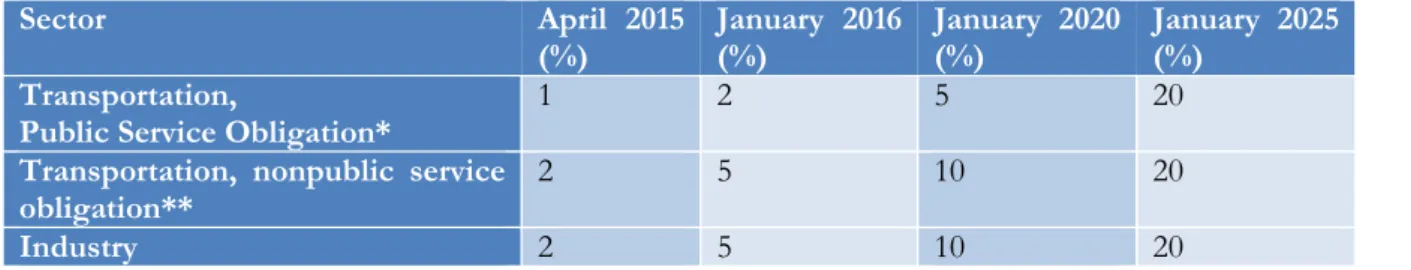
32/2008) during 2008-2025, stating the biofuel mix in diesel oil and gasoline (BPPT, 2016). This mandate, domestically called ‘the B20 program’, has since then changed several times throughout the years. In the latest regulation, MEMR regulation 12/2015, the government implemented B20 for the biodiesel in the transport sector, which mixed biodiesel with 15% April 2015, 20% 2016 and will be 30% in 2030 (BPPT, 2016) (Table 3 and Table 4). The responsible actors for meeting this target is deemed to be end usage companies as well as companies who is licensed to sell fuels to end users, e.g. Pertamina (Indonesia’s national energy company) or Shell (Kharina et al., 2016).
Until this date, the goal of this regulation has varying opinions whether it is being fulfilled. According to Wright and Rahmanulloh (2016) and New, Renewable Energy and Energy Conservation (2014), the mandate targets was not fulfilled in 2014, leaving the blending target at 73% fulfillment for Pertaminas’s fuel (subsidized fuel) and from 9-35% fulfilled for other non-subsidized companies, with no penalties issued to august 2016 according to Kharina et al. (2016). It is also a discussion whether the domestic fuel consumption is enough in order to reach the blending quotes stated (Kharina et al., 2016).
In order to be able to fulfill the blending mandate, the government issued subsidies in order to erase the gap in between the prices for petroleum and biodiesel fuels, as the biodiesel fuels is generally pricier than petroleum fuels. According to IEA (2015b), the fuel subsidies goes up to three times more in money spending than the spending on infrastructure, causing Indonesia to have one of the world’s lowest net import oil prices. These subsidies have in recent years been up for discussion since they have put a burden on the national budget. In consideration to this, most of the subsidies was abandoned from 2015, as for example fuel subsidies for gasoline. The government still subsides biodiesel through selling by the companies Pertamina and AKR Corporindo (Kharina et al., 2016).
In 2015, in continuation to the debate regarding subsidies for biofuels, it was decided the subsidy for biofuels was to be financed by a levy on palm oil and palm oil production export (Wright and Rahmanulloh, 2016). The palm oil export levy is collected by the Indonesian Oil Palm Estate found (BPDP) who manage it, and redistributes it as a subsidy to biofuel producers who manage the B20 mixing. As the sum of the levy is based on the difference in price between diesel made from fossil fuel and biodiesel, most of the sum collected by BPDP goes to support of the production of biofuels (Kharina et al., 2016). In 2016, the palm oil levy was at $1.2 billion, only accounting for a subsidy support for on average up to 15% biofuel blending, less than the 20% national blending goal for 2016 (Kharina et al., 2016).
The development of palm oil has in recent years been overshadowed by the growing environmental concern surrounding biofuels, as uncertainty about CO2 emissions and land use impacts is questioned (Mukherjee and Sovacool, 2014). This has led to governmental intervention, as a policy was issued with Presidential Regulation No. 61/2015, which stated that funds are to be used to encourage sustainable palm oil plantation (hereafter POP) (BPPT, 2016). To regulate the palm oil industry to go in a more environmental direction, a palm oil export tax was for the first time issued in 1994 (Rifin, 2010), stating that when exporting any palm oil product, either pure or in goods, you are subjected to pay a tax. From July 2015, further changes were; the tax money should be used for research and promotion of the (BPPT, 2016).
Even though this fee and policy is in place, Elliot stated in 2015 there is a lack of sustainability perspectives in the regulation surrounding the handling of biofuels in Indonesia, especially biodiesel. According to Interviewee A3 (see chapter 4), even though there seem to be an increased awakening in the sustainability issues regarding biofuels, there is yet no explicit regulation, policies and laws concerning for example the production of biofuels regarding deforestation. Indonesia has though expressed an interest in combating climate change and done several commitments to reduce GHG emissions nationally (Kharina et al., 2016). Moreover, a Roundtable of sustainable Palm Oil (RSPO) certification is also occurring in the palm oil industry voluntarily while an Indonesian Sustainable Palm Oil (ISPO) certification is mandatory for the palm oil plantations but voluntarily for the palm oil smallholders (Khatalina et al., 2016).
16
KEY REGULATIONS IN NUMBERS
National mandates for biodiesel (Table 3) and bioethanol (Table 4):
Table 3. Biodiesel mandate B20 as stated in MEMR regulation 12/2015. Compilation by authors based on data from BPPT (2016).
Sector April 2015
(%) January 2016 (%) January 2020 (%) January 2025 (%) Transportation,
Public Service Obligation* 15 20 30 30 Transportation, nonpublic service
obligation** 15 20 30 30
Industry 15 20 30 30
Electricity 25 30 30 30
*Public service obligation is vehicle fuel sold through Pertemina, as a state-owned company. **Nonpublic service obligation refers to fuel sold by private owned companies.
Table 4. Bioethanol mandate as stated in MEMR regulation 12/2015. Compilation by authors based on data from BPPT (2016).
Sector April 2015
(%) January 2016 (%) January 2020 (%) January 2025 (%) Transportation,
Public Service Obligation* 1 2 5 20
Transportation, nonpublic service
obligation** 2 5 10 20
Industry 2 5 10 20
*Public service obligation is vehicle fuel sold through Pertemina, as a state-owned company. **Nonpublic service obligation refers to fuel sold by private owned companies.
17
3. Methodology
3.1 Research Approach and Strategy
Figure 13. The conceptual framework and methodological approach of the study. Compilation by authors.
This study uses two tools, MLP - Multi-Level Perspective and LEAP - Long-Range Energy Alternatives Planning. The first one, the MLP analysis, is qualitative top down model, focusing on attacking the objective from the top to down and provide an analysis on the different barriers and the conditions for future development from a socio-technological perspective. The second one, the LEAP is a quantitative energy model for projecting future trends for biofuels in the transport sector, attacking the objective from the bottom and up. The resulting projections from the LEAP model also brings attention to possible barriers and possibilities from a technical perspective. In an integrated perspective, these two methods will provide an enlightening and concluding remark on the future possibilities for biofuels in Indonesia's transport sector in this thesis. The MLP analysis was used to identify the prominent barriers that prevents the different policy options of the LEAP scenarios from being achieved. The conceptual workflow of the thesis is presented in Figure 13. The tools will be further presented in chapter 3.2.
Moreover, the research approach to identifying barriers for renewable technology, were chosen in consideration of Painuly’s report “Barriers to Renewable energy penetration” published 2001 (Painuly, 2001), where he recommends three approaches to identify suitable barriers in a selected country:
Literature survey - search literature about the site, technology and surrounding complementing information.
Site visits - visit the site and learn about important socio-economic matters and other important factors concerning the technology. A field study can be important when identifying barriers.
18
Interaction with stakeholders - Interact with the stakeholders to obtain their perspective.
In compliance with this, this thesis is built upon integrating document analysis with empirical field work where interviews were conducted. After performing a literature survey on the subject, the authors visited Indonesia for two months during the 20th of March until the 15th of May 2017 to conduct a site visits and perform interviews with stakeholders. The literature review was mainly used in the background study and as a complement in the result part of the MLP analysis as well as general data inputs of the LEAP model.
3.2 Theoretical and Conceptual Framework
3.2.1 Framework for Determine Factors Hampering the Biofuel Development: The Multi-Level Perspective
Today’s environmental problems, such as biodiversity or climate change, are what we call socio-technical problems. To be able to solve these problems, major changes must be done in regard to user practice, cultural behaviors and the market, but it also entails a transition towards new technologies (Geels, 2010). Existing systems as for example the transport sector, is a system that needs to be changed in all the aforementioned categories in order to generate a socio-technical transition towards sustainability (Geels, 2004).
The multi-level perspective (Geels, 2002, 2012; Geels and Schot, 2007) is a concept aiming to describe how system transitions happens with the help of an examination of the linkages in between technology and society (Geels, 2004). It’s also widely used to describe sustainability transitions, which makes it especially suited for the transport sector as it refers to changed transport behavior as well as a change in both the market and the use of technology (Whitmarsh, 2012). In Figure 14, Geels (2004) shows an example of land based road transportation viewed from a sociotechnical system perspective.
Figure 14. A socio-technical system perspective of land based road transportation(Geels, 2004).
The multi-level perspective was first mentioned in 1998 by Rip and Kemp and were later on further developed in a number of different articles (e.g. Geels, 2010; Verbong and Geels, 2007; Whitmarsh, 2012). The MLP, as its name entitles, builds on three different analytical levels within socio-technical systems; niches, socio-technical regime and socio-technical landscape as can be seen in Figure 15 below (Geels, 2012). These three levels provide different kinds of coordination and structuration of activities in the everyday life.
19 Figure 15. The three different levels in MLP(Geels 2002, p. 1261). Niches; the Micro-Level
The first level, the niche level is the place which paws the way for new practices and discoveries by containing the radical innovations which later on can be enforced in the above levels as new learning material. It is also here where new social networks are built to support the new innovations which later on makes them part of a regime. (Geels, 2012)
Niche actors is those who works with the development of new technologies that doesn’t exist in the existing regime, in hopes of one day implement their “niche technology” in the regime (Geels 2012, p. 473). This is also why the niches is so important; if a new innovation succeeds, it lays the foundation to a system change (Geels, 2004).
Socio-Technical Regime; the Meso-Level
Socio-technical systems are either maintained or changed by various social groups and actors, which behavior comes from already existing socio-technical regimes, rules that guide the actor’s behavior and how they see the world (Giddens, 1984). Socio-technical regimes has several actors that affect the regime, as a socio-technical system is built upon several actors that interact with each other (see Figure 16) and are also often aligned with each other as they are in the same socio-technical regime and thus are affected by the same rules (Geels, 2004).
Figure 16. Socio-technical systems includes a number of different groups(Geels 2002, p. 1260).
The different regimes coexist with each other at the regime level, and one regime can entail several regimes under it. For example can the automobile regime be seen as the dominant regime over the subaltern transport regime, as the transport regime is made up by several different regimes e.g. the bus, cycling,
20
motorcycle or train regime, which all goes under the concept of automobiles (Geels, 2012). Together these regimes all make up to one regime as they cannot be called niches due to the fact that they already have a fully developed net of laws, regulations, believes and associated feelings due to their long history, they are not new or emerging. Though, in the sense of their small regime occupation, they could in a sense be called “small market niches” (Geels 2012, p. 473).
A change of the regime can be hard due to certain lock-in mechanisms, such as economic barriers, laws and regulations, social shared beliefs and existing infrastructure (Geels, 2012).
Socio-Technical Landscape; the Macro-Level
The socio-technical landscape is an abstract concept describing the environment in which socio technical development occur (e.g. globalization or economic and political changes) and can be viewed as something that maintain our surroundings (Geels, 2012; Rip and Kemp, 1998, p. 334). This include the material aspects of the society, such as transportation, housing and how a city is built in terms of infrastructure but also ideologies, morals and political development (Geels, 2004; Geels 2012). A landscape is hard to change and cannot be directly influenced by individuals direct will, which can put pressure on the regime as the landscape ‘controls’ their behavior, which makes development at this level relatively slow (Geels, 2004). A Transition Change Towards Sustainability According to the Multi-Level Perspective
A transition is only happening if linked developments occur at all three different levels (Geels, 2002). According to Geels and Schot (2007, p. 400), for a transition to happen, the niche regime can put pressure on the other levels by price changes, learning processes or lobbying with the help of powerful actors, landscape changes can put pressure on the regime and the regime can be unstable due to inner pressure which is opening up opportunities for the niche actors. It is important that the landscape is with on the transition, as it is the landscape who puts pressure on the regime to change, for example by forcing the regime to consider new technologies.
Figure 17. Transition shown by the MLP (Geels 2002, p.1263).
Geels (2004) and Geels and Schot (2007) also talks about four phases when a system breakthrough takes place (see Figure 17). The first phase, shows the new technology emerging and take its spot under the regime