Visualization of Composite Events in Active Databases
(HS-IDA-EA-00-104)
Ólafur Pálmi Guðnason (a97olagu@ida.his.se)
Institutionen för datavetenskap Högskolan i Skövde, Box 408
Visualization of Composite Events in Active Databases
Submitted by Ólafur Pálmi Guðnason to Högskolan Skövde as a dissertation for the degree of B.Sc., in the Department of Computer Science.
09-06-2000
I certify that all material in this dissertation which is not my own work has been identified and that no material is included for which a degree has previously been conferred on me.
Visualization of Composite Events in Active Databases Ólafur Pálmi Guðnason (a97olagu@ida.his.se)
Abstract
The composite event detection process in different consumption modes has been proven to be difficult to comprehend. It is believed that visualization of this process can make it easier to grasp. In this final year project, a prototype of a visualization tool that visually displays the composite event detection is developed. The prototype uses time graphs to display the composite events and the chronicle consumption mode is used in the detection of the composite events. Animation is used in the prototype when the composite events are visualized, as it is believed that animation can be of help when learning complex algorithms, such as consumption modes. The prototype is then compared with other similar visualization tools. This prototype addresses factors, which have been identified as playing a central role in the visualization of composite events, that other similar visualization tools do not.
Key words: Active database management system, ADBMS, composite events, consumption modes, visualization, animation.
Contents
1
Introduction ...1
2
Active Database Management Systems ...2
2.1 Events ... 2 2.1.1 Primitive Events... 3 2.1.2 Composite Events ... 3 2.1.3 Event Parameters ... 4 2.2 Event Detection ... 4 2.2.1 Event History ... 4 2.2.2 Consumption Modes ... 5 2.2.3 Time Graphs... 6 2.2.4 Event Graphs... 7
3
Visualization...9
4
Animation ...10
5
Related Work ...13
5.1 Central Factors When Visualizing Composite Events ... 13
5.2 ADELA ... 14 5.3 Vizar ... 16 5.4 DEAR ... 17 5.5 VITAL ... 18 5.6 Sentinel... 19
6
Problem Description...21
6.1 Problem ... 216.2 Proposal for a Solution ... 21
6.3 Problem Definition ... 22
6.4 Restrictions... 22
6.5 Expected Results ... 22
7
Method ...23
7.1 Alternative Approaches ... 23
7.1.1 Traditional Software Model ... 23
7.1.2 Rapid Prototyping ... 25
7.2 Choice of Approach... 27
8.1 Visualization Aids ... 29
8.1.1 Toolmaster agX... 29
8.1.2 POLKA ... 29
8.1.3 Choice of Visualization Tool ... 29
8.2 First Iteration ... 30 8.2.1 Design ... 30 8.2.2 Implementation ... 30 8.2.3 Testing... 31 8.3 Second Iteration... 32 8.3.1 Design ... 33 8.3.2 Implementation ... 34 8.3.3 Testing... 36
9
Analysis...38
9.1 Factors Addressed ... 389.1.1 Structure of the Composite Event ... 38
9.1.2 Instances Used ... 38
9.1.3 Initiator and Terminator ... 39
9.1.4 Event Parameters ... 39
9.1.5 Focus ... 39
9.1.6 Animation ... 39
9.1.7 Colors... 40
9.2 Comparison With Other Visualization Tools... 40
10
Conclusion ...41
10.1 Results ... 41
10.2 Have all the Factors Been Addressed? ... 41
10.3 Is POLKA Suitable? ... 41
10.4 Contributions ... 42
10.5 Future Work... 42
References...45
1 Introduction
1 Introduction
Active database management systems (ADBMS) extend passive database management systems in the way that ADBMSs are capable of reacting to events in the database (Benazet et al. 1995). An ADBMS comes with languages, based on ECA rules (Event-Condition-Action), which make it possible to define events and also mechanisms that automatically capture these events and trigger associated actions. Events in active databases can be primitive or composite, although not all ADBMSs support the definition of composite events. A composite event is a combination of primitive or other composite events, together with operators. These operators are for example conjunction (AND) and disjunction (OR). Composite events always have at least one initiator, i.e. an event that starts the detection of the composite event, and one terminator, i.e. an event that finishes the detection of the composite event. It is not until the terminator has been detected that the composite event in its whole is detected. The introduction of composite events adds other mechanisms to the system, e.g. consumption modes, which are complex and can be hard to understand.
Berndtsson et al. (1999) have exposed a small number of students to the area of ECA rule semantics, and the feedback they have received is that the students find composite event detection and active rule semantics to be a complex domain to learn and understand, especially when it comes to mechanisms like consumption modes. Designers of potential active database applications face the same problem, especially when it comes to explaining the benefits of ECA rule semantics to their customers, since the customer is often not used to the low level semantics of ECA rules.
Visualization and animation have the potentials to be of assistance for students and others to understand composite event detection mechanisms and ECA rule semantics. Experiments have been conducted by, amongst others, Byrne et al. (1999) to examine whether visualization, and especially animation, can be useful as a student aid in the learning of complex algorithms. These experiments gave quite positive results. It is my belief that composite event detection and ECA rule semantics belong in the category of complex algorithms.
Amongst the advantages that visualization brings is that it exploits the ability of the human visual system to identify patterns in images (Edelson & Gordin 1997). Thus, students, and others, should be able to identify patterns in the composite event detection process if it was visualized, and thereby understand it more easily. With the help of animation, all the intermediate stages in the detection of a composite event can be shown explicitly step-by-step in different consumption modes. The learner can observe how the composite event is gradually detected by the detection of the component events, from the detection of the initiator event to the detection of the terminator event. The learner can thereby get a better understanding of how the composite event detection process takes place in different consumption modes.
In his final year project, Högberg (1998) identified several factors that play a central role in the visualization of composite events. In this final year project, a prototype of a visualization tool that visually displays the composite event detection is developed. This tool addresses some of the factors identified by Högberg (1998). The visualization tool uses time graphs to visually display the composite events and the chronicle consumption mode is used when detecting the composite events. The tool is then compared to other similar visualization tools that are used for visually displaying composite events. The tool developed in this final year project addresses some factors
2 Active Database Management Systems
2 Active Database Management Systems
ACT-NET (1996) defines the terms database management system, database, and database system as follows: A database management system (DBMS) is a software system for reliably and efficiently creating, maintaining, and operating large, integrated, multi-user databases. The data, including secondary information, is stored in the database. Finally, a database system (DBS) is a DBMS together with a concrete database (ACT-NET 1999: 2).
Traditional database systems are passive in their nature, i.e. they only allow manipulation of data on user requests. Active database systems are different from the passive database systems in the sense that they can act upon events and propagate the effects of manipulation actions (Benazet et al. 1995). Active database management systems (ADBMS) come with languages that are based on ECA rules (Event-Condition-Action). The semantics of ECA-rules is as follows: “when an event occurs, check the condition and if that condition holds, execute the action”. With these languages it is possible to define events and mechanisms that automatically capture these events and trigger associated actions. These languages and mechanisms are becoming more popular, because of their ability to describe complex problems such as integrity enforcement and corrective actions, derived data maintenance, and exceptions handling (Benazet et al. 1995).
ACT-NET (1996: 2) describes the process from rule definition to the execution of an action as follows:
1. A set of rules is defined.
2. The ADBMS monitors the relevant events.
3. When a relevant event is detected the ADBMS notifies the component that is responsible for executing any rules associated with that event.
4. All rules, which are defined to respond to this event, are triggered and must be executed. Rule execution includes evaluation of conditions and execution of actions, i.e. the condition is evaluated and if it is satisfied, the appropriate action is executed.
2.1 Events
An event indicates the point in time when some sort of reaction is required from the DBMS (Gatziu & Dittrich 1994). Events are specified in a set of ECA-rules. The set of rules defined at a given point in time forms the rule base, which is managed by the ADBMS (ACT-NET 1996). The constructs that are used for the specification of events are combined in an event specification language. The variety of the event specification language decides the expressiveness of the language, and the variety is crucial for the support of more sophisticated applications from various areas (Gatziu & Dittrich 1994).
Events can be either primitive or composite. Primitive event is immediately the specified event and are defined by Berndtsson et al. (1999) to be “an atomic and instantaneous predefined elementary occurrence in the system” (Berndtsson et al. 1999: 118). A composite event is a combination of primary events or composite events and operators. Not all ADBMSs support the definition of composite events.
2 Active Database Management Systems
2.1.1 Primitive Events
Possible primitive events, according to ACT-NET (1996), are method invocation, data item modification, transaction operation, abstract, and time events.
• Method invocation events are generated when methods (procedures), specified in the database, are executed.
• Data item modification events are generated when the traditional database operations (e.g. insert, delete, update) are executed.
• Transaction operation events are generated by transaction operations, such as commit and abort.
• Abstract events are generated by the application program.
• Time events are events that are defined to be invoked at some point in time. Time events can be defined to be invoked at some specific point in time, or to be invoked a specific time period after another event has occurred.
2.1.2 Composite Events
First of all, a detector for primitive events is required in order to support the detection of composite events. In addition, every time a primitive event is detected, the composite event detector has to check which composite events occur as a consequence. In ACT-NET (1996) it is stated that composite events are necessary in order to control and monitor complex sequences of situations in the DBS-environment.
As mentioned earlier, a composite event is a combination of primitive or composite events together with operators. These operators - also called event constructors (Gatziu & Dittrich 1994) - can be e.g. disjunction, conjunction, sequence, negation, etc.
• Disjunction of events E1 and E2, denoted (E1|E2), occurs whenever either E1
or E2 occurs. The composite event occurs when one or both of the component
events occur.
• Conjunction of events E1 and E2, denoted (E1, E2), occurs when both E1 and E2 have occurred. The order in which the events occur does not matter. The
composite event occurs when the second component event occurs.
• Sequence of events E1 and E2, denoted (E1; E2), is similar to conjunction,
except that it requires that events E1 and E2 occur in that order, i.e. event E2
occurs after event E1 has occurred. The composite event occurs when the last
component event occurs.
• Negation of event E, denoted (NOT E IN I), occurs if E did not occur in the time interval I. Negation of event requires the explicit definition of a time interval.
The first event instance of a composite event to be detected is called the initiator of the composite event, and the last event instance of a composite event to be detected is called the terminator, i.e. the initiator starts the detection of a composite event, and the terminator finishes the detection. After the terminator event has been detected, the composite event is detected. Not all constituents of a composite event can be initiators
2 Active Database Management Systems
or terminators. Let us take the composite event C as an example. Event C is composed of events E1 and E2. If events E1 and E2 are combined with the disjunction operator
(E1|E2), then either event E1 or E2 can be initiator and terminator, depending on which
event is first detected. The event that is detected is both the initiator and terminator of the composite event C. If the two constituents of C (E1 and E2) were combined with
the conjunction operator (E1, E2) this would be a little different. Before either event
has been detected, both E1 and E2 can be initiators or terminators to event C, but when
either of the events has been detected, that event can no longer be a terminator to event C. The event that has not yet been detected is no longer able to be an initiator to event C. Finally, if the two constituents of composite event C were bound together with the sequence operator (E1; E2), only event E1 can be an initiator to event C, and
only event E2 can be a terminator to event C. In the case of primary events, that single
event is both the initiator and the terminator.
Composite events, where the initiator event has been raised but not the terminator event, are said to be partially completed.
2.1.3 Event Parameters
All instances of events have a number of parameters associated with them. The number can vary, but instances of primitive events have at least two parameters connected with them: event type and event ID (Högberg 1998). The event type is a unique value that identifies an event, and event ID is the point of time when the event occurred (timestamp). Other parameters can be associated with event instances, e.g. the name of the user that started the transaction and, in the case of a method event, the parameters of the method.
With composite events, the event parameters depend on the type of event constructor. A disjunction has the parameters of the event that invoked the composite event. In the case of a conjunction or a sequence, the composite event has the union of parameters of the component events. Negation of event does not have event parameters.
2.2 Event
Detection
The ADBS monitors the events that have been defined, i.e. the relevant events. When the system detects the occurrence of an event, the component responsible for the execution of the rule execution is notified. All rules that are defined to respond to this event are triggered and have to be executed. Rule execution involves condition evaluation and action execution. If the condition is satisfied, the associated action is executed by the ADBMS.
The event monitoring mechanism supporting event detection is a very important part of any system that supports ECA-rules (Berndtsson et al. 1999). The reason for this is that the mechanism allows the specification of when a rule should be evaluated.
2.2.1 Event History
The event history consists of all occurrences of the defined events, including components of composite events (ACT-NET 1996). The event history begins when the first event is detected and is ordered by the timestamps of the event instances.
2 Active Database Management Systems
Because the event history may last over many sessions and transactions, a persistent event history is required if the signaling of a composite event, based on events that have occurred during different application sessions or transactions, should be possible.
Resources such as memory and processor time are not unlimited and therefore can event history not be maintained indefinitely, and hence must be pruned (Berndtsson et al. 1999). Minimally, the event history contains only occurrences that can still be used for event composition (ACT-NET 1996).
2.2.2 Consumption Modes
Event consumption is used to decide which component events from the event history are considered for a composite event, and how event parameters of the composite event are computed from its components (ACT-NET 1996). The different consumption modes are: recent, chronicle, continuous, and cumulative (Chakravarthy & Mishra 1991, cited by ACT-NET 1996: 44).
• Recent: Only the newest instance of initiator event E is used in the composite event. For example, if event E1 is the initiator of the composite event C and a
new instance of event E1 is detected, then the older instance is overwritten by
the newer instance. When the composite event has been detected, all constituents of that event, that cannot be future initiators, are flushed from the event history. This consumption mode is useful, e.g. in systems where there is a high rate of sensor readings and it is all right if some readings are lost.
• Chronicle: With this consumption mode, the initiator and the terminator are unique. In other words, the oldest initiator and the oldest terminator are paired together to form the composite event. When the composite event has been detected, all constituents of the composite event are flushed from the event history. This consumption mode is used when there is a connection between events that has to be maintained.
• Continuous: With this consumption mode, each initiator of a composite event starts the detection of that composite event. The terminator can then terminate one or more composite events, i.e. the terminator terminates those composite events where all the constituents have been detected (except for the terminator). This means that each initiator starts the detection of the composite events it is an initiator to, i.e. each initiator is used at least once for initiating the detection of a composite event. The continuous consumption mode is different from the recent and chronicle consumption modes in the way that with recent and chronicle one initiator is paired with one terminator, but with the continuous consumption mode, one terminator can be paired with one or many initiators. According to Mellin (1996) the major problem with this consumption mode is that it produces combinations of events where some or all events are of interest. This adds more overhead to the system and requires more storage.
• Cumulative: From the time the initiator of a composite event is detected, all event instances that can be constituents of that composite event are collected until the time the terminator is detected. When the terminator has been detected, i.e. the composite event is detected, all the event instances that make
2 Active Database Management Systems
2.2.3 Time Graphs
Time graphs can be used to visualize composite events and consumption modes. Time graphs have the following notation and semantics:
• A timeline, which represents the event history. Each instance of an event is marked on the time line in order of occurrence.
• One or more time intervals, over which the composite events are detected. Each interval represents the detection of a composite event for a given consumption mode. The interval includes one initiator, one terminator, and zero or more events participating in the composite event.
The instance of an event Ex will be denoted as exy, where x is the event type and y is
the relative occurrence of event x. In other words, e12 is the second occurrence of
event E1.
To show what time graphs look like, and how the different consumption modes work, the following example will be used. This example is taken from Berndtsson et al. (1999). The example includes three primitive events, E1, E2, and E3, and event history H. The event history has the following event instances:
H = {{e11}, {e12}, {e12}, {e13}, {e22}, {e14}, {e32}, {e24}}
There are two composite events used: E5 and E6. Event E5 is defined as a conjunction
of E1 and E2 (E5 = (E1, E2)). Event E6 is defined as a sequence of E5 and E3,
(E6 = (E5; E3) = ((E1, E2); E3)).
Figure 1. Composite event E6 visualized using time graphs. (Reproduced, with permission, from Berndtsson et al. (1999: 122))
2 Active Database Management Systems
Figure 1 shows how the composite event E6 is visualized in different consumption
modes using time graphs. At the top there is a timeline where all the event instances that are detected are shown in the order they were detected. If an event instance is used in a composite event, a new event instance symbol (a rectangle) is created. This symbol is placed directly below the event instance on the timeline. The event instance rectangle is unfilled (white) if the event instance is an initiator to the composite event, black if the event instance is a terminator to the composite event, and gray if the event is just a participating event in the composite event. In Figure 1, the composite event
E6 is visualized in the four different consumption modes. As can be seen in Figure 1,
two instances of the composite event E6 are detected when the recent, chronicle, and continuous consumption modes are used, but only one instance is detected when the cumulative consumption mode is used.
Time graphs explicitly show the difference between initiator, terminator, and other participating events in the detection of the composite event by using different colors. On the other hand, time graphs do not contain information about the structure of the composite event, e.g. the event operators.
2.2.4 Event Graphs
Using event graphs is another way of visualizing composite events and consumption modes in an active database. The semantics of an event graph is as follows:
• A timeline, which represents the event history. Each instance of an event is marked on the timeline in order of occurrence.
• One or more nodes. Each node represents an event operator. • Leaves. Each leave represents a primitive event.
• Arcs. Each arc represents a connection between a node and its two children (leaves or nodes).
To show what event graphs look like, the same example as the one used to show what time graphs look like will be used, i.e. primitive events E1, E2, and E3, composite
events E5 and E6, and event history H.
Figure 2 shows the detection of the composite event E6 visualized using event graphs.
At the top there is a timeline where all the event instances that are detected are shown in the order they were detected. When a composite event is detected, a new node is created (appears as a circle in the event graph). On each side of the node are the event instances that are used in the composite event, and inside the node is the operator that is used. Arcs connect the node to its two children.
2 Active Database Management Systems
Figure 2. Composite event E6 visualized using event graphs. (Reproduced, with permission, from Berndtsson et al. (1999: 123))
With event graphs it is possible to see the operators of the composite event. This is not the case with time graphs. On the other hand, event graphs do not explicitly show the initiator and the terminator of the composite event.
3 Visualization
3 Visualization
The aim of scientific visualization is to communicate information about data. Scientific visualization technologies offer great promise for education because of the way they use visual representations to facilitate exploration of complex data (Edelson & Gordin 1997). Edelson and Gordin (1997) state that scientific visualization has had an enormous impact on many fields of science because of how it exploits the ability of the human visual system to identify patterns in images.
According to Edelson and Gordin (1997), scientific visualization can help students overcome one of the traditional obstacles for students working with data, i.e. difficulty of working with numerical representations and understanding mathematical operations. This is because the visual representation simplifies the process of finding patterns in data and can provide visual operations to replace or supplement arithmetic ones. Despite this, Edelson and Gordin (1997) identify a potential difficulty because the visualization tools that scientists use are far too complex for students to use. This should, however, not be a problem in this work. This is because Edelson and Gordin (1997) are referring to high school students with little or no background knowledge in the field where the tools are used, while this project is aimed at university students that should have enough background knowledge to use this kind of tool.
Al-Kodmany (1999) describes how visualization was successfully used to enhance public participation in planning and design of an urban neighborhood. In the paper it is described how important it is to get the residents to be active in the planning and the design of their neighborhood because it increases the satisfaction of the residents. It creates realistic expectations of outcomes, and builds trust. But it is difficult for the average person to express their opinions and ideas to the designers and to their fellow residents without being misunderstood, and people may build different images in their minds of how they picture the neighborhood.
A series of design workshops were arranged for the planning team. The planning team included 25 residents of the neighborhood, two architects, two planners, and one artist. In the first workshop a Geographic Information System (GIS) and an artist using an electronic sketch board were used together. In the later workshops the computer imaging technique was used alone. Al-Kodmany (1999) states that these visualization tools greatly enhanced the planning process because they allowed participants to directly participate in the design of their neighborhood.
Even though the design that Al-Kodmany (1999) describes in his paper is the design of a neighborhood, this can be related to software design, i.e. visualization can be used to get people, e.g. potential users or potential buyers, to be active in the design.
4 Animation
4 Animation
The Oxford Encyclopedic English Dictionary defines animation as “the technique of filming successive drawings or positions of puppets to create an illusion of movement when the film is shown as a sequence” (The Oxford Encyclopedic English Dictionary 1991: 52). The Oxford dictionary also defines animation as the state of being alive. In other words, we can say that animation is the art of giving still images life.
Mealing (1992) points out that some phenomena in the world are only visible when they are moving. As an example, Mealing (1992) takes a square of dots seen against a field of dots, where the square is invisible until it moves. This shows how much information could be hiding in a stack of data and how animation could be helpful for extracting it (Mealing 1992).
Byrne et al. (1999) describe experiments they conducted to examine whether animations of computer algorithms would help students learn the algorithms more effectively. In the first experiment they used the depth-first search algorithm to test their subjects and in the second experiment they used binomial heaps. In the first experiment they used students with little or no computer science background, but in the second experiment they used students who were computer science majors.
Understanding, according to Byrne et al. (1999), includes a learner’s ability to predict algorithm performance on novel problems, amongst other things required for understanding. Byrne et al. (1999) state that prior research in this field has hypothesized that animations and simulations help learners to build mental models of processes, and such models help learners to reconstruct, run, and simulate the process. In earlier experiments, Byrne et al. (1999) noticed that students often would make predictions about the next step in the algorithm when shown an animation of the algorithm at work. Also, according to Byrne et al. (1999), prior research has suggested that one of the benefits of acquiring a mental model for a system or process is that learners are better able to make predictions about the behavior of the system. But, as Byrne et al. (1999) point out, this can be turned on its head, i.e., if learners are explicitly led to make predictions about the animation during training, this might help the development of a mental model of the algorithm. Learners can certainly make predictions from static images of an algorithm, but the advantage of animation is that it encourages the learner to spontaneously make predictions without being prompted and also provides a rapid feedback about the accuracy of the prediction (Byrne et al. 1999). If the benefit of seeing an animation is that it leads a learner to make predictions, then learners who see an animation, or learners who see static images but make predictions based on those images, might be more likely to build mental models that aid them when they answer post-test questions about the algorithm (Byrne et al. 1999).
The students involved in the experiments were divided in four groups. One group was shown an animation of the algorithms, and was asked explicitly to make predictions about the algorithms. Another group was shown an animation of the algorithms, but was not asked explicitly to make predictions. The third group was only shown static images of the algorithm and was explicitly asked to make predictions about the algorithm. The final group was shown static images of the algorithm, but was not explicitly asked to make any predictions. All of the students were shown a short, videotaped lecture teaching the algorithms and given a short written description of the algorithms. After this the students were examined using a post-test.
4 Animation
Those students that were in the no animation/prediction group were given two graphs on paper and asked to predict the order in which the vertices would be visited. If the student made an error on any prediction, the experimenter immediately corrected the error. The students in the animation/prediction group made predictions using the animation. After a vertex was visited, the animation was halted and the participant asked to state which vertex they thought would be visited next. The correct answer was then displayed by the animation.
In the first experiment, i.e. the depth-first search algorithm, there was no significant difference between the group that was shown the animation and the group that didn’t see the animation, although the small difference favored the ones that were shown the animation. Byrne et al. (1999) suggest that one of the reasons for this small difference is that the algorithm may have been too simple, limiting the amount of assistance that could be provided by the animation. Questions on the post-test were divided into two categories: Basic and Challenging. Basic questions required the student to determine a single next step of a search or required determination of a complete search on a graph similar to an example the students had already seen. Challenging questions involved complete searches of novel graphs. The results from the first experiment are shown in Table 1, which is an adaptation from Byrne et al. (1999).
Score on Score on
Group "basic" questions "challenging" questions
Animation/prediction 95% 82%
Animation/no prediction 93% 75%
No animation/prediction 95% 75%
No animation/no prediction 95% 64%
Table 1. Results from post-test (experiment 1). (Adaptation of tables in Byrne et al.
(1999))
The second experiment, i.e. binomial heaps, provided some evidence for benefits of animation, but this evidence was weakened by generally high variability in performance. Byrne et al. (1999) suggest that the animation was only useful to those students who already had some above-threshold understanding of the algorithm by the time they reached the animation phase of the experiment, and the animation may simply not have been comprehensible to those students who were still struggling with the basics of the algorithm. It is not clear if viewing the animation provides any benefit if the student has not acquired some fundamentals (Byrne et al. 1999). Questions on the post-test were of two types. One was supposed to measure the student’s procedural understanding, and the second to measure the conceptual understanding. Procedural questions relate to the methodological, step-by-step operations of the algorithm on different input data sets (Byrne et al. 1999). Conceptual questions are declarative, fact-based questions that typically involve properties of an algorithm (Byrne et al. 1999). The results from the second experiment are shown in Table 2, which is an adaptation from Byrne et al. (1999).
4 Animation
Score on Score on
Group procedural questions conceptual questions
Animation/prediction 73% 58%
Animation/no prediction 71% 64%
No animation/prediction 71% 64%
No animation/no prediction 57% 58%
Table 2. Results from post-test (experiment 2). (Adaptation of tables in Byrne et al.
(1999))
Byrne et al. (1999) mention several other similar experiments that have been conducted. All of these experiments have provided mixed results. Some favor the animation group, but others favor the non-animation group.
5 Related Work
5 Related Work
Some prototypes have been built that visually display the composite event detection and there has been some research in this field. Some of these prototypes and research will be described in this section.
5.1 Central Factors When Visualizing Composite Events
In his final year project, Högberg (1998) investigated how visualization of composite event detection could be done, and identified factors that have a central role in such visualization. The factors that Högberg (1998) identified as playing a central role in such visualization of composite event detection are:
• Structure of the composite event. The structure of the composite event, i.e. event operators should be shown.
• Instances used. When a composite event is detected, not all event instances from the event history are used. What instances are used depends on what consumption mode is used and the structure of the composite event. To be able to tell what consumption mode is being used, it is important to show what instances are used for the detection of the composite event.
• Initiator and terminator. To show how a composite event is detected, it is relevant to show what event is the initiator of the composite event and what event is the terminator.
• Event parameters. The event parameters of the participating events are of interest to show, because they constitute the parameters of the composite event. Further, event parameters can be used when evaluating conditions and executing actions and therefore affect how rules are executed. Thus, visualizing event parameters is useful for debugging purposes (Berndtsson et al. 1999).
Other factors of interest identified by Högberg (1998) are:
• Focus. As the event history tends to be very large, it can be useful to be able to select which events are to be visualized.
• Animation. Animation can be used to show how each instance of a primitive event is detected and how the composite event is later detected.
• Colors. Colors can be used, e.g. to identify which component events in the composite event have been detected.
In his study, Högberg (1998) presented a proposal for a user interface of a visualization tool. In his proposal, Högberg (1998) uses both event graphs and time graphs to visualize the composite event detection. In addition, Högberg (1998) has suggested that the visualization tool also should have a history window showing the event instances that have been detected and their parameters. A refined version of the proposal can be found in Berndtsson et al. (1999).
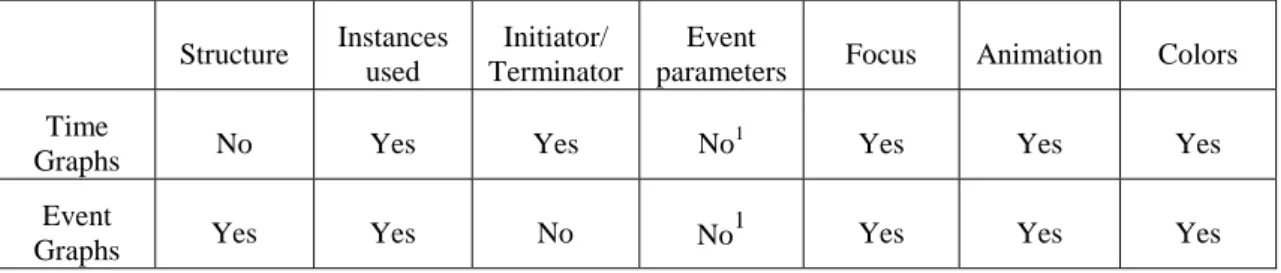
Event graphs and time graphs each address some of the identified factors. Table 3 shows which of the identified factors are supported by time graphs and event graphs respectively.
5 Related Work Structure Instances used Initiator/ Terminator Event
parameters Focus Animation Colors Time
Graphs No Yes Yes No
1 Yes Yes Yes
Event
Graphs Yes Yes No No
1
Yes Yes Yes
Table 3. Support for factors
From Table 3 we can see that if composite events are visualized by both time graphs and event graphs, together with a view that displays the event parameters, there is support for all the factors that have been identified by Högberg (1998) as being of importance when visualizing composite events.
5.2 ADELA
ADELA (Animated Debugging and ExpLanation of Active database rules) is a tool for visualization of rules in an active relational database, created by Fors (1994a). The objective of the development of ADELA was to design and implement a rule debugger (Fors 1994b). The main objective of ADELA is to visualize rules and rule firings in a data model context.
Due to time limits, it was not an objective of the ADELA project to make the prototype easy to understand and work with. Composite events are not considered in ADELA, only rules that represent behavior concerned with whole objects, and the only events considered are update, delete, insert, and retrieve (Fors 1994b). Only a small data model was assumed, i.e. the problem of showing large amounts of data so it can be easily comprehended was ignored.
Figure 3 (event/rule trace view) shows how event detection and rule execution is visualized in ADELA. When an event is detected, an event node appears in the event/rule trace view. Rules that are executed as a consequence of the event’s detection are connected to their triggering event by an arc. Rules triggered by an event form a conflict set.
Figure 3. Event/rule trace view. (Adapted from Fors (1994b: 17)
Rule 6 Event 3
Rule 5 Rule 4
Rule 1 Event 2 Rule 2
Rule 3 Event 1
5 Related Work
Event nodes are shown as squares in ADELA (see Figure 3). When the square is black, no rules in the branch originating from the event are being executed. The square is colored gray when there are rules executing in the branch originating from the event. Rules are shown as ellipses with three circles within them. If all the circles are black, the rule is not executing. When the rule has just been selected for execution, the leftmost circle turns gray, and the other two circles remain black. If the condition for the rule has been evaluated as true, the rightmost circle turns gray, and the other two circles are colored black. When the action of the rule is being processed, all the circles are gray.
Figure 4. Data trace view. (Adapted from Fors (1994b: 18))
Figure 4 (data trace view) shows what is happening to data instances when they are manipulated by rules. When a rule has been selected from a conflict set, it appears in the top part of the data trace view. When the rule is being processed, the object types that are affected are shown above the rule and are connected to the rule by an arc. When an operation (insert, delete, etc.) is executed, an instance symbol appears. This instance symbol changes it’s color to black, if it is to be deleted, or gray, if it is to be updated. The instance symbol then moves to the appropriate slot to the right of the data trace view (deleted, updated, inserted, or retrieved). When the processing of the rule has finished, everything disappears from the data trace view.
As mentioned earlier, composite events are not visualized in ADELA, but Fors (1994b) states that composite events could easily be incorporated into ADELA. As a suggestion for future work on ADELA, Fors (1994a) suggested that visualization of composite events should be added in the system.
Rule Database action Object type affected by the rule’s execution
Deleted Updated Inserted Retrieved Object affected Rule executed Object affected Rule executed Object affected Rule executed
5 Related Work
A concept called the multilevel rule concept was introduced by Fors (1994a) to answer questions such as:
• What role do rules play in the data model?
• How are instances of rules, events, and data related?
Fors (1994b) states that questions like these need to be answered by a rule visualization tool. The multilevel rule concept has three basic levels: model level, rule
level, and instance level. These levels reflect different aspects of rule behavior.
Following is a brief description of each of the levels.
• Model Level. In the model level, rules are set into a data model context, i.e. it represents how rules are related to data models (e.g. ER-diagrams) and dynamic models (e.g. state diagrams). This makes it possible to see how rules are related to both the static structure and dynamic behavior of an information system.
• Rule Level. This level contains a representation of the rules themselves. According to Fors (1994b), rules can be viewed from (at least) three different angles: ECA level, atomic rule level, and constraint level.
ECA level - According to Fors (1994b), a rule-debugging environment must,
minimally, show what caused a rule to fire and that is exactly what the ECA level is concerned with.
Atomic rule level - It is desirable to regard the whole rule as an abstraction, i.e.
as a single unit. At this level the event, the condition, and the action parts of the rule are shown as a single atomic unit.
Constraint level - Often several rules are needed to express a constraint.
Therefore it is desirable to be able to view these rules in a higher form of abstraction, i.e. as a constraint or business rule. This level, i.e. the constraint level, is called aggregate rule level in Berndtsson et al. (1999).
• Instance Level. Because one rule can be triggered several times in one transaction, it is needed to separate these different rule instances from each other. This level keeps track of the actual rule executions, together with the event parameters, state of the database before the rule execution, and actual event detection (including composite event detection).
5.3 Vizar
Vizar (visualization of active rules) is a visualization tool for active database systems, which uses 3D graphics for visualizing active rule executions (Coupaye et al. 1997). According to Coupaye et al. (1997), the use of 3D graphics increases the density of information displayed on the screen and avoids cluttering that makes representations visually confusing when too much information has to be visualized. Vizar allows navigation through the visual representation and the user can focus on a local area of interest by moving closer without loosing contextual information. Vizar is also able to give the user a global view of the information space, which is useful when there is a high density of information.
Vizar does visualize composite events and the participating events of the composite events are shown, but event operators are not explicitly shown in the visualization, nor are initiators and terminators of composite events explicitly shown. To some
5 Related Work
visually represent time varying data. Colors are used in Vizar, e.g. to identify in what state a rule is.
Figure 5. Dynamic information about events. (Adapted from Coupaye et al. (1997: 41))
Figure 5 shows how composite events are visualized in Vizar. A primitive event is shown as a circle, while a composite event is shown as a rectangle. An arc connects a primitive event to a composite event. When a primitive event is detected, it changes its color to indicate this. When a composite event has been detected, a ‘flag’ appears at the top of the composite event.
5.4 DEAR
DEAR is a debugging tool for active rules in an object-oriented context, and was implemented on the EXACT rule manager of the object-oriented DBMS ADAM (Diaz et al. 1993). EXACT supports ECA rules, and there is support for composite events, although only for the conjunction and disjunction operators (Diaz et al. 1993). DEAR was built using EDEN, which is a user interface toolkit that has been fully integrated with ADAM (Diaz et al. 1993). This means that DEAR can only be used with ADAM.
According to Diaz et al. (1993), a rule debugger should at least provide three kinds of mechanisms which:
• Make explicit the context in which the active rule is fired. • Focus the search during the debugging process.
• Automatically detect inconsistencies and potentially conflicting interactions among rules.
DEAR keeps track of both rules and events. According to Diaz et al. (1993) this is important because it enables the user to not just see which rules are fired, but also what caused the rules to be fired. An example on how this is visualized can bee seen in Figure 6.
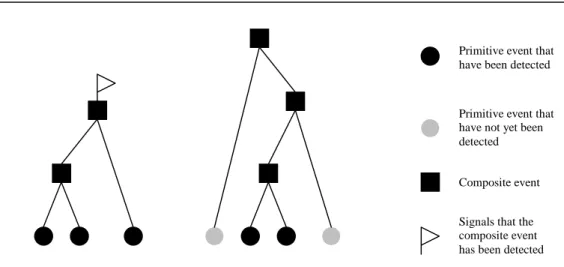
Primitive event that have been detected
Primitive event that have not yet been detected
Composite event
Signals that the composite event has been detected
5 Related Work
Figure 6. An interwined event-rule cycle. (Adapted from Diaz et al. (1993: 185))
The first node of the tree, i.e. the root, is artificially created and its direct descendants are the first events to be raised. The nodes can be either rules or events, where event nodes alternate with rule nodes. An arc from an event node to a rule node means that the event triggered the rule. An arc from a rule node to an event node means that the rule produced the event.
DEAR provides two ways of pruning the debugger tree:
• Debugging can be restricted to certain rules and events using the spy_rule and
spy_event facilities. The tree will then only show those rule nodes and event
nodes that are specified by the spy points.
• The designer can trace when some situations change, rather than by following certain events and rules.
The downside of DEAR is that it is not a general visualization tool, i.e. it can only be used with the ADAM DBMS. Also, to the best of my knowledge, DEAR does not visualize composite events.
5.5 VITAL
VITAL is a toolbox for active rule analysis (Benazet et al. 1995). VITAL includes four sets of specialized tools:
• Tools for the static analysis of active rules, which allow the user to study the static rule set behavior.
• A tool for rule simulation. This tool includes an event generator, a breakpoint manager, a trace manager, and a statistics manager.
• A database simulator with DB-operators (insert, delete, update), DB-instances-generator, and DB-browser.
• A tool to evaluate rules. This tool includes an event captor, conditions evaluator, rules selector, rules enabler and disabler, and an action evaluator. Together, these tools allow the complete management of rules, including event catching and testing, condition validation, action execution (Benazet et al. 1995). These tools can be used independently of each other, or integrated in a global methodology for specification and validation (Benazet et al. 1995).
root event
event rule
rule
5 Related Work
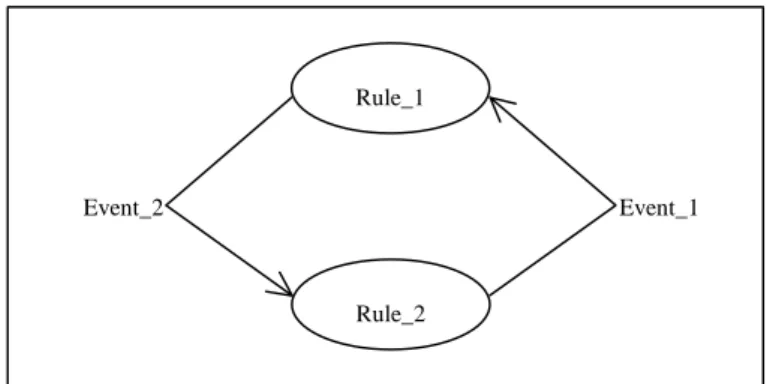
VITAL is not based on any particular database management system. VITAL is a relational, set-oriented rule simulator including an animated graphical interface. VITAL shows rule activation and also the effects that rule execution has on the data. Figure 7 (activation graph) shows the potential cycle between the rules Rule_1 and
Rule_2.
Figure 7. Activation graph. (Adapted from Benazet et al. (1995: 194))
A browse window (not shown here) shows tuples of relations, which have previously been declared for automatic browsing. The information shown in the browse window is: the name of the executed rule, the operation that is being done on the database, and its results. A debug window (not shown here) shows how VITAL allows simulation control and how it displays abstracted results. During rule execution, the raised event and the rule, which raises it, are shown (Benazet et al. 1995). The information in the browse window and the information in the debug window is connected by step numbers.
To the best of my knowledge, VITAL does not support visualization of composite events.
5.6 Sentinel
Sentinel is an active object-oriented database. A rule visualization and debugger module has been designed and implemented to provide feedback about event detection and rule execution in Sentinel (Chakravarthy et al. 1995).
The visualization tool does not support visualization and debugging at runtime, but uses log-files to visualize the behavior of the database. The input to the visualization tool is in the form of two files. One file, which is generated by the preprocessor of Sentinel, provides static information in terms of the definition of events and rules. The second file, which is generated at runtime, provides information regarding event occurrences and rule execution. The visualization tool creates two tree-like data structures for events and transactions. In the event tree, primitive events are leaf nodes and composite events are seen as parent nodes of their components. The transaction tree grows in a top-down manner, i.e. it starts from the top-level transaction and spans to the descendants.
This visualization tool supports the visualization of composite events. It also shows the event operators of the composite events, and the participating events of the composite event.
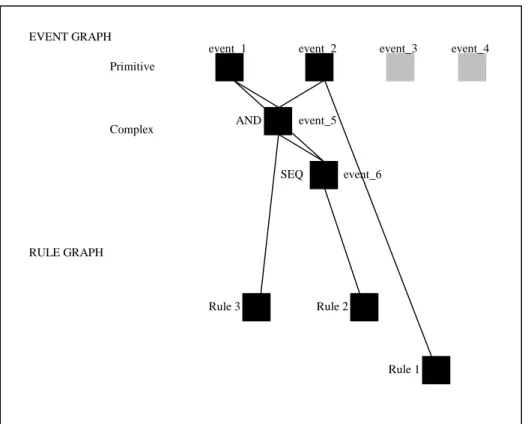
Figure 8 shows what the display of the visualization tool looks like before any event
Rule_1
Rule_2
Event_1 Event_2
5 Related Work
events, while event_5 and event_6 are composite events, where event_5 is a combination of event_1 and event_2 together with the conjunction operator, and
event_6 is a combination of event_1 and event_5 together with the sequential
operator.
Figure 8. Starting display of the visualization tool. (Adapted from Chakravarthy et al.
(1995: 206))
Figure 9 shows the display of the visualization tool after rule execution finishes. The events that have been raised have changed color. Rules that are executed as a consequence of event being detected can now be seen. The rules are connected with arcs to the event that caused their execution.
Figure 9. Display of the visualization tool after the rule execution finishes. (Adapted
from Chakravarthy et al. (1995: 208))
The visualization tool uses colors to show the difference between events that have been raised, and events that have not. The components of composite events are shown, and so are the operators. To the best of my knowledge, initiators and terminators of composite events are not explicitly shown, nor are event parameters. This visualization tool is built for Sentinel and can only be used with that database system.
event_1 event_2 event_3 event_4
event_5 event_6 AND SEQ Primitive Complex
event_1 event_2 event_3 event_4
event_5 event_6 AND SEQ Primitive Complex EVENT GRAPH RULE GRAPH Rule 2 Rule 1 Rule 3
6 Problem Description
6 Problem Description
6.1 Problem
It has been identified by Berndtsson et al. (1999) that many people, e.g. students, designers of potential active database applications, and customers, find ECA rule semantics and composite event detection a difficult area to understand, especially when it comes to complex mechanisms such as consumption modes. This may cause developers to choose a passive database system, where they have to implement the behavior into all applications that use the database, instead of choosing an active database system, where they can implement both data and behavior.
6.2 Proposal for a Solution
A suggestion, proposed by Berndtsson et al. (1999), of what is needed to address the problem, described in chapter 6.1, is a general visualization tool or visualization technique for active rule semantics, which can present ECA rules at different levels of abstraction. Following is a brief description of some of the advantages that visualization and animation can bring:
Visualization – Scientific visualization exploits the ability of the human visual system
to identify patterns in images (Edelson & Gordin 1997). Thus, if the composite event detection process is visualized, students and others should be able to identify patterns in the composite event detection process and therefore it should be easier for them to understand it. Further, according to Edelson and Gordin (1997), visual representation simplifies the process of finding patterns in data and can provide visual operations, which can help students working with data to overcome the obstacle of working with numerical representations and understanding mathematical operations.
Animation – It is my belief that animation has the potentials to be of a great support
when learning and understanding the semantics of ECA rules and composite event detection. This is based on the results from experiments conducted by Byrne et al. (1999), described in chapter 4 of this report, where they examine whether animation helps in learning complex algorithms. The results from these experiments were quite encouraging, which indicates that animation can serve as an aid in the learning process of complex algorithms. It is my belief that composite event detection and ECA rule semantics fall into the category of complex algorithms. Hence, it can be assumed that animation should be helpful, for students and others, in the learning process of composite event detection and ECA rule semantics. Animation can be used to explicitly show each intermediated stage in the detection of a composite event, from the detection of the initiator to the detection of the terminator. The learner can observe, step-by-step, how the composite event gradually builds up by the detection of the participating events until the terminator is detected and the composite event is raised, and by that, gets a better understanding of the composite event detection process and different consumption modes.
To the best of my knowledge, none of the visualization tools that are presented in chapter 5 addresses all the factors identified by Högberg (1998) as playing a central role in the visualization of composite event detection.
6 Problem Description
6.3 Problem
Definition
The aim of this final year project is to build a prototype of a tool that visually displays, using animation, composite event detection in an active database, and addresses the factors identified by Högberg (1998) as necessary when visualizing composite events.
6.4 Restrictions
In my work I will only consider the chronicle consumption mode. The reasons why the chronicle consumption mode was chosen is that according to ACT-NET (1996), if composite event detection is implemented in an ADBMS, consumption modes must also be implemented, minimally the chronicle consumption mode.
Further, I will not consider the visualization of event parameters in my work. This is mainly because of the time restrictions of this project.
6.5 Expected
Results
Expected result from this project is a prototype of a tool that visually shows the detection of composite events in an active database. This visualization tool should use animation to enable the user to observe the composite event detection process step-by-step. This tool should address as many factors as possible of those identified by Högberg (1998) as playing a central role in the visualization of composite event detection. Further, the architecture of the visualization tool should support further development so that any factors remaining to be addressed can be addressed, by incorporating new devices or new components into the system.
7 Method
7 Method
In this chapter I will present two alternative approaches for the development of the visualization tool. After that I will present my choice of approach and motivate that decision.
7.1 Alternative
Approaches
The software models that are presented in this chapter have the same phases, i.e. they both have analysis, specification, design, implementation, testing, and operation phases. Analysis and specification have been previously performed by Högberg (1998) and Berndtsson et al. (1999). Högberg (1998) has done this by analyzing this area and identifying factors that are of importance when visually displaying the composite event detection process, and Berndtsson et al. (1999) by further developing Högberg’s study.
7.1.1 Traditional Software Model
Jones (1990) and Ghezzi et al. (1991) call the waterfall model as the traditional software model and that name will be used in this report. According to Pressman (1997), the traditional model is the oldest and the most widely used paradigm for software engineering. With the traditional model the software moves in an orderly, predetermined way through each stage of its life (Jones 1990). According to Jones (1990), the traditional waterfall model provides a very strong framework for the development of large projects. But it has a number of weaknesses, such as: it does not support parallel activities well; it delays any actual experience with the software until very late in the process; the developers are under a heavy load of documentation preparation; it does not support reuse well; it does not maintain user involvement throughout the process; and it does not support the developers need to produce concrete results quickly (Jones 1990: 20). Pressman (1997) points out additional weaknesses of the traditional model: real projects rarely follow the sequential flow that the model proposes; the traditional model has difficulty in adjusting to the natural uncertainty that is partly caused by the difficulty for the customer to explicitly state all requirements in the beginning of the project, as the traditional model requires; the customer must have patience as a working version of the program(s) will not be available until very late in the project time-span; a major mistake can be disastrous, if it is not detected until the working program is reviewed (Pressman 1997: 35). Despite all these problems, the traditional model has an important place in software engineering as it provides a template into which methods for analysis, design, coding, testing, and maintenance can be placed, and remains as the most widely used process model for software engineering (Pressman 1997).
Figure 10 shows the traditional model as Jones (1990) describes it. Each phase in the process is only visited once as the project moves towards its goal, operation. Next phase in the process is not started until the preceding phase is completed.
7 Method
Figure 10. The traditional (waterfall) software model. (Adapted from Jones (1990: 20))
As mentioned earlier, analysis and specification has already been performed, so the stages that are left to perform are: design, implementation, and testing. Pressman (1997) describes design as multi step process that focuses on four distinct attributes of a program: data structure, software architecture, interface representations, and procedural (algorithmic) detail (Pressman 1997: 34). If the traditional software model would be used in this project, all these attributes would have to be addressed. The stages in the development of the visualization tool would be the following:
• Choosing a visualization aid. As the constructs available in programming languages can be rather hard to use for visualization of data, the use of visualization aids is preferable and especially for the creation of animations. • Designing the architecture. This would include designing all the components
of the visualization tool, how they are connected and how they interact with each other.
• Designing the data structure. This would include designing the structure of the data that is passed between the different components of the system. For example what data is sent between the event detection components and the visualization components.
• Designing the user interface, i.e. what is seen by the user and how the user should interact with the visualization tool.
• Algorithmic detail. This would include designing the composite event detection mechanism and the animation algorithms.
• Implementation. This phase would include implementing all the components of the system.
• Testing. This would include testing the visualization tool for any bugs and testing it on eventual users.
Analysis Specification Design Implementation Testing Operation
7 Method
7.1.2 Rapid Prototyping
Prototyping works best in individual or small team projects, working with an interpretive language (Russon 1988, cited by Jones 1990). According to Jones (1990), with rapid prototyping a quick-and-dirty preliminary version of the software is developed, and often constructed using parts from other products. There is no effort spent on trying to make the software dependable, accurate, or efficient. Prototypes can be used to investigate the suitability of a major design decision and enable that the concentration be put on the essentials of design without thinking too much about the full complexity of a complete product (Jones 1990). Rapid prototyping is often proposed as a solution to many of the problems that arise from an unthinking selection of the traditional process model (Jones 1990). According to Jones (1990), rapid prototyping is extremely useful in situations where there is much uncertainty. Where there is a problem that is not very well understood there is a strong possibility that the first set of specifications will be wrong. Prototypes can be used to validate specifications because the user can view the prototype’s behavior and determine if it seems to be behaving in the correct manner (Jones 1990). There are two types of specification problems that can be solved using prototypes: where the designer does not quite understand the requirements of the customer, and when the customer is not sure of his own requirements (Jones 1990). According to Jones (1990), prototyping helps when going from the part of the specification that we do understand and to the part that we have not yet fully understood by embodying the specifications in an executable form to evaluate and expanding them.
Figure 11 shows the rapid prototyping model as Jones (1990) describes it. The model is not completely linear like the traditional model described earlier. After the prototype has been tested, the specifications can be adjusted to meet new requirements that surfaced during testing and then all the phases back to testing are revisited. After testing it is decided if the software is ready for operation or if another iteration is required.
Figure 11. The rapid prototyping software model. (Adapted from Jones (1990: 21))
Analysis Specification Design Implementation Testing Operation
7 Method
When the first version of the software has been produced the developer and the potential user evaluate it. At this point, if the software lacks viability, it can be aborted. No significant cost or time has been spent on the software so this is not a total catastrophe. When the first version has been produced, the communication between the user and the developer becomes easier (Jones 1990). This is partly because the user has now something to point at. The developer also gains insight into the nature of the problem and can experiment with alternative solutions, which the user can evaluate. The user can also make his requirements more accurate. As many versions of the software as are needed are produced, with each version more efficient, accurate, and complete and closer to the final product.
Instead of the straight-line progress of the traditional model, e.g. the waterfall model, the rapid prototyping model is more of a spiral model. This is because of the feedback effects of each successive prototype’s influence on the next (Jones 1990). As a new version of the software (prototype) is produced, it is likely that the developer passes through the life cycle stages of analysis, specification, design, implementation, and testing (Jones 1990).
Prototyping can also be wasteful if each prototype is simply thrown away after using it to gather information, and it can be sloppy if the quick-and-dirty software makes its way into the final product (Jones 1990). It is also hard to plan prototyped software to allow future enhancements and interfacing to other, as yet unknown, software products to be made (Jones 1990).
According to Ghezzi et al. (1991), the software life cycle based on prototyping differs from the typical waterfall model, described earlier, where first there is performed a complete requirements analysis and specification and then the development of the application begins. The prototyping life cycle is based on a more flexible and iterative development model. This will have an effect on both the technical aspects of the projects and organizational and managerial issues (Ghezzi et al. 1991).
According to Pressman (1997), the design phase with rapid prototyping is done quickly and focuses on a representation of those aspects of the software that will be visible to the user, e.g. input approaches and output formats.
If the rapid prototyping model would be used in this project the stages of the development of the visualization tool would be these:
• Choosing a visualization aid. As the constructs available in programming languages can be rather hard to use for visualization of data, the use of visualization aids is preferable and especially for the creation of animations. • Quick design. The design phase would mainly include the design of things
that are visible to the user such as the user interface, how the visualization takes place, etc. Design of components that are vital for the visualization tool and how they are interconnected and how they interact with each other would also be performed.
• Implementation. This phase would include the implementation of the components that are to be built in the iteration.
• Testing. This would include evaluation of the visualization tool to if there are any new requirements that surface, and to see if all requirements have been satisfied.
7 Method
• Another iteration. If time allows, another version of the visualization tool would be produced, i.e. another iteration of design, implementation, and testing would be performed.
7.2 Choice of Approach
As Ghezzi et al. (1991) point out, in most practical cases there is no way of getting all the requirements right before an application is developed. Requirements emerge as the application becomes available for practical experimentation. Ghezzi et al. (1991) further state that the sooner feedback is received from the user, the easier it is to incorporate the required changes into the software and thus, incrementality is intertwined with anticipation of change and is one of the cornerstones upon which evolvability may be based.
The traditional model works well if it is possible to identify all the requirements in the beginning of the project, but if that is not possible the traditional model is not a very good option. There is no absolute guarantee that all the requirements have been identified for the visualization tool. If the traditional model would be used, the required changes would be hard to incorporate into the visualization tool. The rapid prototyping model is more flexible and it would be easier to incorporate the changes into the tool if that model would be used.
In this project it is rather important that a working version of the visualization tool is ready in a short time because of the time restrictions of the project. With the traditional model, a working version of the software is not available until very late in the project’s time-span. However, with the rapid prototyping model a working version of the software can be available in a very short time.
Based on the arguments presented above, I choose to use the rapid prototyping model for this project.
The following steps would then be performed in this final year project:
First iteration:
• Choose a visualization aid. For this step, some visualization aids suitable for visualizing composite events will have to be identified. The visualization aid that is, hopefully, best suited for this final year project is then chosen to be used. A programming language to implement the visualization tool in will be chosen from the programming languages supported by the visualization aid. • Quick design. A quick sketch of the architecture of the visualization tool will
be produced. This sketch will only include the most basic components for the first version of the proposed system.
• Implementation. The design that has been produced in the previous step will be implemented in the programming language that has been chosen. This first version of the visualization tool servers the purpose of testing the chosen visualization aid and confirming that it can be used in further development of the visualization tool.
• Testing. Testing of the first version of the visualization tool is performed to confirm that the visualization aid that was chosen is suitable for further development of the visualization tool. If the visualization aid is proven not to