Keeping the Initiative Through Disruptions
Developing a Business Continuity Model for Gambro Global Operations
By Axel Hyllienmark & Emil Nilsson
Through globalisation, efficient logistics and increased company specialisation, the business world is increasingly dependent on long relationships and stable processes between companies.
In this environment, sudden interruption in deliveries is a major worry that could cause significant trouble for businesses of all types. The Fukushima accident in 2011 and the flooding in Thailand the same year are two recent events where natural
catastrophes made a very large impact on global supply chains, even far from the impact area. But not only natural disasters can cause havoc. In March 2000, a small fire in a Philips factory’s cleaning room interrupted the supplies of microchips for the telecom companies Nokia and
Ericsson.
As Philips did not manage to recover the production until months later, the
customers had to find alternative suppliers to keep selling their products. While Nokia were swift in their response, Ericsson did
not succeed in securing alternate sources and suffered a heavy financial loss due to the accident. This case illustrates both Philips’s inability to secure a sensitive manufacturing process against hazards and Ericsson’s failure in acting fast upon the disruption. But this is only one of many similar cases. In May 2012, two
earthquakes hit the Emilia-Romagna region north of Bologna, where one of the medical equipment manufacturer
Gambro’s largest production units is located. The area was severely damaged by the earthquakes.
For Gambro, the first priority was to secure treatments of patients in need of the company’s products. Gambro managed to achieve this goal, but the recovery was very expensive and required the full organisation’s commitment. In the aftermath of the earthquake Gambro decided that the experiences could make the organisation stronger. By introducing a comprehensive and harmonised procedure for business risk management the company would benefit. In this context the project was initiated.
Project
In order to improve Gambro’s current approach to risk management a harmonised and globally applicable working procedure was proposed as a master thesis project by Gambro’s Global Operations Project Office in late 2012. By making use of academic literature, external and internal benchmarking a rather
detailed level model has been developed during the spring of 2013. The model includes a both a proposition of
governance and a three step procedure of how to identify, analyse and work with mitigation of risks.
Literature
Quality and risk analysis can, generally speaking, be done in two different ways. A deductive approach means that a system is analysed by
going
through subcomponent by subcomponent and identify potential failure modes. Thefailure mode’s impact on the
subcomponent and system level can then be analysed and rated in terms of occurrence and severity. One commonly used method of deductive risk analysis is Failure Mode and Effect Analysis (FMEA).
In figure 1 example a bicycle is analysed using the FMEA methodology. When the method is used in an industrial context more failure modes are found and can also be given ratings of likelihood and severity
In contrast, an inductive approach means starting with the end scenario and analyse the possible causes of the failure. This can
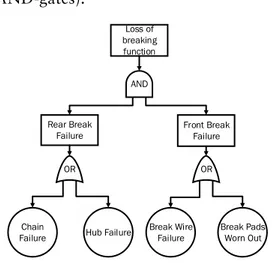
be done at different levels and detail of analysis. Often times some kind of graphic representation is used to aid the process, for instance an Ishikawa diagram or a Fault Tree Analysis (FTA). In a Fault Tree the top event (the failure) is connected to the causes with logical gates (OR- or AND-gates).
In figure 2 a bicycle is analysed once again. The possible failure modes are connected with logical gates, starting from the top and moving downwards. If needed, the analysis can be on an even higher level of detail by continuing downwards
Those methodologies presented above are normally used in production processes while analysing quality issues and production processes. Nevertheless, the approaches are the same when looking at higher level risks with larger impact. Regardless of what methods and tools that are used, maturity and willingness must be present in order to make effective use of them.
Loss of breaking function
Chain
Failure Hub Failure OR
Break Wire
Failure Break Pads Worn Out OR
Rear Break
Failure Front Break Failure AND
System Component Failure mode Local effect System effect Suggested actions Bicycle Left pedal Break off at
pedal arm
Impossible to use with foot
Only right pedal can be used to power bicycle
Shorten service intervals
Figure 1 - An example of a Failure Mode and Effect Analysis
Model
The model proposed in this thesis is, as mentioned, divided in to two parts, a governance suggestion and a three-step procedure of how to identify analyse and mitigate risks.
The governance is built upon Gambro’s current manufacturing organisation where the individual plants work independently with their risks, under the supervision of a Global Process Continuity Manager (GPCM). At each manufacturing site, a Process Continuity Management Team (PCMT) is formed with, senior and knowledgeable, representatives from the following departments:
• Production • IT
• Facility • Supply
These four departments are seen as imperative to keep production going and should all be involved in the analysis. For the detailed level analysis which may be necessary to assess risks properly, a Continuity Project Team (CPT) can be formed cross functionally with specialist from a variety of functions.
The final objective of the model is to provide a structured method of identifying risks and to evaluate them in a clear sighted manner, so that mitigation
strategies are aimed correctly and a good balance between costs and potential savings is obtained. Some key elements to succeed is the separation between cause and impact, the quantification of risks in financial terms (Business Interruption Value) and the support of deciding mitigation strategies and business continuity plans.
Step 1 - Business Impact Analysis
The working procedure is begun with the Business Impact Analysis. The PCMT is responsible for identifying the plant’s critical activities and resources and to establish a Recovery Time Objective (RTO) for those. The RTO is the
timeframe which Gambro can accept the activity or resource being unavailable without suffering a too large financial impact. Critical activities and resources are those that are essential for the
manufacturing capability and cannot be re-established or recovered in an easy matter. Normally, tools such as plant layout maps, process maps, component lists and IT structure maps can be used to assist the identification process.
Step 2 - Risk Assessment
Once risks to critical resources and activities have been identified, a detailed level analysis is necessary. First, the potential causes of the risk occurring are identified, typically by brainstorming. Secondly, the causes are assessed in terms of likelihood and Business Interruption Value. The likelihood rating is expressed in terms of the expected number of years between each cause occurrence. While this may be viewed as a guessing game, there are statistical methods that can make the analysis more reliable. Databases for the risk of natural disasters, information from insurance reviews and reliability data from
Global Process Continuity Manager Process Continuity Management Team Process Continuity Management Team Process Continuity Management Team Process Continuity Management Team Continuity Project Team Continuity Project Team Continuity Project Team Continuity Project Team Top Management Level Site Management Level Specialist Level Continuity Project Team Continuity Project Team Continuity Project Team Continuity Project Team Continuity Project Team Continuity Project Team Continuity Project Team Continuity Project Team
the equipment manufacturer are examples of sources that can be used.
The Business Interruption Value is determined by considering the activity’s recovery time, the product mix affected and the margins of the products. Given those parameters, the risks can be assessed from a financial perspective and the cost/benefit of risk responses will be more transparent. The supply chain
department’s input is normally necessary to determine what length of interruption is acceptable without affecting the actual sales of the products. The financial department’s input is also necessary to provide updated information on the profit margins of the products.
Business Interruption Value Classifications
Description Value (MEUR)
Minor 0.1
Serious 0.1-1 Critical 1-15 Catastrophic >15
Both likelihood and Business Interruption Value are graded on a four step rating scale in order to balance a reasonable level of detail for management decisions and the obvious difficulty in giving an accurate estimate of future events.
Step 3 - Mitigation strategies and
business continuity plans
The last step of the analysis is to plan the response of the identified risks. First, possible proactive mitigations should be planned. Normally, the strategies fall under one of the categories:
• Accept • Reduce • Avoid • Share • Transfer
Proactive in this context is activities or changes that can be done in order to reduce the likelihood or the business interruption value of the risk before anything occurs. For instance, mitigation strategies can be to install back-up server capacity or extra power generators.
Business continuity plans are the action plans of what should happen in the event of a disruption. The response can be divided into a response, recovery and restoration phase with planning of activities in each one. For instance, the prioritisation of what should be saved first if a natural disaster or fire occurs and where the production can be restarted should be determined.
In order to keep the analysis harmonised and coherent throughout Gambro, a knowledge sharing platform on the internal network will be created. The documentation in form of completed templates can then be shared and different sites and different parts of the organisation can make use the collective experience. Not described in this master thesis, but an imperative part of the work with risks is also continuous reviewing and monitoring of the assessments already done. Practice of emergency procedures and business continuity plans should also be executed periodically, just as fire drills are done to ensure the employees’ safety.
Figure 4 - Business Interruption Value classifications
Model Test
To test the applicability and function of the model a test has been performed within the planning process of the new
manufacturing site in Medolla, Italy. Given the context the analysis was done on a high level regarding large scale events such as natural catastrophes rather than a more detailed level process risks. Despite certain difficulties the test was successful and a complete assessment of the site was possible to obtain. The difficulties primarily concerned the estimations of downtimes for support functions and processes with manual labour. As those processes are less binary than automated production steps the quantification becomes more difficult. However, the
analysis could be done sufficiently detailed to fit the rating scale.
Conclusion
The model contributes to Gambro by providing a uniform model for assessment of business risks on both higher and more detailed level. The risks can be rated and compared in financial terms against possible mitigation strategies to enable appropriate prioritisation. The thesis also adds to theory by bridging a gap between high level success factors for effective risk management and detailed level tools for identification and analysis of process related risks. Looking into the future, it would be possible for Gambro to expand the model to also cover risks not directly linked to business interruption, but also market and macro risks. This would however require a different take on the identification process and the severity rating. Closer in time may be to expand the model to also consider suppliers to enable better supply chain visibility and proactive measures against risks
Figure 5 - Likelihood classifications
Likelihood Classifications
Description Likelihood
Improbable More than 20 years Remote Every 5-20 years Occasional Every 1-5 years