Radiological consequences of
radionuclide releases to sewage
systems from hospitals in Sweden
Rodolfo Avila, Idalmis de la Cruz,
Synnöve Sundell-Bergman och Serena Hasselblad
SSI Rapport
2007:10
Rapport från Statens strålskyddsinstitut tillgänglig i sin helhet via www.ssi.seUltraviolet, solar and optical radiation
Ultraviolet radiation from the sun and solariums can result in both long-term and short-term effects. Other types of optical radiation, primarily from lasers, can also be hazardous. SSI provides guidance and information.
Solariums
The risk of tanning in a solarium are probably the same as tanning in natural sunlight. Therefore SSI’s regulations also provide advice for people tanning in solariums.
Radon
The largest contribution to the total radiation dose to the Swedish population comes from indoor air. SSI works with risk assessments, measurement techniques and advises other authorities.
Health care
The second largest contribution to the total radiation dose to the Swedish population comes from health care. SSI is working to reduce the radiation dose to employees and patients through its regulations and its inspection activities.
Radiation in industry and research
According to the Radiation Protection Act, a licence is required to conduct activities involving ionising radiation. SSI promulgates regulations and checks compliance with these regulations, conducts inspections and investigations and can stop hazardous activities. Nuclear power
SSI requires that nuclear power plants should have adequate radiation protection for the generalpublic, employees and the environment. SSI also checks compliance with these requirements on a continuous basis.
Waste
SSI works to ensure that all radioactive waste is managed in a manner that is safe from the standpoint of radiation protection.
Mobile telephony
Mobile telephones and base stations emit electromagnetic fields. SSI is monitoring developments and research in mobile telephony and associated health risks.
Transport
SSI is involved in work in Sweden and abroad to ensure the safe transportation of radioactive substances used in the health care sector, industrial radiation sources and spent nuclear fuel.
Environment
“A safe radiation environment” is one of the 15 environmental quality objectives that the Swedish parliament has decided must be met in order to achieve an ecologically sustainable development in society. SSI is responsible for ensuring that this objective is reached.
Biofuel
Biofuel from trees, which contains, for example from the Chernobyl accident, is an issue where SSI is currently conducting research and formulating regulations.
Cosmic radiation
Airline flight crews can be exposed to high levels of cosmic radiation. SSI participates in joint international projects to identify the occupational exposure within this job category.
Electromagnetic fields
SSI is working on the risks associated with electromagnetic fields and adopts countermea-sures when risks are identified.
Emergency preparedness
SSI maintains a round-the-clock emergency response organisation to protect people and the environment from the consequences of nuclear accidents and other radiation-related accidents.
SSI rapport: 2007:10 augusti 2007 ISSn 0282-4434
The conclusions and viewpoints presented in the report are those of the authors and do not necessarily coincide with those of the SSI.
Författarna svarar själva för innehållet i rapporten.
edItorS / redaktörer : Rodolfo Avila1), Idalmis de la Cruz1), Synnöve Sundell-Bergman2) och Serena Hasselblad3)
1)Facilia AB, 2)Vattenfall Power Consultants AB 3)Callido AB
tItle / tItel: Radiological consequences of radionuclide releases to sewage sys-tems from hospitals in Sweden. / Radiologiska konsekvenser av utsläpp av radio-aktiva ämnen från sjukhus till avloppssystem i Sverige.
department / avdelnIng: Department Nuclear Facilities & Waste Management/ Avdelningen för kärnteknik och avfall.
Summary: The report addresses radioactive discharges to sewers originating from hospitals, mainly in the form of the excretion of patients treated with radioisotopes for diagnostic or therapeutic purposes. Assessments of doses to the public, including sewage workers, arising from such discharges are performed. Doses are compared against the exemption level of 10 µSv/a and the dose constraint of 100 µSv/a. As a basis for the dose assessments, information on the use of radionuclides in Swed-ish hospitals during the period 1999-2004 is presented and estimates of discharges to the sewage systems are derived. Current sewage treatment practices in Sweden are summarised focusing particularly on the fate of sewage sludge, both in the sewage plant and outside.
Radiological impact assessments are performed in two steps. The assessments in the first stage are performed using a simple screening model, not intending to predict exposures realistically but only to identify exposure pathways and radionuclides that are potentially relevant and require further consideration in the more detailed assessments. Results show that only a few of those radionuclides used in the period 1999-2004 in Swedish hospitals for radiotherapy and radiodiagnostics could lead to potentially significant doses (P-32, Y-90, Tc-99m, In-111, I-123, I-131 and Tl-201). Relevant exposure pathways are the external exposure of sewage workers (for Tc-99m, I-123, I-131, In-111 and Tl-201) and the exposure of the public via ingestion of water (I-131) and fish (P-32, Y-90 and In-111 and I-131).
The objective of the second stage is to perform realistic assessments of the doses to sewage workers and to the public through the use of contaminated agricultural sludge and through the contamination of drinking water. For this purpose, the LUCIA model was developed. This model dynamically addresses the behaviour of radionuclides in the different process steps of a sewage plant. The model can address continuous releases as well as pulse releases of radionuclides.
In a first step of applying the LUCIA model, realistic assessments of the external exposure of sewage workers and of exposures of the public are carried out for the Kungsängsverket sewage plant in Uppsala. The results show that there is a significant probability (from 0.2 to close to 1) for the doses to exceed the exemption level for the radionuclides In-111 and I-131. In the case of In-111, there is also a significant proba-bility (from 0.16 to close to 1) for the doses to exceed the dose constraint (100 µSv/a). A sensitivity study of the LUCIA model is performed, showing that the predicted con-centrations in the digested sludge are highly sensitive to the distribution coefficient Kd between the liquid phase and the sludge. The efficiency of the wastewater treatment is, in addition, highly sensitive to the water flux. Specific values for the distribution coefficients for sludge are not available. Therefore, it is recommended to perform measurements for the determination of this parameter. The LUCIA model can then be used to interpret the measurements and derive values for the distribution coefficients. In a second step, the LUCIA model is extended to also address doses to the public. Dose estimates for all exposure pathways are presented for all sewage plants that are affected by radionuclide releases originating from hospitals.
Effective dose factors are derived for the affected sewage plants, relating doses over the different pathways to the activity that is discharged annually and to the activity concentration in the wastewater. These effective dose factors can be used in order to estimate exposures associated with a certain release of activity in cases of changes of the annually administered activities of the different radionuclides. These factors also can be used if the effects of measures are to be evaluated to reduce the releases of individual radionuclides.
SammanfattnIng: Rapporten handlar om vilka radiologiska konsekvenser som kan uppkomma till följd av utsläpp av radiofarmaka från sjukhus till kommunala reningsverk. Stråldoser har beräknats till såväl allmän-het som arbetstagare i reningsverken och resultaten har jämförts med två olika dosnivåer, 10 µSv/år och 100 µSv/år.
Informationen om användning av radiofarmaka på de svenska sjukhusen under perioden 1999-2004 har använts som underlag till dosbedömningarna. Likaså har en kartläggning av de reningsprocesser som idag til-lämpas vid de kommunala reningsverken genomförts inom projektet, och som sammanfattas i rapporten. Dosbedömningarna utfördes i två omgångar där en enkel screeningsmodell utnyttjades först för att identifiera vilka exponeringsvägar och radioaktiva ämnen som kan vara relevanta ur dos/risk synpunkt när det gäller hantering av flytande radioaktivt avfall från de svenska sjukhusen. Resultaten visade att de radioaktiva äm-nena P-32, Y-90, Tc-99m, In-111, I-123, I-131, In-111 och TI-201 som används inom strålterapi och diagnos-tik kunde ge upphov till stråldoser som översteg den lägre undersökningsgränsen på 10µSv/år och i vissa fall även den högre gränsen på 100 µSv/år. De viktigaste exponeringsvägarna var extern exponering av arbetare i reningsverken och exponering till allmänhet via intag av vatten och fisk.
En modell, LUCIA, utvecklades för att genomföra mer realistiska dosbestämningar till personal på renings-verken. Denna modell belyser de olika radionuklidernas uppträdande i de olika processerna i reningsrenings-verken. Modellen kan hantera pulsformiga utsläpp om sker från de patienter som genomgår nukleärmedicinsk be-handling vi sjukhusen.
LUCIA modellen verifierades genom att doser till personalen och till allmänhet vid ett reningsverk (Kungs-ängsverket i Uppsala) bestämdes. Resultaten visade att det förelåg en signifikant sannolikhet att stråldoserna för utsläpp av de radioaktiva ämnena 111 och I-131 kommer att överskrida 10µSv/år. När det gäller In-111, fanns också en signifikant sannolikhet att doserna överskred 100 µSv/år.
Den känslighetsanalys som redovisas i rapporten visade att de uppskattade aktivitetskoncentrationerna i slam är mest känsliga för distributionen av aktivitet (Kd) för respektive radionuklid mellan vatten och slam i re-ningsverket. För vissa radionuklider (In-111) är denna fördelning okänd.
I rapporten redovisas dosfaktorer för alla exponeringsvägar för samtliga reningsverk som berörs av utsläppen från sjukhusen, beräknade med hjälp av LUCIA modellen. Dessa värden kan användas som referensnivåer för att uppskatta exponeringar associerade med olika typer av utsläpp.
LIST OF CONTENTS
1 Introduction 2
1.1 Objectives of the study 2
2 Use of radionuclides in nuclear medicine at Swedish hospitals 3
3 Waste water treatment in Sweden 8
3.1 Effluent treatment 10
3.2 Sludge treatment 11
4 The screening study 12
4.1 The screening method 13
4.3 Results and Discussion 16
5 Dynamic model of the turnover of radionuclides in a sewage plant 19
5.1 The conceptual mode 19
5.2 Mathematical model and parameters 23
5.3 Sensitivity analysis 23
6 Realistic dose assessments 25
6.1 Investigation of the dynamics of releases 25
6.2 Results and discussion 27
7 Dose Estimates for All Treatment Plants and Exposure Pathways 30
7.1 Results 30
7.2 Discussion of Results 36
7.3 Derivation of Effective Dose Factors 41
8 Conclusions and recommendations 44
9 References 47
Appendix A:
Estimated yearly releases to the studied sewage plants for the period 1999-2004/2005 48 Appendix B:
Screening Model 67
Appendix C:
1 Introduction
The current Swedish regulations on handling and disposal of medical radioactive waste from hospitals and research institutions were issued in 1983 and are to large extent based on the recommendations of ICRP 26 from 1977. The ALI1 concept as defined in ICRP 26 was introduced for limiting the release
of radioactive waste. The ALI values are based on an annual dose limit of 50 mSv to workers and calculated as the (committed) equivalent dose in any tissue and year.
It was at that time considered that the main exposure pathways associated with the disposal of liquid radioactive waste were the possibility to inhale or ingest radioactive material, because external exposures could be controlled by limiting the dose rate at the surface of radioactive waste packages. Since it was assumed that only very small fractions of the released activity could be inhaled or
ingested in one event, the limiting amount of activity of 1 ALI was chosen. In the regulations, the most restrictive ALI for each radionuclide was chosen (ALImin) as the limiting value and 10 ALImin per
month from one practitioner were decided to be acceptable. The ALImin concept has also proved to be a
simple tool for regulating other types of medical radioactive waste from hospitals and research institutions
It was known that releases of activity with the excreta from patients undergoing treatment in nuclear medicine were higher than the ALImin values. Nevertheless, these were exempted from the regulations.
This was done based on the demonstration by measurements and calculations that the doses from intake for sewage workers are minimal. Also, calculations revealed very low doses to members of the public from liquid discharges. In addition, the exemption of excreta from patients took account of the fact that such releases cannot be easily monitored and controlled. In ICRP 60, the ALI concept has been superseded by dose conversion factors for workers as well as members of the public,
encompassing several age groups. This was regarded as more advantageous since dose limits may change over time. This change is not yet reflected in the existing Swedish regulations.
The radionuclides released to sewers from nuclear medicine are predominantly Tc-99m (more than 50 %), followed by I-131. Studies have been undertaken to measure radioiodine activity at two sewage treatment plants in south of Sweden receiving radioactive disposals from large hospitals. The
concentration of various radionuclides has been measured in the incoming and the outgoing water, and in the sludge (Erlandsson et al. 1978, 1979; Ingemansson et al. 1981). These studies show that the release from the hospitals enters the wastewater treatment plant as a pulse after a delay of some hours. Furthermore, it has been confirmed that a certain fraction of the radionuclides is bound to sewage sludge, while others follow the water phase. The percentage bound to the sludge depends on the type of radionuclide and on the chemical environment.
1.1 Objectives of the study
The objective of the study reported here is to perform an assessment of doses to the public, including sewage workers, which arise from liquid discharges from hospitals, mainly from patients. The results of this assessment are intended to provide supporting information to be used during the revision of the regulations. In this respect, an objective of particular interest is to identity releases and exposure pathways, which could lead to doses above the exemption level of 10 µSv/a, since these situations would require some kind of regulatory control.
One of the specific objectives of the study is to collate information on the use of radionuclides at Swedish hospitals in the period 1999-2004 and to make estimations of discharges to the sewage system (Section 2). Another specific objective is to review the current sewage treatment practises in
Sweden focusing particularly on the fate of sewage sludge, both in the sewage plant and outside (Section 3).
It was decided to perform the assessment of the radiological impact of the discharges in three stages: • The assessments of the first stage (Section 4) are performed using a simple screening model. The
intention is not to realistically predict exposures, but to identify those exposure pathways and radionuclides which are potentially relevant and require further consideration in the more detailed modelling.
• The objective of the second stage is to perform realistic assessments of the doses to sewage workers (Section 6). These are considered likely to be above the exemption level based on the results from studies carried out in the UK (Titley et al. 2000). As a part of this work, the LUCIA model (Section 5) was developed for deriving prognoses of the fate of radionuclides discharged from hospitals and research institutions in sewage plants.
• In a third step, other relevant pathways are considered and assessments for all sewage plants in Sweden are derived which can be affected from radionuclides originating from hospitals (Section 7).
2 Use of radionuclides in nuclear medicine at Swedish hospitals
Unsealed radionuclides are used in nuclear and veterinary medicine both for diagnostic and therapeutic purposes. Generally, the unsealed radionuclides are radiopharmaceuticals that are
administered to patients by injection, via ingestion or inhalation. The radionuclides can be localised in specific tissues until they decay or be eliminated through various pathways (such as urine).
In diagnostics relatively energetic gamma emitters are being used with short half-lives to obtain informative images with gamma cameras. Examples of diagnostic examinations are bone scans to assess the presence of metastasis and cardiac scans to investigate the functional capacity of the heart muscle. Tc-99m with a decay half-life of six hours is the most common radionuclide used in nuclear medicine, about 80 % of the applications of radioisotopes use Tc-99m. It decays to Tc-99 with a much longer half-life implying that these releases will eventually reach the sea and contribute to increase in the global activity levels of Tc-99activity levels. World wide approximately 32 million diagnostic nuclear medicine procedures are performed each year (UNSCEAR 2000). Annually approximately 100 000 examinations are performed in Sweden at about 30 hospitals. In addition there are six animal hospitals that perform diagnostics with radiopharmaceuticals, mainly Tc-99m scintography on horses. Compared with diagnostic applications, therapeutic treatments are fewer in number but use in general greater activities and beta emitting radionuclides with longer effective half-lives (biological and physical). The use of radiopharmaceuticals has increased during the years and radio-immune therapy is a growing area for treatment of wide spread cancer (lymphoma) in the body. Examples of therapy treatments include sodium iodide-131 for hyperthyroidism or thyroid cancer, Sr-89 and Sm-153 for bone metastases. 131I-iodobenzylguanidine (MIBG) is an organic compound used for treatment of adrenal cancers.
Table 2.1 shows the number of radiotherapy treatments with radionuclides at Swedish hospitals during 2004, while Table 2.2 shows the total activity of all radionuclides that were administered to patients during the same year. The most significant radionuclide used for therapy is I-131, which is excreted primarily in the urine with smaller amounts in saliva, sweat and faeces. The retained activity in the patient is a function of a number factors e.g. the radiopharmaceutical, the condition of the thyroid gland. During the first 24 hours following treatment approximately 60 % of administered iodine activity is excreted and after 5 days the total activity in the body of the patient has reduced by about 90 %.
Table 2.1. Number of therapy treatments with radionuclides at Swedish hospitals in 2004. Hospital Consultant **) P-32 phosphate Polycytemi (PCV) Sr-89 chlorid g I-131 NaI I. Cancer I-131 NaI II. Hyperthyreos I-131 MBG III. Cancer IV. Sm-153 V. EDTMP Pain treatment Other treatments Total
Borås Södra Älvs-borgs sjukhus 10 1 77 88
Eskilstuna Mälar- sjukhuset 2 12 49 12 75
Falun Lasarettet Gävle, Uppsala 9 13 58 80
Gävle Gävle Sjukhus 4 16 57 3 80
Göteborg Sahlgrenska univ.sjukhuset 33 1 46 196 1 13 3B, 2H 295
Halmstad Lasarettet Lund 5 74 5 84
Huddinge Karolinska Huddinge 14 259 8 281
Jönköping Läns- sjukhuset 24 10 93 6 133
Kalmar Läns- sjukhuset Linköping 96 96
Karlskrona Blekinge- sjukhuset Växjö 6 9 15
Karlstad Central- sjukhuset 28 7 31 66
Kristianstad Central- sjukhuset Lund 8 8
Linköping Universitets- sjukhuset 20 9 15 79 5J 128
Luleå Sunderby sjukhus Umeå 82 82
Lund Universitets- sjukhuset 44 14 19 290 1 28 5A, 2D, 8J 411
Lund Universitets- sjukhuset 2 2 137 22 1B 164
Skövde Kärn- sjukhuset Eskilstuna 3 56 6 65
Hospital Consultant **) P-32 phosphate Polycytemi (PCV) Sr-89 chlorid g I-131 NaI I. Cancer I-131 NaI II. Hyperthyreos I-131 MBG III. Cancer IV. Sm-153 V. EDTMP Pain treatment Other treatments Total Solna 18J Sundsvall Läns- sjukhuset 2 43 5 23J 73
Uddevalla Central- lasarettet 3 52 55
Umeå Norrlands univ.sjukhus 2 3 88 31 3A 127
Uppsala Akademiska sjukhuset 3 17 45 2 16 2E, 27F 112
Västerås Central- lasarettet 3 7 71 5 86
Växjö Central- lasarettet 19 3 116 138
Örebro Universitets- sjukhuset 12 9 27 8 2A 58
Östersund Sjukhuset 1 23 36 60
TOTALT 244 104 244 2403 10 231 111 3347
*) ”Other treatments ”are here
given
A) Y-90 1033-Mab; Lymphoma F) In-111 Octreotid; Cancer B) Y-90 colloid; Joint synovitis G) I-131 Lipiocis, Livercancer C) Y-90 colloid; Craniopharyngiom H) Re-186 Colloid, Synovitis D) Y-90 hLL2, NHL J) Ra-223; Pain treatment E) Y-90 Zevalin, NHL
**) Note. If therapies are provided by consultants from other hospitals, these hospitals are also given in this column. From medsys.uas.se/sfit/index2.htm
Table 2.2. Activity administered to patients at Swedish hospitals during 2004 *
Activity, MBq Hospitals
Cr-51 I-123 I-125 I-131 In-111 P-32 Se-75 Sm-153 Sr-89 Tc-99m TI-201 Y-90
Akademiska Uppsala 2.4E2 6.5E2 - 1.3E5 3.5E4 5.7E2 1.2E1 4.8E4 1.4E6 - 1.9E3
Blekinge Kalskrona 9.2E2 - - - 2.1E3 2.6E4 8.9E2 7.5E5 - -
Centrallasarettet Västerås 1.1E2 - - 5.6E4 6.8E2 4.2E0 1.4E4 - 6.3E5 - -
Centrallasarettet Växjö 9.0E1 2.3E3 - 3.1E4 5.1E2 2.8E3 1.2E1 - 4.4E2 1.0E6 9.0E2 -
Centralsjukhuset Karlstad 2.3E2 4.6E2 - 5.0E4 - 6.8E3 1.5E1 - - 9.4E5 - -
Centralsjukhuset Kristianstad 1.5E2 - - - - - - - 1.2E3 1.3E6 - -
Danderyds Sjukhus 1.9E2 - - - - - 3.3E0 - 2.7E0 1.4E6 - -
Drottning Silvias barnsjukhus 1.1E3 1.1E3 - - 7.8E1 - - - - 8.8E4 - -
Falu lasarett - - - 5.7E4 - - - - 1.4E3 6.2E5 - -
Helsingborgs lasarett - - - - - - - - - 8.2-E5 - -
Huddinge sjukhus 4.2E2 5.8E3 2.1E0 1.2E5 - 3.7E3 4.8E0 2.5E4 - 1.8E6 - -
Kalmar-Västervik 1.4E2 5.0E-1 3.8E4 3.5E2 - - - 9.0E5 - -
Karolinska sjukhuset 4.0E2 2.0E4 1.1E1 4.9E5 2.3E4 3.8E3 3.3E1 6.2E3 3.6E3 1.6E6 - 5.7E3
Kärnsjukhuset Skövde 3.5E3 3.9E1 - 2.1E4 2.8E3 4.3E1 1.8E4 4.5E2 5.7E5 - -
Länssjukhuset GävleSandviken - 1.2E3 - 8.9E4 - 9.4E2 2.6E0 8.0E3 - 8.7E5 - -
Länssjukhuset Halmstad 5.4E1 - - 2.1E4 - 1.3E3 - 1.3E4 - 4.4E5 - -
Länssjukhuset Ryhov Jönköping 5.2E1 1.5E3 - 8.7E4 - 4.1E3 1.6E0 1.6E4 - 1.0E6 - -
Mälarsjukhuset Eskilstuna - - - 7.2E4 - 4.0E1 - 3.2E4 - 7.7E5 7.6E2 -
Norra Älvsborgs Länssjukhus 1.6E3 - 7.5E-1 - - - - - 4.2E5 - -
Norrlands Universitetssjukhus Umeå 2.3E3 3.1E4 3.6E0 3.6E4 6.0E3 4.0E2 3.0E1 9.4E4 - 1.8E6 - 2.9E3
Regionssjukhuset Örebro - 2.8E3 - 4.7E4 3.4E3 2.2E3 2.4E1 2.1E4 - 7.1E5 1.0E2 2.4E3
Sahlgrenska Universitetssjukhuset 6.3E3 8.3E3 5.9E0 2.9E5 2.6E4 7.0E3 7.1E1 3.4E4 1.3E2 2.2E6 - 5.5E2
St.Görans sjukhus - - - - - - - - - 1.4E5 - -
Sunderby sjukhus - - - 4.9E4 - - - - - 1.1E6 - -
Activity, MBq Hospitals
Cr-51 I-123 I-125 I-131 In-111 P-32 Se-75 Sm-153 Sr-89 Tc-99m TI-201 Y-90
Södersjukhuset SÖS - - 3.6E0 6.5E1 - - - - - 1.6E6 - -
Södra Älvsborgs Sjukhus Borås 1.7E3 - - 1.9E4 1.5E1 2.0E3 - - 1.5E2 4.4E5 - -
Uddevalla sjukhus - - - 1.7E3 - 1.1E1 1.3E5 4.5E2 4.4E5 - -
Universitetssjukhuset Linköping 4.7E2 1.9E3 - 8.9E4 3.5E3 5.4E3 4.1E0 - 1.4E3 1.2E6 - -
Universitetssjukhuset Lund 3.0E0 1.4E4 - 2.2E5 2.5E4 1.1E4 2.2E0 8.2E4 2.1E3 3.2E6 - 6.1E3
Universitetssjukhuset MAS Malmö 2.5E2 3.6E3 - 9.0E4 1.8e3 5.2E2 5.3E0 6.9E4 - 2.4E6 - 3.7E1
Uppsala Imanet - - - - - - - - - -
Östersunds sjukhus 2.2E2 - - 1.3E4 - 1.8E2 4.0E0 - 3.5E3 4.4E5 - 2.2E2
Östra sjukhuset 3.4E2 - 4.0E0 - - - 3.3E0 - - 4.7E5 - -
3 Waste water treatment in Sweden
The purpose of the sewage effluent treatment is to clean the effluents so they can be discharged into the environment. Pollutants which are removed from the effluents during the treatment are: larger inorganic and organic solids (floating items), suspended solids (particles larger than 0.45 micrometer, very fine particles) and dissolved oxygen consuming matter (organic substances), phosphorous and nitrogen.
The load of pollutants varies during the season of the year and within the day. Stormy weather can also influence the fluxes of water and pollutants to the sewage plant. Although the waste water and storm water are usually transported in different pipe systems, there exist leakages in the system, which explains why heavy rains can affect the fluxes of waste water into the sewage plant.
Similar systems for waste water treatment are used all over Sweden. The waste water treatment is carried out in a number of local and regional sewage plants of similar design, the differences among them being mainly in their size, commonly measured by the number of persons-equivalent2 served. The final recipient to where the treated waste water is discharged also varies from plant to plant. The size and recipient of the sewage plants that receive radionuclide releases from Swedish hospitals are given in Table 3.1. The size is given in units of person-equivalent (P.E.).
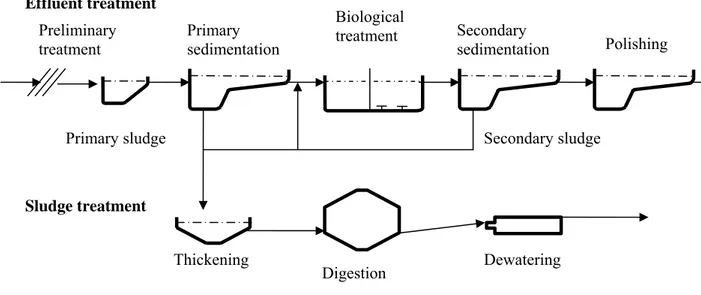
The waste water treatment includes treatment of the effluents and of the generated sludge (Figure 3.1). The effluent treatment (see Section 3.2) includes mechanical, biological and chemical processes for cleaning the waste water, while the sludge treatment aims mainly at stabilising and reducing the volume of the generated sludge.
Figure 3.1. Schematic representation of the waste water treatment at Swedish sewage plants.
2 The number of persons-equivalent measures indirectly the waste water flux coming into the sewage plant,
including domestic and industrial waste water.
Sludge treatment Thickening Digestion Dewatering Effluent treatment Preliminary treatment Primary sedimentation Biological treatment Secondary sedimentation Polishing Secondary sludge Primary sludge
Table 3.1. Size and waste water recipient of the sewage plants that receive radioactive releases from hospitals
Hospital Plant Size in P.E.* Recipient
Borås Gässlösa 97 000 Viskan Danderyd Käppalaverket 520 000 Askrikefjärden Eskilstuna Ekeby 60 000 Eskilstuna å Falun Fränby 40 000 Sjön Runn
Gävle Duvbacken 80 000 Inre fjärden, Gävlebukten Göteborg Ryaverket 775 500 Göta älv
Halmstad Västra stranden 110 000 Laholmsviadukten Helsingborg Öresundsverket 150 000 Havet
Huddinge, Sth. Henriksdal 768 000 Halvkakssundet Jönköping Simsholmen 80 000 Munksjön Kalmar Tegelviken 80 000 Kalmar sund Karlskrona Koholmen 40 000 Östersjön Karlstad Sjöstadsverket 90 000 Vänern Kristianstad Centrala reningsverket 205 000 Hammarsjön Linköping Tekniska verken 165 000 Stångån till sjön Rocksen Luleå Uddebo 70 000 Luleå älv
Lund Källby 90 000 Höje å
Malmö Sjölunda 270 000 Öresund
Skövde Statskvarn 57 000 Mörkerbäcken till Tidans vattensystem
KS, Sth. Henriksdal 768 000 Halvkakssundet St Göran, Sth Henriksdal 768 000 Halvkakssundet Söder Sjukh,
Sthlm
Henriksdal 768 000 Halvkakssundet Sundsvall Fillanverket 20 000 Alnösundet
Uddevalla Skansverket 47 000 Bävån till Byfjorden
Umeå Ön 103 000 Umeå älv
Uppsala Kungsängsverket 180 000 Fyrisån Västerås Kungsängen 120 000 Mälaren Växsjö Sundet 60 000 Norra Bergundasjön
Örebro Skebäck 153 000 Hjälmaren
Östersund Göviken 64 800 Storsjön * Person-equivalent
3.1 Effluent treatment
The effluent treatment consists of five main steps: preliminary treatment, primary sedimentation, biological treatment, secondary sedimentation and final polishing. The treatment processes that take place in each step are described below.
Preliminary treatment
The purpose of this initial step is to remove large pieces of material by screening and rapid
sedimentation. The process is continuous and fast. Radionuclides and other contaminants absorbed onto the removed materials will be extracted from the effluent. This preliminary treatment does not affect significantly the suspended solid load and will therefore have a small effect on the overall radionuclide concentration in the effluent (Titley et al. 2000).
Primary sedimentation
The main treatment process of this stage is the mechanical settling of suspended solids. The suspended particles are heavier than water and are settled by gravity under quiescent conditions in large settling tanks. Chemical coagulation of the raw waste water before settling promotes flocculation of finely divided solids, thereby increasing the removal of suspended solids and organic matter. Settling with coagulation and flocculation may remove 60 to 90 % of the suspended solids and 30-60 % of the chemical oxygen demand (COD). Adding of chemical substances for flocculation also withdraws phosphorous from the raw waste water. The residence time of water in the primary sedimentation tanks is only a few hours, but can be sufficient to reduce significantly the activity of radionuclides with very short half lives such as Tc-99m. The radionuclides in settled solids will be removed from the effluent together with the primary sludge.
Biological treatment
After the primary sedimentation treatment the effluent is pumped into basins for biological treatment. The purpose of the biological treatment is to remove the remaining chemical oxygen demand (COD) in the form of fine suspended organic matter. The two processes most commonly used in Sweden for biological treatment are activated sludge (suspended growth) and attached growth.
The activated sludge treatment is predominantly an aerobic process that achieves high concentrations of organisms through the recycle of the sludge containing organisms. The micro-organisms convert the biodegradable organic matter present in the waste water into carbon dioxide (35-45 %) and cell mass (45-55 %). The cell mass is subsequently removed from the system by settling (secondary sedimentation). About 10-25 % of the organic matter is not biodegradable and leaves the plant with the outgoing treated water.
The attached growth treatment provides a surface (medium) on which the microbial layer can grow and expose this surface repeatedly to wastewater for adsorption of organic material and to the atmosphere for oxygen.
The residence time of water in biological treatment tanks is several hours and can be sufficient to reduce significantly the activity of radionuclides with very short half lives such as Tc-99m. During the treatment the concentration of solids in the waste water is about ten times higher than in the raw waste water, which can favour the sorption of radionuclides to solids, which are subsequently removed during the secondary sedimentation.
Secondary sedimentation
Solids remaining in the effluent after the biological sedimentation, mainly as biomass, are removed by settling in sedimentation tanks. The micro-organisms used in the biological treatment have a relatively low growth rate. To keep the concentrations of micro-organisms at the necessary level, about 40-50% of the sludge collected in the secondary sedimentation tank, is pumped back to the biological
treatment. The secondary sedimentation is a short duration process, but due to the sludge recycling a solid particle will stay for several days in the biological and secondary sedimentation basins. The radionuclides that have been absorbed onto the sludge particles can decay considerably before the secondary sludge is removed for further treatment.
Polishing step
In the last step of the effluent treatment, remaining suspended solids, organic matter and nutrient phosphorus are removed. This part of the treatment is considered a polishing or fine-cleanup process. A small quantity of precipitation chemicals is used in order to promote flocculation which enhances the removal of phosphorous. Flocks are formed in the flocculation chamber and then settled in the following sedimentation process. The sludge generated in this processes is usually pumped back to the primary sedimentation process. This process has a small influence on the overall concentration of radionuclides in the waste water.
Retention time in the effluent treatment
The retention time of a water particle in the plant is typically 15-30 hours. However, there exist plants, like Ryaverket in Gothenburg, where the retention time is only 8 hours because the water flow is high in relation to the basin volumes. In some plants, for example the Källby plant in Lund, the outgoing flow is led into a system of dams which makes the total retention time for a water particle longer, 4 to 5 days.
3.2 Sludge treatment
Sludge removed in the primary (primary sludge) and secondary (secondary sludge) sedimentation is conveyed to a thickener where the sludge volume is reduced by a factor of two to three and the solids concentration increases proportionally. This leads to a corresponding increase of the radionuclide concentrations. The residence time of a sludge particle in the process is around one day and hence a substantial reduction of the activity of short life radionuclides, such as Tc-99m (6 hours) and I-131 (8 days) will take place.
After thickening the sludge is conveyed to a digestion chamber where the sludge is stabilised by decomposition of organic matter to reduce odour and pathogens. The retention time in the digester is typically 20 days and hence there will be a substantial reduction of the activity of short live
radionuclides. Releases to air of C-14 and volatile radionuclides, such as I-131, in principle can take place at this stage, although the potential of releases will depend on the chemical state in which these radionuclides are bound.
After digestion the sludge is dewatered by physical processes such as air drying and centrifugation. This process has a short duration and therefore this stage is unlikely to result in any significant
additional decay to radionuclides still present after stabilisation. Dewatering reduces further the sludge volume. The concentration of solids in the final sludge is around 25 %, but in some plants, such as the plant in Umeå, further drying is practiced and the solids concentration can reach 90-95 %.
Retention time in the sludge treatment
The overall retention time of a particle in the sludge treatment is typically 20-30 days. In plants with nitrogen removal the retention time is longer than in plants without this process.
4 The screening study
The aim of the screening study was to identify the radionuclides and exposure pathways of potential concern and thus to reduce the scope of further detailed assessments. To achieve this, conservative dose estimates were made. Exposure estimates resulting from the screening model, therefore, are not to be seen as predictions of actual risks. The output of the screening study is merely a list of
radionuclides and exposure pathways which require a more realistic consideration.
The method applied in the screening study is based on the generic methodology recommended by IAEA (2001) and represents a simple ‘no dilution’ model. Such models represent the first stage in the iterative approach to exposure modelling (IAEA 2001). Further consideration by using more detailed models is, according to this publication, only required if the doses resulting from the ‘no dilution’ model exceed the applicable dose criterion.
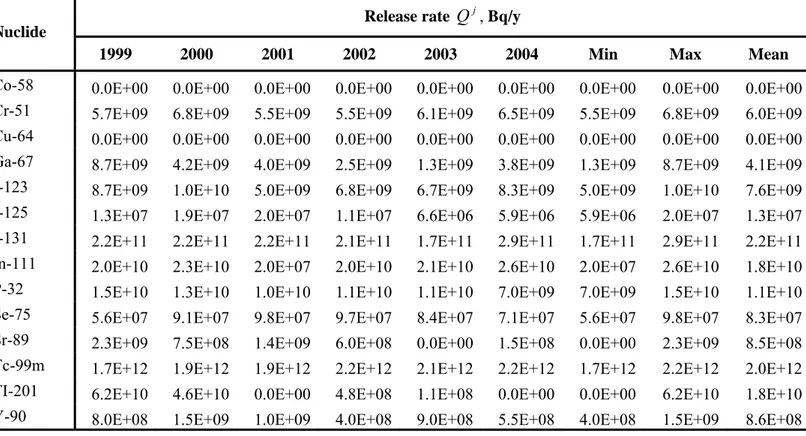
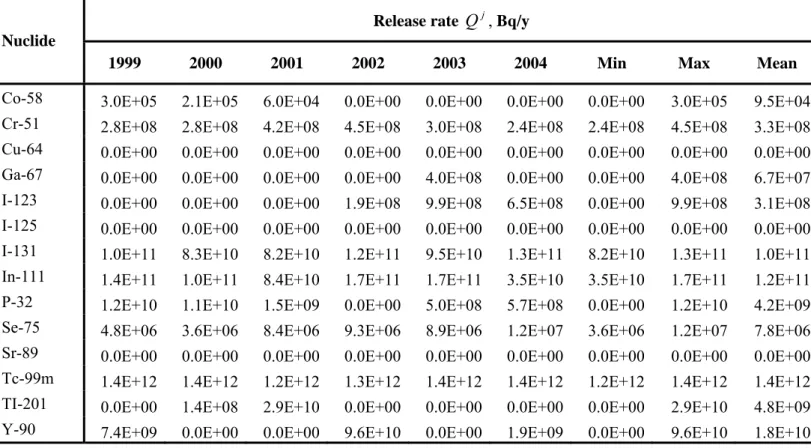
The study was performed for all sewage plants which receive releases from different hospitals
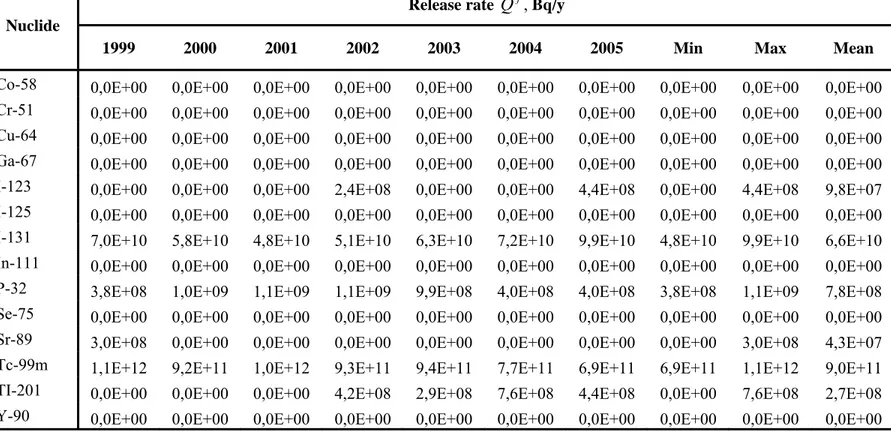
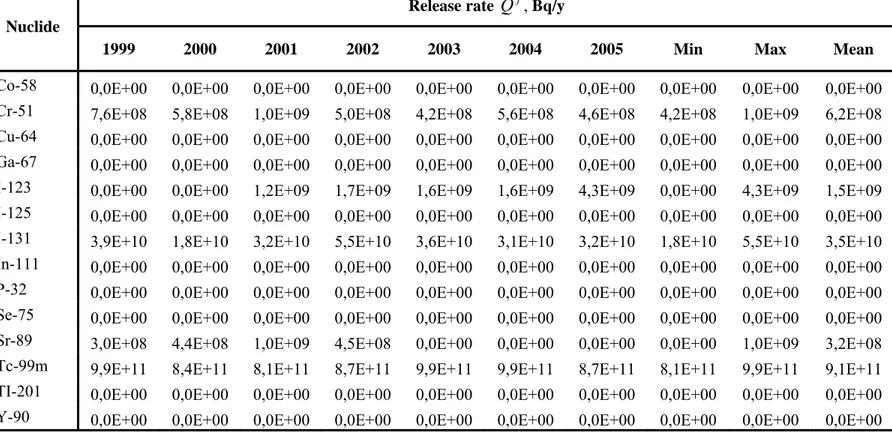
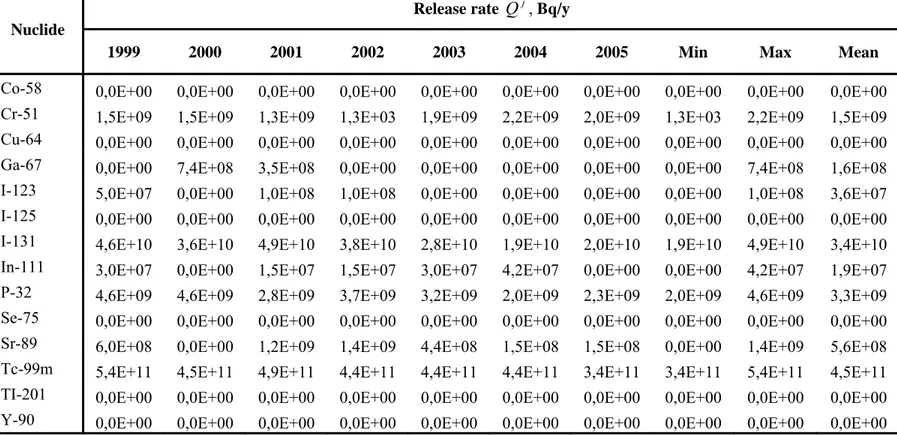
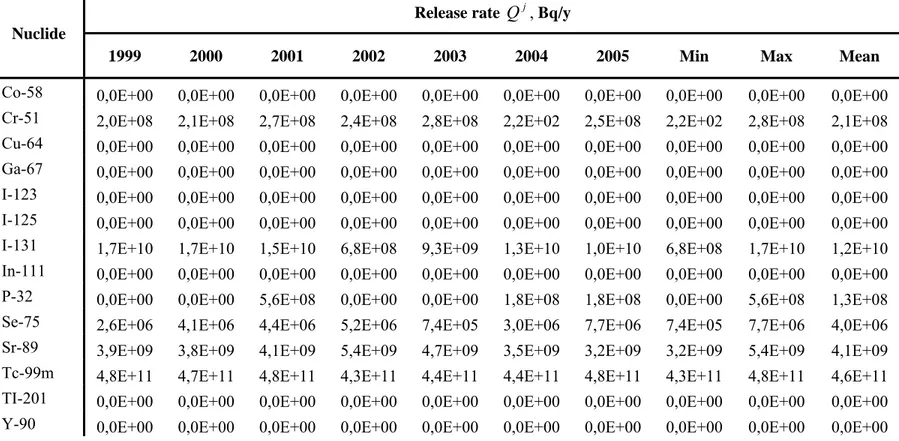
performing both radiotherapy treatments and diagnostics (see Table 4.1). The maximum annual release rates in the period 1999-2004 were used in the calculations. These are summarised for some of the sewage plants in Table 4.2. Detailed data for all plants are provided in Appendix A. These annual release rates were estimated from available information of activities administered to patients at the hospitals which release to these plants, assuming that all administered activity will reach the sewage plants.
Table 4.1. Sewage plants included in the screening study and hospitals with radionuclide discharges to these plants.
Sewage plant, City Hospitals
Huddinge Universitetssjukhus Karolinska Sjukhuset
St Görans Sjukhus Henriksdal, Stockholm
Södersjukhuset Stockholm
Ryaverket, Gothenburg Sahlgrenska Universitetssjukhuset Ön, Umeå Norrlands Universitetssjukhus Kungsängsverket ,Uppsala Akademiska sjukhuset
Källby, Lund Universitetssjukhuset
Centrala Reningsverket, Kristianstad Centralsjukhuset i Kristianstad Duvbacken, Gävle Länssjukhuset Gävle-Sandviken Ekeby, Eskilstuna Mälarsjukhuset
Fillanverket, Sundsvall Sjukhuset i Sundsvall Gässlösa, Borås Borås Lasarett Göviken, Östersund Östersunds sjukhus Käppalaverket, Lidingö Danderyds sjukhus Koholmen, Karlskrona Blekingesjukhuset
Sewage plant, City Hospitals
Öresundsverket, Helsingborg Helsingborgs lasarett Simsholmen, Jönköping Länssjukhuset Ryhov
Sjölunda, Malmö Universitetssjukhuset Malmö Sjöstadsverket, Karlstad Centralsjukhuset Karlstad Skansverket, Uddevalla Uddevalla sjukhus Sundet, Växjö Centrallasarettet Växjö Tegelviken, Kalmar Länssjukhuset Kalmar Uddebo,Luleå Sunderby sjukhus
Table 4.2. Maximum yearly release rates of radionuclides to the studied sewage plants, estimated from treatments reported during 1999-2004 for the hospitals with radionuclide releases to these plants (source: www.ssi.se).
Release rate
Q
j, Bq/y NuclideHenriksdal Ryaverket Ön Kungsängsverket Källby Co-58 0,0E+00 0,0E+00 0,0E+00 3,0E+05 9,0E+04 Cr-51 9,7E+08 6,8E+09 2,3E+09 4,5E+08 2,1E+07 Cu-64 3,7E+08 0,0E+00 0,0E+00 0,0E+00 0,0E+00 Ga-67 2,0E+08 8,7E+09 0,0E+00 4,0E+08 5,6E+08 I-123 2,8E+10 1,0E+10 3,1E+10 9,9E+08 1,8E+10 I-125 2,2E+07 2,0E+07 6,8E+06 0,0E+00 1,1E+07 I-131 6,3E+11 2,9E+11 5,9E+10 1,3E+11 2,9E+11 In-111 2,9E+10 2,6E+10 1,1E+10 1,7E+11 2,6E+10 P-32 1,3E+10 1,5E+10 7,9E+08 1,2E+10 1,6E+10 Se-75 5,0E+07 9,8E+07 4,2E+07 1,2E+07 5,2E+06 Sr-89 6,2E+09 2,3E+09 0,0E+00 0,0E+00 5,3E+09 Tc-99m 6,2E+12 2,2E+12 2,0E+12 1,4E+12 3,2E+12 TI-201 7,5E+07 6,2E+10 3,4E+08 2,9E+10 0,0E+00 Y-90 5,7E+09 1,5E+09 2,9E+09 9,6E+10 1,1E+10
4.1 The screening method
The screening approach consists of deriving pessimistic estimates for the annual doses to the general public and sewage workers and comparing these estimates with a screening dose level, in our case set to 10 µSv/a, which is the internationally agreed exemption level (EU). If, for a specific pathway, the calculated doses are equal to or below the screening level, it can be concluded that this pathway does not have a significant contribution to the exposure and no further assessment is required. On the other hand, if the calculated doses are above the screening level, more realistic exposure assessments are required.
Two calculation cases were considered (see Figure 4.1):
1. Case 1 - no retention in the sewage sludge. In this case it was assumed that the radionuclides released from the hospitals are not retained in the sewage sludge, i.e. all radionuclides entering the sewage system will reach the final recipient of the wastewater. Further, it was assumed that no dilution of the wastewater discharged from the plant occurs before the water is used. This maximizes the estimates of activity concentrations in water. The calculation endpoints in this case were: doses to an adult from ingestion of contaminated water and fish.
2. Case 2 - full retention in the sewage sludge. In this case it was assumed that the
radionuclides entering the sewage plant are fully retained in the sludge, which maximizes the estimate of the activity concentration in the sludge. The calculation endpoints in this case were: doses to a sewage worker from external exposure to the sludge and from incorporation of sludge particles via inhalation; doses to an adult from ingestion of food produced in an agricultural land where the sludge has been used as fertiliser. The latter endpoint also covers the disposal of sludge on a landfill used for agriculture after its closure, because it was conservatively assumed that crops are grown directly on the sludge, i.e. dilution from mixing with soil is neglected.
Figure 4.1. Schematic representation of the approach used in the screening study with two calculation cases: Case 1 with no retention in the sludge and Case 2 with full retention in the sludge. In both calculation cases, reduction of activity concentrations due to radioactive decay is not taken into account. Since most of the released radionuclides are relatively short lived, this is a conservative and in some cases (Tc-99m) a very conservative assumption. This conservative approach, however, is consistent with the aim of this screening study to only identify possible pathways and radionuclides of concern and not to derive realistic dose estimates.
The screening model for these calculation cases and the parameters used are described in Appendix B. Annual releases Retention in sludge considered? Maximal Concentration in water Maximal Concentration in sludge Dose to public from
water ingestion
Dose to public from fish ingestion
Dose to sewage worker (external and
inhalation) Dose from use of sludge as fertiliser (food ingestion) Doses ≤ 10µSv/a? sludge? Realistic assessments required Dose pathway insignificant – no further assessment required
No – Case 1 Yes – Case 2
4.3 Results and Discussion
Results for the screening model are provided in Appendix B. A summary is given in Tables 4.3 and 4.4 which present Risk Quotients defined as the ratio between calculated doses and the dose criterion (10 µSv/a). Only the cases with RQ above 1, corresponding to potentially significant exposure pathways, are shown in Tables 4.3 and 4.4. The tables provide the maximum values of the Risk Quotients for the different plants considered in Appendix B.
Despite the very conservative assumptions made in the screening study, for most of the radionuclide and pathways, the calculated doses are well below the screening criterion. Hence, only a few
radionuclide-pathway combinations can be considered as potentially significant, which are discussed below in more detail for each calculation case.
Table 4.3. Maximum Risk Quotients, RQ (dimensionless), for the exposure pathways in Case 1 (no retention in sludge). Only radionuclides with RQ values above 1 are shown.
Nuclide RQ Water ingestion RQ Fish ingestion I-131 37 74 In-111 < 1 87 P-32 < 1 560 Y-90 < 1 1,3
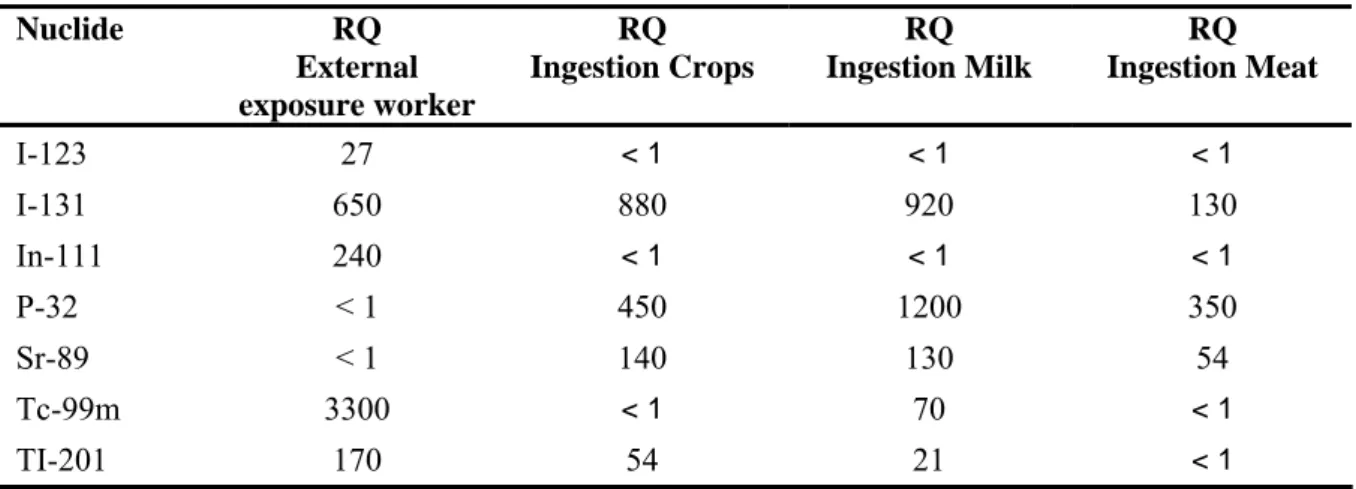
Table 4.4. Maximum Risk Quotients, RQ (dimensionless), for the exposure pathways in Case 2 (full retention in sludge). Only radionuclides with RQ values above 1 are shown.
Nuclide RQ External exposure worker RQ Ingestion Crops RQ Ingestion Milk RQ Ingestion Meat I-123 27 < 1 < 1 < 1 I-131 650 880 920 130 In-111 240 < 1 < 1 < 1 P-32 < 1 450 1200 350 Sr-89 < 1 140 130 54 Tc-99m 3300 < 1 70 < 1 TI-201 170 54 21 < 1
Discussion of results for Case 1 - no retention in the sludge
The calculation results for the case with no retention in the sewage sludge are presented in Tables B-11 – B-31 in Appendix B. From Table 4.3 it can be seen that I-131, In-B-111, P-32 and Y-90 are the only radionuclides with RQ above 1. However, it has to be taken into account that in the calculations a direct use of the water discharged from the plant was assumed, i.e. dilution from mixing with the recipient water and reduction of the activity by radioactive decay were not considered. To account for these reduction factors, it is necessary to consider the specific conditions at the final recipient of the wastewater discharged from the sewage plant. It can be expected that the reduction factors will vary
widely from case to case, since different sewage plants discharge to recipients with very different properties (see Table 3.1 in Section 3), ranging from small rivers to open coastal areas.
As an example, the reduction factor for the case of the Kungsängsverket sewage plant in Uppsala with discharges into Fyrisån was estimated by dividing the annual average flux of Fyrisån (4.73E+8 m3/a)
by the water flux into the plant (1.73E+7 m3/a) used in the calculations of the activity concentrations
in water. This gives a reduction factor of 27.3 which is not sufficient for reducing the RQ for I-131, In-111 and P-32 below 1 (see Table 4.3).
In reality, a further reduction of the doses from water and fish ingestion might take place due to the removal of radionuclides from the water during the wastewater treatment. This is not taken into account in this calculation case, since it is assumed that there is no retention in the sludge. A large variation in the removal efficiency of the waste treatment processes has been reported for different radionuclides (Titley et al. 2000). For example for I-131, values of removal efficiencies varying from 5 to 90 % have been reported (Erlandsson et al. 1978, 1979, Ingemansson et al. 1981).
Discussion of results for Case 2 - full retention in the sludge
The calculation results for the case with full retention in the sewage sludge are presented in Tables B-32 – B-73 in Appendix B. As for Case 1, only a few radionuclides can give rise to significant
exposures (see Table 4.4).
The exposure of sewage workers via inhalation was insignificant for all studied radionuclides, while the external exposure showed significant values for several gamma emitters: I-123, I-131, In-111, Tc-99m and Tl-201. Two of them, I-123 and Tc-Tc-99m, have a very short decay half-life, 13,2 and 6,02 hours respectively, as compared with the residence time of the sludge in the sewage treatment (around 30 days). Therefore, their real exposure can be expected to be much lower. Also, the radionuclides are usually not fully removed with the sludge as it was assumed, and therefore the concentrations in the sludge as well as the external exposure will be lower. Finally, the dose factors used for the calculation of the external doses might still be over-conservative, since these assume an infinite lateral and vertical geometry, while in reality the sources of exposure are of limited size. These issues will be discussed in more detail in Section 6 where realistic assessments are presented for this exposure pathway.
The screening study showed that the exposure resulting from ingestion of food grown in contaminated sludge could be significant only for five radionuclides: I-131, P-32, Sr-89, Tc-99m and Tl-201. Table 4.5 shows recalculated RQ values taking into consideration radioactive decay and dilution from mixing with uncontaminated soil. This was done by multiplying the sum of RQ in Table 4.4 (which assumes that one person is exposed to all ingestion pathways simultaneously) by appropriate correction factors.
The correction factor for decay was estimated by assuming that there is a time period of at least 60 days before the exposure can take place: 30 days for the sludge residence time in the sewage plant and 30 days corresponding to the minimum time needed to produce the different types of foods, assuming that sludge with the average activity based on annual releases to the plant and total sludge production is applied before the growing season starts.
Direct cultivation in sludge, as it was assumed in the screening calculations, is not a normal practice. Commonly, around 10 kg DW/m2 of sludge is applied to land to restore its fertility (Dickson 1994).
Assuming that the applied sludge is homogeneously distributed in a soil layer of 20 cm with a density of 1500 kg/m3, a dilution factor of 0.03 is obtained.
uncontaminated soil would do the same for the doses from Tl-201. The combination of both reduction factors would be sufficient to categorize this exposure pathway as insignificant for all studied
radionuclides, except for P-32 and Sr-89, which still show values slightly above the screening
criterion. At the same time, it should be taken into account that the applied reduction factors were also conservatively estimated. Moreover, it is unlikely that a long term exposure from this pathway would take place at the same place, exposing the same group of individuals. Hence, this exposure pathway seems to be insignificant and in any case have a lower significance than the exposure of sewage workers. Nevertheless, it has to be taken into account that this exposure pathway potentially may affect relatively large population groups in comparison to the small group of workers at a sewage plant.
Table 4.5. Risk Quotients, RQ (dimensionless), for the ingestion pathways in Case 2 (full retention in sludge) recalculated from the sum of RQ in Table 4.3 (RQ Max), taking into consideration radioactive decay before the exposure starts (RQ Decay), dilution by mixing with soil (RQ Dilution) and both decay and dilution (RQ Decay and Dilution).
Nuclide RQ Max RQ Decay RQ Dilution RQ
Decay + Dilution I-131 1930 11 58 < 1 P-32 2000 109 60 3.3 Sr-89 324 229 9.8 4.3 Tc-99m 70 < 1 2.1 < 1 Tl-201 21 < 1 < 1 < 1
5 Dynamic model of the turnover of radionuclides in a sewage plant
The screening study showed that realistic assessments of the doses to sewage workers are needed, especially for those radionuclides frequently used in nuclear medicine, such as I-131 and Tc-99m. For doing this, more realistic estimates of the radionuclide concentrations in the sludge are required. Although radionuclides are released from hospitals during the whole year, their releases are not continuous and constant, but occur as pulses during a few days. This is particularly true for excreta from patients that have received high doses for therapeutic purposes. This means that a steady state situation with equilibrium radionuclide concentrations will not exist at the sewage plant. To be able to make predictions of the radionuclide concentration in the sludge, the dynamic model LUCIA is developed to address the dynamic behaviour of radionuclides in the plant.
Developing the dynamic model LUCIA has several purposes:
• Using the model to compare releases occurring as pulses to continuous releases will (1) allow to identify the differences in results arising, (2) to derive conclusions on whether dynamic modelling is required and (3) whether a simpler static model could be used.
• An important parameter for each model addressing releases from hospitals is the distribution of the radionuclides between the discharged water and the sludge. This will be highly dependent on the radionuclides considered and will also be influenced by details of the treatment process. The best way of establishing a data basis for this purpose is to carry out measurements of the
radionuclide distribution in the sewage plants. Due to pulse pattern of the releases, a dynamic model is needed to derive parameter values for distribution coefficients from these measured data by comparing model prediction to measurements.
• A dynamic model can also be used to assess consequences from accidental releases.
This model was developed for the sewage plant Kungsängsverket (Uppsala). Nevertheless, the model can also be applied for other plants of similar design (see Appendix C).
5.1 The conceptual model
A detailed scheme of the technological process used in the Kungsängsverket sewage plant is shown in Figure 5.1. The processes are the same as described in Section 3, but the different treatment steps take place simultaneously in several basins and tanks of different volume. There are three main technical lines, corresponding to different pathways for the incoming water. For the purpose of the model such level of detail is unnecessary and therefore all basins and tanks of the same type were treated as single compartments. This is indicated by the rectangular boxes in Figure 5.1.
The LUCIA conceptual model is shown schematically in Figure 5.2. The model consists of 9
compartments, 7 of which correspond to the rectangular boxes in Figure 5.1: R1, R2, R3, R4, T1, T2 and T3 and two (R1sed and R3sed) additional compartment that correspond to the precipitated sludge in the sedimentation basins (R1 and R3). Each of the 9 compartments represents a state variable with an associated radionuclide inventory as indicated in Table 5.1, where also the associated plant
components are indicated. The final polishing step is described in a more simplified form in the model, where precipitation of sludge is considered to be insignificant in normal conditions and therefore not considered.
The arrows in the conceptual diagram represent the radionuclide fluxes between the different
compartments, which are driven by the fluxes of water and sludge in the plant. Most fluxes are in one direction, from the inlet to the outlet of the plant. The only exceptions are the fluxes from the
for biological treatment. These fluxes correspond to the pumping of a fraction of the secondary sludge into the basins for biological treatment to provide bacterial stock needed for the treatment.
Model assumptions
The model describes the plant as a series of interconnected compartments. A main assumption of this type of models is that the radionuclides and other species, such as water, solid particles and organic material that enter a compartment get instantaneously fully mixed in the compartment. At the same time, it is assumed that the transfer rate of the radionuclides from one compartment to another is proportional to the inventory of radionuclides in the donor compartment.
Primary sedimentation R1 Secondary sedimentation R3 Polishing R4 Preliminary treatment. Thickener storage Centrifuge storage Digester Primary sludge Biological treatment R2 Return sludge To preliminary treatment Secondary sludge Silo sink B C A Chemicals Chemicals Sludge thickening T1 Sludge digestion T2 Sludge dewatering T3
Table 5.1. Compartments in the model, associated plant components and definition of the corresponding state variables.
Compartment Plant components State variable
R1 Primary sedimentation basins Water phase
Total radionuclide inventory in dissolved form and absorbed to suspended particles
R1sed Primary sedimentation basins Precipitated sludge
Radionuclide inventory in the precipitated sludge
R2 Basins for biological treatment Total radionuclide inventory in dissolved form and absorbed to suspended particles
R3 Secondary sedimentation basins Water phase
Total radionuclide inventory in dissolved form and absorbed to suspended particles
R3sed Secondary sedimentation basins Precipitated sludge
Radionuclide inventory in the precipitated sludge
R4 Sedimentation basin for final polishing
Water phase
Total radionuclide inventory in dissolved form and absorbed to suspended particles
T1 Thickener, sink and silo Total radionuclide inventory in the components
T2 Digester Total radionuclide inventory in the digester
T3 Centrifuge and sludge storage Total radionuclide inventory in the components
The model assumes steady state conditions for the wastewater, solids and organic material in the system. This means that the levels of these species are kept constant with time in all compartments. If the fluxes of a species into a compartment increase or decrease, then the fluxes leaving this
compartment will increase or decrease proportionally, so that the levels in the compartments remain constant. This assumption is consistent with the way sewage plants function in normal situations. However, in special conditions, like in case of a storm, it could be that it is not possible to keep a constant level in the basins. Hence, the model cannot be directly applied, without modifications, to such situations. The assumption of steady state does not apply for the radionuclides, which levels are allowed to vary without restrictions. This way the model can be applied to any type of releases, including pulse releases.
Another assumption is that losses of radionuclides from the plant occur only via discharged water and sludge that is transported away from the plant. Although losses to air may occur, especially for volatile radionuclides as I-131, these are conservatively neglected.
Figure 5.2. Conceptual representation of the LUCIA conceptual model for the Uppsala sewage plant. The boxes correspond to model compartments (see Table 5.1) and the arrows to
radionuclide fluxes between compartments.
5.2 Mathematical model and parameters
The mathematical model of LUCIA consists of a system of ordinary differential equations (ODE). These represent the mass balance in the different compartments defined in Table 5.1. The equations used are provided in Appendix C and allow for the estimation of the concentration of radionuclides in water and sludge depending on the radionuclide concentration in the plant inlet. The model was implemented using the software package Ecolego (Avila et al. 2003).
Model parameters are defined as probability distributions. Parameters relating to the treatment processes are derived from data measured in the Kungsängsverket sewage plant, Uppsala, during 2003-2004. Parameter values used are described in Section C-3 of Appendix C.
The only radionuclide specific parameters required by the model are the distribution coefficients KdR1 and KdR2. These represent, for the radionuclides of interest, the distribution coefficients (Kd) between water and sludge in the compartments R1 and R2, respectively. The distribution coefficient is the ratio between the radonuclide concentration in the soil phase (in Bq/kg dry weigth) and the
radionuclide concentration in the water (in Bq/m3). Their values depend on the concentration of
suspended solids and the chemical conditions.
Although an extensive literature review was carried out in this study, distribution coefficients for sludge were not found for any of the elements of interest. Instead, Kd values reported for organic soils were used, which to some extend can be considered as representative for sewage sludge, consisting mainly of organic material. Details of the values used are given in Section C-3 of Appendix C.
5.3 Sensitivity analysis
The sensitivity of the model to variation in the model parameters was studied using the software package Eikos (Ekström et al. 2006). The sensitivity study was carried out for I-131, which is one of the significant radionuclides for the exposure of workers (see screening study in Section 4). The studied endpoints were the concentration of I-131 in the digested sludge (T2 in Figure 5.2) and the
R1 R2 R3 R4 T1 T2 T3 R1 sed R3 sed
efficiency (Eff) of the wastewater treatment, defined as the activity concentration in the water coming into the plant divided by the activity concentration in the water released from the plant.
The results of the sensitivity analysis are presented in Section C-4 of Appendix C. They show that the predictions of the concentration in the digested sludge are highly sensitive to the distribution
coefficient for the primary sedimentation (KdR1), slightly sensitive to the distribution coefficient for the biological treatment (KdR2) and practically insensitive to all other model parameters, when considered individually. The same is valid for the efficiency of the wastewater treatment, but this endpoint was also highly sensitive to the water flux Q, since this parameter determines the residence time of the I-131 in the wastewater treatment.
The contribution of the model parameters to the variance of the predictions was estimated using Total Sensitivity Indexes calculated with the Extended Fourier Amplitude Sensitivity Test, EFAST (Ekström et al. 2006). This method takes into account interactions between parameters. The obtained results indicate that 46 % of the variance in the predictions of the concentrations in digested sludge is explained by the variance of the KdR1 and the rest by other parameters, but no single parameter contributes with more than 6 %.
These results from the sensitivity analysis imply the important conclusion that reasonable values for the distributions coefficients and for the water flux are primarily required in order to arrive at realistic exposure assessments.
6 Realistic dose assessments
This section presents the results of realistic assessments of doses to sewage workers using the LUCIA model for the radionuclides identified as particularly relevant in the screening study (Section 4): I-123, I-131, In-111, Tc-99m and Tl-201. The only exposure pathway considered in this section is the
external exposure to radionuclides in the sewage sludge. The inhalation pathway is not included, since the screening study showed that this is not a significant pathway. All calculations in this section are performed for the Kungsängsverket sewage plant (Uppsala).
The realistic dose assessments are carried out by performing probabilistic simulations with the LUCIA model to obtain probability distributions of the sludge concentrations. The concentrations in the digested sludge are used, since according to the information provided by the sewage plants, the workers can be exposed to the sludge mainly during and after the digestion process. The probability distributions of the LUCIA model parameters given in Appendix C are used. Probability distributions of the external doses to workers are obtained from the probability distributions of sludge
concentrations using the same equations and parameters values as in the screening study (Section 4). The goal of this section is to analyse the importance of the dynamics of the releases by comparing a continuous release case to pulse releases (Section 6.2) and to provide and discuss estimates for the worker doses (Section 6.2). These results and their discussion provide a basis for applying the LUCIA model to other exposure pathways and treatment plants in Section 7.
6.1 Investigation of the dynamics of releases
Constant releases rate were used as input to the LUCIA model, set at the maximum value of the yearly radionuclide releases in the period 1999-2004 (Table 4.2). In reality the releases occur as pulses, but since the workers are exposed continuously, the doses will be proportional to the yearly average of the sludge concentrations. To study the potential effect of the release dynamics, a simulation was carried out for a scenario with the same total yearly release, but occurring as three-days release pulses at the beginning of each month.
The values of the mean concentration in the sludge obtained for this scenario were close to the values obtained for the scenario with continuous releases at a constant rate (see Figure 6.1). In the scenario with constant release rate, a constant level in the digested sludge was achieved in about 30 days. The concentration at equilibrium was the same as the median value obtained for the scenario of pulse releases, though the mean value was slightly higher. Normally, the pulse releases will occur more frequently and at a lower release rate. Hence, the fluctuations will probably be lower and the mean values for both scenarios will be even closer.
It can therefore be concluded, that for estimations of the annual doses to sewage workers the constant release scenario can be used. However, for comparison with measured data it is necessary to take into account the dynamics of the releases. It can be seen from Figure 6.1 that depending on when the measurements are done, it is possible to obtain values that differ by a factor of 10.
0 50 100 150 200 250 0 50 100 150 200 250 300 350 400 Time days C oncT2 Bq/ k g dw ConcT2 Pulse Mean Median ConcT2 Const
Figure 6.1. Values of the concentrations in the digested sludge (ConcT2) simulated with the LUCIA model for two scenarios: one with a constant release rate (ConcT2Const) and one with pulse releases (ConcT2Pulse). The median and mean values for the scenario with pulse releases are also shown.
6.2 Results and discussion
The results of the simulations are summarised in Tables 6.1 and 6.2. The realistic estimates of the sludge concentrations and external doses to sewage workers are one or more orders of magnitude below the values obtained in the screening study (Table C-16 in Appendix C). For I-123, I-131, Tc-99m and Tl-201 the mean and median values are below the exemption level of 10 µSv/a. For all of these radionuclides, except I-131, even the 95 percentile of the distribution is below the exemption level. In the case of I-131, the 95 percentile is only slightly above 10 µSv/a. The results for In-111 are well above the exemption level and in some cases above 100 µSv/a. This is in general valid for the three variant calculations performed, i.e. using three alternative probability distributions for the Kd of In, corresponding to the Kd of Cd, Pb and Sn.
A more clear idea of the likelihood of receiving doses which exceed the exemption level and the dose constraint can be obtained from Table 6.3. This table presents calculated values of the probabilities of the estimated doses exceeding these levels. For I-123, Tc-99m and Tl-201 these probabilities are practically zero. For I-131 the probability of the dose exceeding the dose constraint is also practically nil, while there is a 0.2 probability of exceeding the exemption level. In the case of In-111, the probability of exceeding the exemption level is high for the three calculation cases considered. At the same time, for this radionuclide the value of the probability of the doses exceeding the dose constraint depends markedly on which probability distribution is used for the Kd.
Hence, for In-111 and to a lesser extend also for I-131, it is important to obtain direct estimations of the Kd values. This can be done by performing sorption studies in the laboratory using sludge and water samples taken from the sewage plants, or even better, by conducting in-situ studies at the sewage plants. The in-situ studies could consist of measuring radionuclide concentrations in water and sludge before and after different water and sludge treatment processes. The measurements should be done at several points in time, when it is known that patients have been treated with these
radionuclides. The values of releases, calculated from the activities administered to the patients, can be used as inputs to the LUCIA model. The model can then be used to obtain predictions of the measured concentrations. An optimisation procedure can subsequently be used for estimating Kd values that provide better agreement between the model predictions and the measured data.
Table 6.1. Values of the concentration in digested sludge (Bq/kg DW) estimated from probabilistic simulations with the LUCIA model performed for the Kungsängsverket sewage plant, Uppsala.
Nuclide Median Mean Std. 5% 95%
I-123 1.6E-02 2.6E-02 2.6E-02 2.9E-03 8.1E-02
I-131 1.1E+2 1.6E+02 1.4E+2 2.0E+1 4.7E+02
Tc99m 4.5E-01 7.7E-01 9.0E-01 1.1E-01 2.7E+00 Cd 1.1E+03 1.3E+03 9.5E+02 1.3E+02 3.0E+03 Pb 3.2E+03 3.3E+03 7.8E+02 2.2E+03 4.7E+03 In-111
Sn 1.6E+03 1.7E+03 6.9E+02 6.8E+02 2.9E+03 Cd 2.1E+02 2.4E+02 1.8E+02 2.4E+01 5.6E+02 Pb 6.1E+02 6.3E+02 1.5E+02 4.2E+02 8.9E+02 TI-201
Sn 3.0E+02 3.1E+02 1.3E+02 1.3E+02 5.5E+02 Note: For In-111 and Tl-201 values are given for three calculation variants using different distributions for the Kd, corresponding to the Kd of Cd, Pb and Sn
Table 6.2. Values of the doses to sewage workers (Sv/a) estimated from probabilistic simulations with the LUCIA model performed for the Kungsängsverket sewage plant, Uppsala.
Nuclide Median Mean Std. 5% 95%
I-123 2.9E-10 4.5E-10 4.5E-10 5.0E-11 1.4E-9
I-131 4.4E-06 6.3E-06 5.9E-06 8.2E-07 1.9E-5
Tc99m 6.7E-09 1.2E-08 1.3E-08 1.7E-09 4.0E-08 Cd 4.8E-05 5.7E-05 4.2E-05 5.7E-06 1.3E-04 Pb 1.4E-04 1.5E-4 3.4E-05 9.7E-05 2.1E-04 In-111
Sn 7.0E-05 7.3E-05 3.0E-05 3.0E-5 1.3E-04 Cd 2.1 E-06 2.4E-06 1.8E-06 2.4E-07 5.7E-06 Pb 6.1E-06 6.3E-06 1.5E.06 4.2E-06 9.0E-06 TI-201
Sn 3.0E-06 3.2E-06 1.3E-06 1.3E-06 5.5E-06 Note: For In-111 and Tl-201 values are given for three calculation variants using different distributions for the Kd, corresponding to the Kd of Cd, Pb and Sn.
Table 6.3. Probabilities that the calculated doses exceed the exemption level (10 µSv/a) and the dose constraint (100 µSv/a) estimated from probabilistic simulations with the LUCIA model performed for the Kungsängsverket sewage plant using the maximum yearly release during the period from 1999 to 2004.
Nuclide P dose > 10 µSv/a P dose > 100 µSv/a
I-123 ≈ 0 ≈ 0 I-131 0.2 ≈ 0 Tc99m ≈ 0 ≈ 0 Cd 0.9 0.16 Pb ≈ 1 0.94 In-111 Sn ≈ 1 0.18 Cd 0 ≈ 0 Pb 0.02 ≈ 0 TI-201 Sn < 0.01 ≈ 0
Note: For In-111 and Tl-201 values are given for three calculation variants using different distributions for the Kd, corresponding to the Kd of Cd, Pb and Sn.