SKI Report 2003:06
Research
Uniaxial and Multiaxial Creep Testing
of Copper
Pertti Auerkari
Stefan Holmström
Juha Veivo
Jorma Salonen
Pertti Nenonen
Anssi Laukkanen
December 2003
SKI perspective
Background and purpose of the project
The integrity of the canister is an important factor for long-term safety of the repository for spent nuclear fuel. When the canister is placed in the deposition hole it will be subjected to mechanical loads due to the hydrostatical pressure and the swelling pressure of the bentonite surrounding it. Copper is a soft material and will creep and lay down on the ductile iron insert due to the loads. The creep process will go on until the bentonite is fully saturated. During this time period the creep properties of the copper canister are very essential for its integrity. The copper material may creep but is not supposed to fracture. SKB has investigated the creep properties of the Oxygen Free Copper with 40 – 60 ppm phosphorous, which is the proposed material for the canister, by carrying out different research projects regarding creep. The testing method used in all these projects is uniaxial creep test.
Some materials e.g. Nimonic has shown a huge difference in creep properties, especially creep fracture strain, when loaded uniaxial or multiaxial. The loading situation in the
repository is fairly uniaxial and a verification of possible differences between creep properties of copper with uniaxial compared to multiaxial loading seemed necessary.
In order to understand the effect of multiaxiality on creep properties, SKI started a project at VTT investigating creep properties of OFP-copper both by uniaxial and multiaxial loading. In addition the effect of variation in material parameters (like A and n of the Norton law) and effect of extended multiaxial testing on creep response have also been studied. A comparison to existing creep data from reference sources has also been performed.
Results
The results of the project suggest a lower minimum creep life when creep is multiaxial. Even predicted uniaxial creep life, when assessed from multiaxial testing, is lower than predicted uniaxial creep life using uniaxial testing.
The material had higher oxygen content than SKB-s reference material, which may have affected the results. Testing with a material with oxygen content within OFP-coppers specified limits is highly recommended.
The results of the project will be a useful tool in the highly challenging aspect of extrapolating results from creep tests running in limited time to prediction of creep life for very long times.
Effects on SKI work
The study will continue and be a basis for SKI research projects in future, and will also be used in other SKI projects dealing with modelling creep behaviour of copper. The study will also be used in SKI reviews of SKB’s RD&D-programme.
Project information
Responsible for the project at SKI has been Behnaz Aghili. SKI reference: 14.9-000561/00104 and 14.9-020455/02117.
SKI Report 2003:06
Research
Uniaxial and Multiaxial Creep Testing
of Copper
Pertti Auerkari
Stefan Holmström
Juha Veivo
Jorma Salonen
Pertti Nenonen
Anssi Laukkanen
VTT Industrial Systems
P.O. Box 1704
FIN-02044 VTT
Finland
December 2003
SKI Project Number XXXXX
This report concerns a study which has been conducted for the Swedish Nuclear Power Inspectorate (SKI). The conclusions and viewpoints presented in the report are those of the author/authors and do not necessarily coincide with those of the SKI.
Summary
Multiaxial (compact tension, CT) creep testing has been performed for copper with 79 ppm phosphorus and 60 ppm oxygen. The test load levels were selected according to results from preceding uniaxial creep testing and FE analysis of the CT specimens. Interrupted testing was used for metallographic inspection of the specimens for creep damage. After 7900 h and 10300 h of testing at 150°C and 46 MPa (reference stress), inspected CT specimens showed cavity indications with a low maximum density (< 100/mm2) and a typical maximum dimension of less than about 1
µm near the notch tip. From previous experience on creep cavitation damage, the expected minimum life to crack initiation at the notch tip would be at least 40000 hours, but could be considerably longer because the cavity indications are suspected to originate at least partly from precipitates in specimen preparation.
The interrupted testing of CT specimens also showed a "segregation zone" along some grain boundaries, mainly near the notch tip. This zone appears to contain more P and O than the surrounding matrix, but less than the narrow grain boundary films that are already present in the as-new material. The zone is readily etched and shows a relatively sharp edge towards the matrix without an obvious phase boundary.
Using converted multiaxial (CT) testing results, the predicted isothermal uniaxial creep life at 150°C/46 MPa is about 1900 years. The corresponding creep life directly predicted from uniaxial data is 3100 years, when estimated from a parametric best fit expression according to PD6605. Although the two results are satisfactorily within a factor of two in time, the uncertainties in the extended extrapolations remain large. Further testing is recommended, with at least two creep enhancing factors present. Such testing could include notched creep testing at 120-180°C in a corrosive environment, and notched model vessel creep testing at elevated pressure. It is also recommended that longer term uniaxial and multiaxial testing is continued in parallel, since the available data base remains relatively modest for the material type.
Table of contents
1 Introduction...4
1.1 Copper overpack for repository canisters ...4
1.2 Objectives...5
2 Material and methods...5
2.1 Test material...5
2.2 Uniaxial creep testing ...5
2.3 Multiaxial testing ...6
2.4 Metallographic assessment ...7
2.5 Creep acceleration by multiaxial loading ...7
3 Results...9
3.1 Overview of creep testing program...9
3.2 Uniaxial creep testing ...9
3.3 Multiaxial (CT) creep testing ...12
1.4 Stress and strain analysis...13
1.5 Metallographic assessment ...17
1.5.1 As-received material ...17
1.5.2 Specimen CT-2, tested at 59 MPa / 150
°
C...181.5.3 Specimen CT-3, tested at 46 MPa / 150
°
C...204 Discussion ...25
4.1 Creep behaviour ...25
4.2 Grain boundary damage ...26
4.3 Life prediction from accelerated testing ...27
4.4 Additional factors promoting creep failure...30
5 Conclusions and recommendations ...31
1 Introduction
1.1 Copper overpack for repository canisters
Long term integrity is an essential requirement for the materials of repository canisters. This implies sufficient long term strength also in the copper overpack, which is designed to protect the canister against long term corrosion in a flooded repository. Considering the foreseen extensive service period, up to about 100000 years, creep damage is of potential interest in spite of relatively modest expected peak temperatures, close to 100ºC. Creep damage is known to be enhanced by tensile stress multiaxiality, but this effect has been previously studied at considerably higher temperatures. For the present work, SKI has provided a section of copper material that could be representative of the copper cylinder (Fig 1). The material contains a small amount of phosphorus for improved creep strength and ductility.
1.2 Objectives
This work aims to investigate
• the possibility of grain boundary cavitation as creep damage under accelerated testing conditions in comparison with the intended/expected service conditions, and
• potential consequences of multiaxial loading on creep damage and life of the copper overpack of the canister.
Interrupted testing of notched specimens up to 10 000 h are used to observe possible creep damage under multiaxial loading. The testing conditions are selected to promote creep damage towards the long-term end of the testing range. For comparison, uniaxial creep testing and a review of the available uniaxial creep testing experience are also performed to support life assessment and conversions between uniaxial and multiaxial testing results. Metallographic methods are used to identify signs of creep damage and other change from the reference state (as-new material).
2 Material and methods
2.1 Test material
For the present work, SKI has provided copper material in a form of a 23 kg ring section from a hot pressed copper cylinder (Fig 1; sample marked as "1/T17 TOPP"). Some available information on the microstructure and chemical composition, as also provided by SKI, is shown in Table 1.
Table 1. The grain size and chemical composition (by mass) of the test material (from a SKB copy of Kockums report 16/51/12347/00-01-14 with attachment of Outokumpu analysis). The chemical
analysis refers to cast no 258-3-1 (∅ 860 x 2630 billet, top position).
Marking Grain size P content O content
T17Topp 85 µm 79 ppm 60 ppm
2.2 Uniaxial creep testing
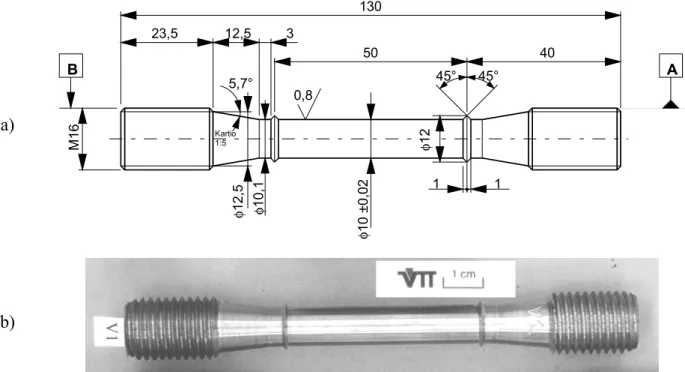
Three uniaxial creep testing specimens were machined with the longitudinal axis parallel to the tangential direction of the original ring section. For uniaxial tests, standard ∅ 10 mm cylindrical specimen with 50 mm gauge length (Fig 2) were used and tested in general accordance with EN-10290. The specimens were taken as close as possible to the location of the multiaxial specimens in the ring section.
a) 130 23,5 12,5 3 50 40 45° 45° 5,7° 0,8 1 1 M1 6 φ 12 ,5 φ 10, 1 φ 10 ±0, 02 φ 12 B A Kartio 1:5 b)
Fig. 2. a) dimensions and b) actual specimen (V1) for the uniaxial creep testing.
2.3 Multiaxial testing
For multiaxial testing, three compact tension (CT) specimens were machined from the copper ring section in such a way that the flat side of the specimens was parallel to the cross-section of the cylindrical capsule, with the notch cut radially from the outer surface of the capsule. The main dimensions (Fig 3) of the CT specimens are width W = 40 mm, thickness B = 20 mm, notch length/width ratio a/W = 0.5, and tip width V0 = 0.097 (± 0.002) mm.
H D1 D2 V2 V1 V0 L a M2 B W a) b)
Fig. 3. a) The compact tension (CT) specimen for multiaxial creep testing; the dimensions W, B, a/W and V0 are given in the text, b) specimen CT-2 before testing
The loading levels for the multiaxial tests were selected using FE stress analysis and the results from uniaxial testing (see below).
2.4 Metallographic assessment
For metallographic assessment of the microstructural effects and creep damage, scanning electron microscopy (SEM) was applied after some initial inspection by light optical microscopy (LOM). In case of CT specimens, main metallographic inspections were performed before testing, at times of test interruptions and after the last testing sequence. The inspections concentrated on the flat side of the specimen, in the vicinity of the notch tip, and were performed with and without etching of the specimen surface . After completing the test, the central section of the longest running CT specimen (after 10 300 h at 150ºC) was sectioned at the mid-thickness (in the plane of the specimen flat sides) to observe the microstructure at the location of maximum tensile multiaxiality in SEM.
Several etching and polishing methods were tested for the as-new material, to prepare metallographic surfaces of sufficient quality. Mechanical polishing did not provide sufficient resolution for small details in the microstructure, or the grain structure. On the other hand, usual copper etching was found to induce severe local dissolution from the grain boundaries and elsewhere. Electrolytic polishing provided a surface where grains were discernible without etching, and slight additional etching (ferric chloride with HCl/ethanol for few seconds only) was sufficient to show details of the grain boundaries.
For more detailed assessment, the microstructure and especially the grain boundaries of the multiaxial specimen were also inspected by transmission electron microscopy (TEM) in the as-new state and after 10 300 h of testing at 150ºC.
2.5 Creep acceleration by multiaxial loading
Short-term creep testing at high stress and/or temperature tends to be dominated by failure mechanisms producing ductile transgranular fracture. Testing experience from many metals shows that in longer term testing this can gradually change to a lower ductility mechanism accompanied with cavity nucleation, growth and coalescence on the grain boundaries. This shift can be accelerated by multiaxial loading using specimens of fracture mechanics testing (Auerkari et al 2001). The concept is based on the model equation
' ' ) ( ' , ' '( 3 ) υ µ υ σ υ σ σ− = ⋅ − ⋅ − ⋅ ⋅ = A A H tux o VM (1)
where A' and υ' characterise the shape of the uniaxial creep rupture curve, and σVM(σ3) is the
deformation mode dependent reference stress (as defined by Miller 1988). H is the ratio of maximum principal stress to Mises equivalent stress (H = σ1/σe), which is to be obtained according
to material and geometric configuration, using appropriate steady-state values. The value of µ
varies between limits of 0 (for σe-controlled rupture), and 1 (for σ1-controlled rupture). With grain
boundary cavitation µ > 0, and then the approach provides a route to accelerated creep testing without elevating temperature or effective stress. At high temperatures copper is a textbook example of a material with µ ≈ 1, but this is not necessarily applicable close to the much lower temperatures of repository service.
To compare uniaxial and multiaxial testing, the approach taken here is to apply set levels of reference stress for the multiaxial specimens. For the reference stress of the CT specimen, the following expression was used:
σref = P / (f(a)BW) (2a)
f(a) = - (1+γa/W) + {(1+γ)[γ(a/W)2+1]}0.5 (2b)
where a is the notch length, B is the specimen thickness, and W specimen width (see Fig 4) and γ = 2/√3.
LOG (TIME TO RUPTURE)
L O G ( S T R ESS)
Uniaxial data line Multi-axial data line REGIME-1 REGIME-2
t
x= A .(
σ VM)
-υt
u= A .(
σ o)
-υt
u= A' .(
σ o)
-υ't
x= A' .(
σ VM)
-υ' (a)Fig. 4. The principle on shortening of creep life by damage in multiaxial loading. Creep life is described by the simple inverted Norton expression (at constant temperature). Here subscript u refers to uniaxial and subscript x to multiaxial loading; subscript VM refers to v. Mises equivalent stress and subscript o to plain uniaxial case. Regime 2 is the region where grain boundary cavitation can dominate creep damage.
The applied loading for CT testing was taken from a finite element (FE) analysis using the materials parameters obtained from uniaxial testing. Similarly the FE analysis was used to obtain the stress multiaxiality parameter H of the equation (1).
For the CT specimen geometry, the distribution of H and the effective stress from the FE analysis in comparison with the global reference stress indicates an approximate reference location of interest, yielding the required value of H. The general approach was that of the LICON project (Auerkari et al 2001).
3 Results
3.1 Overview of creep testing program
An overview of the performed uniaxial and multiaxial (CT) creep tests are shown in Table 2 and Table 3, respectively.
Table 2. The uniaxial creep testing program.
Specimen Temperature(°C) Initial stress (MPa) Testing time, total (h) Notes V1 150 120 5011 Interrupted (primary)
V1 1) 150 136 2) 14000 Above test continued
V2 120 256 - Failed at loading
V3 150/120 multiple 1996 See Table 4
V4 120 180 - Failed after 2 min
V5 120 153 5756 Interrupted (primary)
1) test continued with the same specimen
2) true stress at the beginning, nominal initial stress 120 MPa
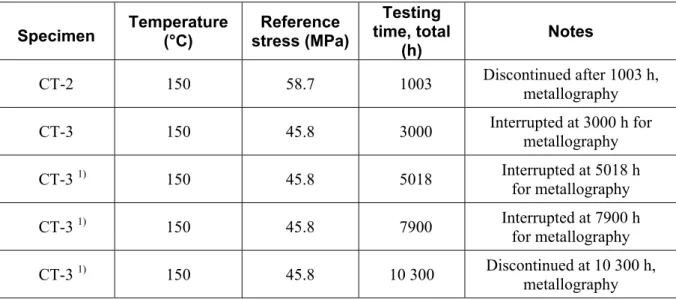
Table 3. The performed multiaxial creep tests of CT specimens.
Specimen Temperature(°C) stress (MPa)Reference
Testing time, total
(h)
Notes
CT-2 150 58.7 1003 Discontinued after 1003 h,metallography CT-3 150 45.8 3000 Interrupted at 3000 h formetallography CT-3 1) 150 45.8 5018 Interrupted at 5018 h for metallography CT-3 1) 150 45.8 7900 Interrupted at 7900 h for metallography CT-3 1) 150 45.8 10 300 Discontinued at 10 300 h, metallography 1) test continued with the same specimen
3.2 Uniaxial creep testing
Uniaxial creep testing was used to characterise the general creep behaviour. The specimen V3 was tested under several test conditions for a range of minimum strain rates (Table 4). The test results
for the longest uniaxial tests are shown in Table 5. The observed uniaxial creep curves and strain rates for the longest test are shown in Figs 5 and 6.
Table 4. The testing results from the first uniaxial specimen (V3), tested in four phases. No necking was observed after testing, in spite of relatively high accumulated end strain.
Test phase Temp
(°C) Eng. stress (MPa) True stress1) (MPa) Lowest value of strain rate 1) (1/h) True strain 1) (%) Time (h) 1 150°C 100 106 3.0 E-6 5.6 1056 2 150°C 130 146 4.9 E-5 11.8 + 233 3 120°C 130 146 1.0 E-6 11.8 + 527 4 120°C 160 199 6.7 E-5 21.6 + 180
1) value at end of phase before stress or temperature change
Table 5. Creep testing results of specimens V1 (150°C) and V5 (120°C). No necking was observed in the specimen after testing, in spite of relatively high accumulated strain.
Specimen Temp(°C) Initial stress (MPa) True stress (MPa) Lowest value of strain rate (1/h) True strain (%) Time (h) 120 136 1) 2.3 E-6 12.2 1) 5011 V1 150ºC 136 137 1) 1.7-2.3 E-6 13.5 1) 14000 V5 120°C 153 194 1) 6.9 E-6 23.9 1) 5756 1) value at the interruption / last recorded time
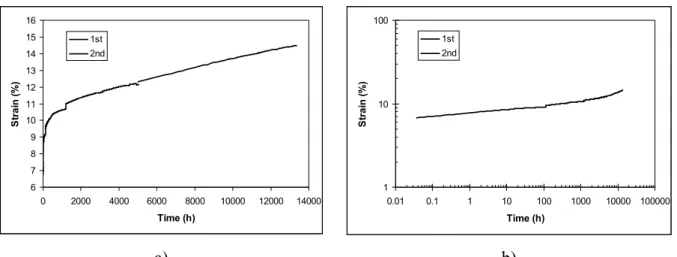
6 7 8 9 10 11 12 13 14 15 16 0 2000 4000 6000 8000 10000 12000 14000 Time (h) St ra in ( % ) 1st 2nd 1 10 100 0.01 0.1 1 10 100 1000 10000 100000 Time (h) S tr a in ( % ) 1st 2nd a) b)
Fig. 5. Uniaxial creep curve at 150°C/120 MPa (V1) on a) linear and b) logarithmic scale. The 1st and 2nd phases refer to the curve sections before and after interruption at 5011 h.
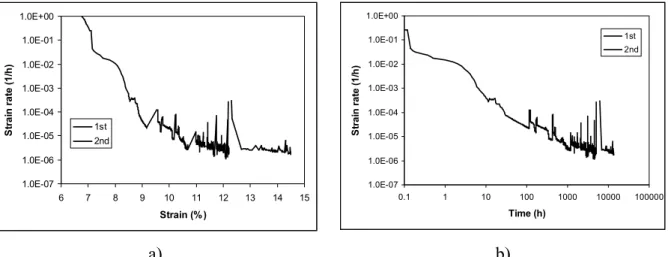
1.0E-07 1.0E-06 1.0E-05 1.0E-04 1.0E-03 1.0E-02 1.0E-01 1.0E+00 6 7 8 9 10 11 12 13 14 15 Strain (%) S tra in r a te (1 /h ) 1st 2nd 1.0E-07 1.0E-06 1.0E-05 1.0E-04 1.0E-03 1.0E-02 1.0E-01 1.0E+00 0.1 1 10 100 1000 10000 100000 Time (h) S tr a in r a te ( 1 /h ) 1st 2nd a) b)
Fig. 6. Strain rate in the test (V1) of Fig 5, as a function of a) strain and b) time. The 1st and 2nd phases refer to the curve sections before and after interruption at 5011 h.
The Norton creep law was adopted for steady-state (secondary or minimum rate) creep, or
dε/dt = A⋅σn (4)
where the rate factor A is assumed to depend mainly on temperature, and the creep exponent n is a constant for each test. Determining A from the experimental results of V1, V3, V5 yielded the values as shown in Table 6. For the same purpose, the value of n was fixed at n = 5. This value was also found to be compatible with extended creep data at 150ºC (Fig 7). For the longest test, the creep curve was fitted to a more detailed model where total true strain = initial ("instantaneous") strain at loading ε0 + primary creep strain εP + secondary creep strain εS. The
Norton law model was retained for the secondary stage, and the primary creep strain rate was taken as
dεp/dt = B⋅σk⋅tx (5)
where the stress exponent k ≥ 1 and the time exponent 0 < x ≤ 1.
Note that true minimum creep rate was not yet confirmed in creep testing for all specimens (cf. Figs 5 and 6).
Table 6. The obtained values of A and n. The shown values of A are likely to be conservative
(large), and the values of n towards the low end of the expected range (up to about 10 near 150°C
in the usual time range of laboratory testing).
Temperature A 1) n 2)
150°C 5.03E-17 5
120°C 2.13E-17 5
1) In units 1/h, with stress expressed in MPa and strain in absolute units
0.08 0.09 0.1 0.11 0.12 0.13 0.14 0 2000 4000 6000 8000 10000 12000 14000 Time (h) Tr ue s tr ain Data Model fit
Fig 7. The uniaxial creep curve at 120 MPa/150ºC (test V1), and fitted curve using model where total strain is a sum of initial "instantaneous" strain, primary creep strain and steady state strain components: ε = ε0 + εP + εS.
3.3 Multiaxial (CT) creep testing
The first multiaxial creep test (CT-2) was performed at 150°C and a reference stress (see below) of 59 MPa. This test was terminated after 1003 h for metallographic inspection of possible creep damage. As the specimen CT-2 showed clear ligament plasticity, visible as notch opening and lateral root contraction, the second test (CT-3) was tested at the same temperature but with a lower reference stress of 46 MPa. This test was interrupted for inspections at 3000 h, 5018 h, 7900 h and 10300 h (termination) of loading time. The measured lowest displacement rates at the times of interruption, and expected minimum strain rates (from equation 4) are presented in Table 7. No visible notch root contraction was observed in the specimen CT-3.
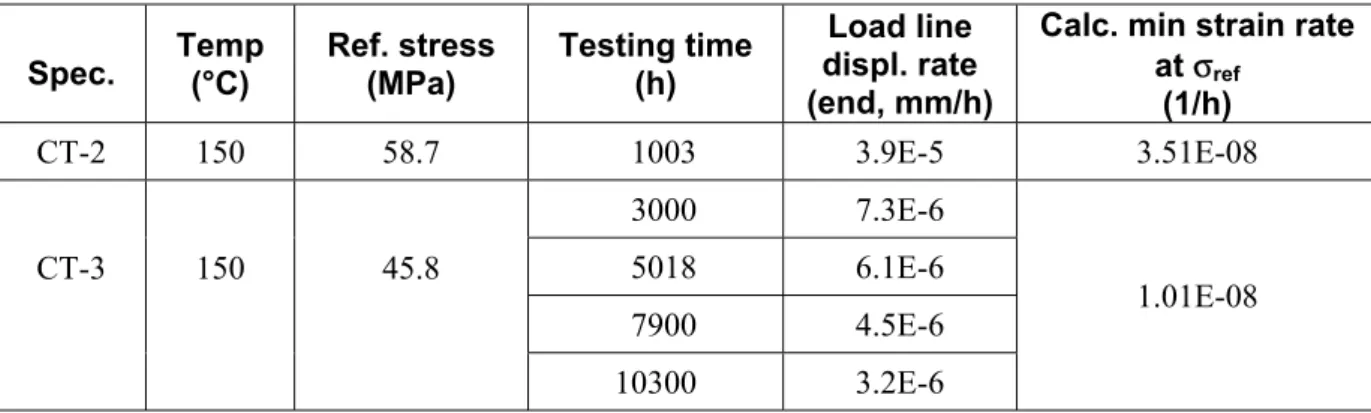
Table 7. Measured displacement rates and calculated minimum strain rates for CT specimens.
Spec. Temp(°C) Ref. stress(MPa) Testing time(h)
Load line displ. rate (end, mm/h)
Calc. min strain rate at σref (1/h) CT-2 150 58.7 1003 3.9E-5 3.51E-08 3000 7.3E-6 5018 6.1E-6 7900 4.5E-6 CT-3 150 45.8 10300 3.2E-6 1.01E-08
3.4 Stress and strain analysis
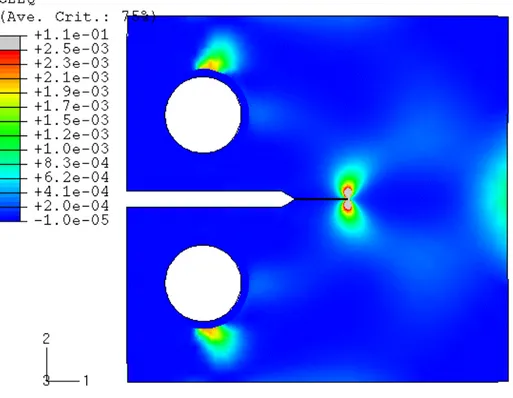
Examples of the FE analysis results in Figs 8 and 9 show the distributions of the maximum principal stress and equivalent (Mises) strain under stabilised conditions for the specimen CT-3. The equivalent strain distributions for the notch tip region of CT-3 at 6000 h (close to end of transient distribution) and 64000 h (stable distribution) are shown in Figs 10 and 11.
Lower stresses and strain rates in CT-3 lead to much longer time to reach a stabilised stress state than in the specimen CT-2. Near the notch tip the first principal and equivalent Mises stresses were recorded in order to evaluate the H - parameter using the reference stress concept. The results for specimens CT-2 and CT-3 are given in Fig 12 and Fig 13, respectively.
The characteristic value of H is taken from the location where the calculated Mises equivalent stress distribution equals the value of the reference stress (Fig 14). The obtained characteristic value of H = 3.65 for both specimens CT-2 and CT-3, and this occurs at a distance of 0.2 mm ahead of the notch tip. The results from FE analysis were originally used to set the loading levels in CT specimen testing. This was considered reasonably successful, as the loading of the specimen CT-2 resulted in accelerating creep within about 1000 h, and loading of the specimen CT-3 led to nearly constant rate or slowly attenuating creep within about 10000 h.
Fig. 8. Distribution of the stabilised (at 64000 h) maximum principal stress (MPa) for the specimen CT-3.
Fig. 9. Distribution of the equivalent strain for specimen CT-3 at 64000 h.
Fig. 11. Distribution of the predicted equivalent creep strain for specimen CT-3 at 64000 h. 0.0 0.1 0.2 0.3 0.4 0.5 0.6 0.7 0.8 0.9 1.0 1.0 1.5 2.0 2.5 3.0 3.5 4.0 4.5 CT-2
H
r [mm]
1 s 840 h 5800 h 7900 h 64000 hFig. 12. Evolution of H distribution in front of the notch tip for specimen CT-2 at different times during a simulated test. The case of 64000 h corresponds to a stabilised situation.
0.0 0.1 0.2 0.3 0.4 0.5 0.6 0.7 0.8 0.9 1.0 1.0 1.5 2.0 2.5 3.0 3.5 4.0 4.5 CT-3 1 s 840 h 5900 h 8000 h 64000 h H r [mm]
Fig. 13. Evolution of H distribution in front of the notch tip for specimen CT-3 at different times during a simulated test. The case of 64000 h corresponds to a stabilised situation.
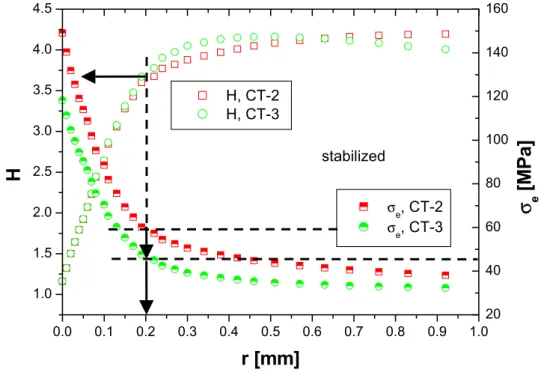
0.0 0.1 0.2 0.3 0.4 0.5 0.6 0.7 0.8 0.9 1.0 1.0 1.5 2.0 2.5 3.0 3.5 4.0 4.5 stabilized H r [mm] H, CT-2 H, CT-3 20 40 60 80 100 120 140 160 σ e [M P a] σe, CT-2 σe, CT-3
Fig. 14. Distributions of the stabilised values of H and v. Mises equivalent stress σe in front of the
notch tip for specimens CT-2 and CT-3. At the corresponding values of reference stress of 59 MPa (CT-2) and 46 MPa (CT-3), the distance from the notch tip is 0.2 mm.
3.5 Metallographic assessment
3.5.1 As-received material
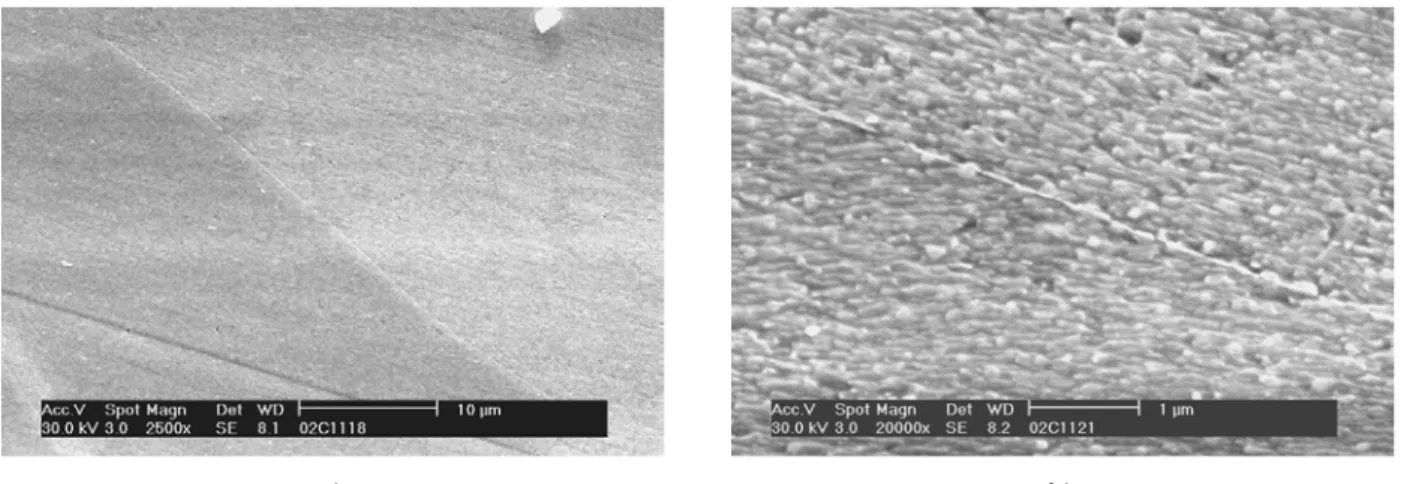
The general structure of as-received copper material was largely as expected, with no particularly special features e.g. in the grain boundaries when inspected in scanning electron microscope (SEM, Fig 15).
However, transmission electron microscopy (TEM) can reveal more details of the grain boundary structures. Many of these are free from precipitates (Fig 16), but also some contain grouped CuS inclusions and grain boundary films (Fig 17).
a) b)
Fig 15. Microstructure of the as-received material after electropolish and slight etch; a) grain boundaries and b) detail of a grain boundary as it can be seen in SEM.
Fig 15. Microstructure of the as-received material after electropolish and slight etch; a) grain boundaries and b) detail of a grain boundary as it can be seen in SEM.
a) b)
Fig 17. a) CuS inclusions appear in groups, some in grain boundaries; b) film with high oxygen and phosphorus content on a grain boundary of the as-received material (TEM).
3.5.2 Specimen CT-2, tested at 59 MPa / 150
°
C
In the specimen CT-2 after 1003 h of testing at 150°C/59MPa, no obvious changes in the microstructure were observed, nor were there any clear signs of creep cavitation or cracking (Fig 18). This was confirmed from electrolytically polished specimen, as it was found that the usual etching medium for copper (ferric chloride) easily results in multiple cavity- or even cracklike features as false indications on the grain boundaries of the material.
Somewhat controversially though, one small mechanically polished unetched area appeared to show a cluster of cavity-like indications (Fig 19). This was not repeated elsewhere in the specimen, however.
Generally the cavity-like grain boundary indications in chemically etched surface near the notch tip root (and beyond) appear to be false indications. These indications are probably due to localised dissolution of precipitates or other grain boundary phases that etch much more readily than the bulk material within the grains (Fig 20). To avoid the false cavity indications and deep boundary etch, but to be still able to discern the grain boundaries and probable real creep cavitation, all further SEM investigations were conducted by applying electrolytic polish, and when necessary, very slight etch on top of it.
a) b)
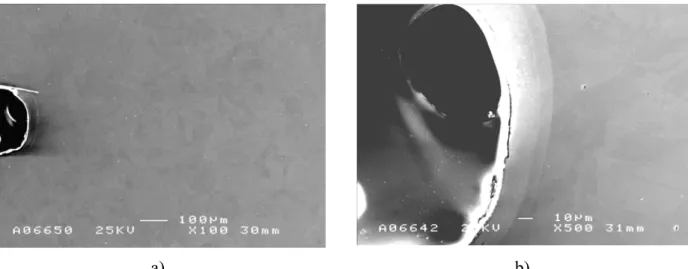
Fig 18. Specimen CT-2 (150°C/59 MPa) side surface after 1003 h of testing, electrolytic polish, no
etch; a) general view near the notch tip; b) magnification of the tip root area.
a) b)
Fig 19. Specimen CT-2 (150°C/59 MPa) side surface after 1003 h of testing; mechanical polish,
no etch; a) region near the notch tip, showing cavity-like indications; b) typical area with no cavity indications.
a) b)
Fig 20. The side surface of specimen CT-2 (150°C/59 MPa) after 1003 h of testing, with ferric
chloride etch; a) notch tip region; b) several mm away from the tip. Note relatively abundant false cavity indications on grain boundaries and elsewhere.
3.5.3 Specimen CT-3, tested at 46 MPa / 150
°
C
In the specimen CT-3 after 3000 h and 5018 h of testing at 150°C/59MPa, no obvious changes in the microstructure were observed, nor were there any clear signs of creep cavitation or cracking (Figs 21 and 22).
Indications of an additional phase were found at some grain boundaries of the specimen CT-3 after 5018 h (Figs 22 and 23). This phase appears to etch readily and give an impression of local grain boundary widening, or even boundary separation if etched too much.
After 7900 h of testing, the grain boundary structure remained mostly similar to that after previous interruption. One small apparent grain boundary cavity indication was observed near the notch tip (Fig 24). More cavity indications were observed after 10300 h of testing, both from side surface and specimen mid-section. Even some grain boundary opening was found at the notch tip (Figs 25 - 27).
a) b)
Fig 21. Specimen CT-3 (150°C/46 MPa) side surface after 3000 h of testing, electrolytic polish; a)
general view near the notch tip; b) magnification below the tip root area.
a) b)
Fig 22. Specimen CT-3 side surface after 5018 h of testing, electrolytic polish and slight etch; a) notch tip region; b) magnification below the tip root area. Note the structure of some grain boundaries, suggesting an additional phase.
a) b)
Fig 23. Specimen CT-3 side surface after 5018 h of testing, electrolytic polish and slight etch; a) grain boundary (gb) phase; b) gb phase, detail.
a) b)
Fig 24. Specimen CT-3 side surface after 7900 h of testing, electrolytic polish and slight etch; a) grain boundaries; b) a cavity indication on a grain boundary.
a) b)
Fig 25. Specimen CT-3 side surface after 10300 h of testing, notch tip on the upper side; a) notch tip area with a partly opened grain boundary, electrolytic polish; b) detail of the same region after mechanical polish and slight etch.
a) b)
Fig 26. Specimen CT-3 mid-section after 10300 h of testing; a) gb cavity indications near the notch tip; b) a cavity indication in a low stress region (ligament side corner).
a) b)
Fig 27. Specimen CT-3 side surface after 10300 h of testing, about 0.2 mm below the notch tip; electrolytic polish and slight etch; a) grain boundary with a cavity (arrow); b) magnification of the same cavity indication; note the film-like feature crossing the boundary region at the cavity indication.
In most cases, the observed grain boundary cavity indications appeared as single separate cavities at a maximum density that remains below 100/mm2. Highest local density with some apparent
grouping and alignment was observed at the specimen (CT-3) mid-section, but even then the overall density was below 100/mm2 (Fig 26a), and the overall density was not significantly different between the mid-section and side surface. Some singular cavity indications have also been observed well outside the notch tip region (Fig 26b). The maximum density occurred within about 0.2 mm from the notch tip.
The strongly etching phase on some grain boundaries was also most prominent near the notch tip after prolonged testing, and was not observed in the as-received material. In the TEM examination of thin foils prepared by electrolytic polishing, a thinned zone was seen at many grain boundaries (Fig 28). This zone was typically bounded from one side by the grain boundary or the boundary film with elevated P, O and C, and from the other side by the matrix with a lower content of P, O and C (Figs 29-31). No phase boundary was observed between the zone and the matrix, as is indicated by dislocations crossing the border, while the zone appears to be relatively even in thickness and with clear borderlines to the matrix (Fig 32).
a) b)
Fig 28. Specimen CT-3 after 10300 h of testing, 1.5 mm from the notch root mid-section (TEM); a) grain boundary with inclusions, boundary film and thinned zone; b) magnified image of boundary film and thinned zone.
Fig 29. EDS analysis results of the thinned region adjacent to the grain boundary from Fig 28a, showing elevated concentration of P, O and possibly C (note that some indicated carbon is expected as a electron beam contaminant).
Fig 30. EDS results of the grain boundary film of Fig 28a, showing elevated concentration of P, O and possibly C at somewhat higher level than in the thinned zone (Fig 29).
Fig 31. EDS results of the matrix outside the thinned zone in Fig 28a, showing attenuated concentration of P, O and C in comparison with the zone and the boundary film.
a) b)
Fig 32. CT-3 after 10300 h, notch root mid-section, two TEM images showing thinned "segregation zones" along grain boundaries, with dislocations crossing the zone-matrix boundary.
4 Discussion
4.1 Creep behaviour
The available constant load creep testing data (from reports of SIMR and present work) was assessed according to the standard PD6605 and ECCC guidelines. Of the parametric models of PD6605, the best fit to the data was given by the MC model ("minimum commitment" model of Manson), but the fit (equation 6) is not particularly impressive even when censoring some of the shortest (< 100 h) tests away (Fig 33a). The predicted life at stress σ and temperature T is given by log(tr) = 40.07948-17.8005⋅log(σ)+0.12469⋅σ-0.00062⋅σ2-0.02724⋅T+5810.535/T (6)
The data set included 71 tests, of which 8 not yet taken to rupture, at test temperatures of 175-450°C and at stress levels of 30-160 MPa. The duration of the longest test taken to rupture was 8997 h at 175°C/150 MPa, and the duration of the longest unfailed test 25585 h at 215°C/100 MPa.
One apparent reason for the observed considerable scatter in creep strength is the grain size, which varied from 40 to 2000 µm. Therefore refitting was done for various levels of grain size, resulting in a fairly clear difference between larger (> 115 µm) and smaller (max 115 µm) grain size (Fig 33b). Although the fit seems better for the smaller grain size, the longest tests are still short both for general predictive power (deviation between predicted and observed time when extending predictions in time) as well as for the intended application (200000 years = 1.75⋅109 h).
The limitations of the existing uniaxial creep data are apparent particularly towards the lower temperature end, which includes the longest ruptured specimen test and where the predictive fitting (Fig 33) is relatively poor though conservative (observed life > predicted life).
Uniaxial creep testing of the present work (120-150°C/100-160 MPa, up to 14000 h) suggests that in the lower range of testing temperatures necking is unlikely to intervene before some least 20-25% of true strain. Good ductility is therefore expected at least as long the loading is purely mechanical in character, in spite of the observed grain boundary features in CT tests at 150°C. Also, up to 14000 h of creep testing at 150°C/120 MPa, the specimen does not yet show definite inflexion to confirm minimum creep rate, although the attained 13.5% true strain at this point means that the actual specimen stress has increased from the initial 120 MPa to 137 MPa.
1 1.5 2 2.5 3 3.5 4 4.5 5 5.5 1 2 3 4 5 OBSERVED LIFE, lg(h) P R EDI C TE D LI F E , l g (h ) mc X=Y +2.5RMS -2.5RMS +log2 -log2 L-FIT all y = 0.3637x + 1.9232 y = 0.7582x + 0.7555 1 2 3 4 5 6 1 2 3 4 5 OBSERVED LIFE, lg(h) P R E D IC T E D L IF E , lg (h ) test continues GS>115 GS=115 X=Y +2.5RMS -2.5RMS +log2 -log2 L-FIT all Linear (GS>115) Linear (GS=115) a) b)
Fig. 33. Comparison of predicted and observed uniaxial creep rupture life from available data (best fit with MC parametric model). The fitted (least squares) line includes only test data > 100 h; a) all data; b) effect of grain size (GS).
The creep behaviour in the multiaxial (CT-3) testing, as indicated by the observed load line displacement rate in Table 7, shows no definite minimum rate at 150°C/46 MPa by the time of discontinued testing (10300 h). However, this reference stress level, selected according to results from uniaxial creep testing and FE creep analysis, was probably approximately appropriate for the intended time scale (max 10000 h). This is suggested by the observation that unlike the corresponding test at 59 MPa reference stress (CT-2), clear notch root contraction (or locally high strain) was avoided. Also, the post-test inspection indicated some damage as local grain boundary opening, and more controversially, as possible grain boundary cavitation at the notch root (Figs 26-27). It is however likely that a thicker CT specimen with side grooves would provide a higher constraint and tensile multiaxiality than the specimen geometry used in the present work, where side grooving was precluded by the necessity for interrupted testing and damage inspections.
4.2 Grain boundary damage
In general, very little creep damage as grain boundary cavitation or cracking is to be expected in uniaxial testing before attaining extensive strains relatively close to failure, and at that stage the damage would most probably not be representative of creep damage (if present) in multiaxially loaded components. Therefore, realistic damage assessment is better based on observations and conclusions from the multiaxial CT specimen testing.
In the interrupted multiaxial (CT) testing at 150°C and 46 MPa reference stress, grain boundary cavity indications that could be true creep cavities by appearance were not observed after first two interruptions at 3000 h and 5018 h of testing. Such cavities at very low density (much less than 100/mm2) at the notch root were observed after 7900 h of testing, and at a somewhat higher density (but still below 100/mm2) after 10300 h of testing when the test was discontinued. At this stage it was possible to dissect the specimen (CT-3), but there was no significant difference in the observed cavity density or other appearance in the specimen mid-section in comparison to the side surface. Also some grain boundary opening (but only in one location) was observed at the notch root, where the tensile strain is at maximum. Although such damage suggests strain concentration on grain boundaries rather than the bulk metal, it is possible that this involves effects of selective oxidation, since this particular grain boundary was originally adjacent to the free surface of the notch. The maximum density of cavity indications appeared in all cases within about 0.2 mm from the notch tip, with a typical cavity size of less than 1 µm in the longest dimension.
Some grain boundaries also include a film elevated in oxygen and phosphorus content (Figs 17b, 28 and 29), already present in the as-new material. This film probably reflects the relatively high oxygen content (60 ppm) of the material. The film also seems to appear in certain SEM images, showing apparent effects of local strain (Fig 27b).
Some cavity indications were also observed well away from the notch (Fig 26b). It is by no means certain that all false cavity indications were avoided, although care was taken to minimise the required etching (limited to electrolytic polish) at the grain boundaries. False cavity indications could be caused by the easily etching inclusions (Figs 17a & 28a), which were present, often in groups, also in the as-new material.
A particular feature in the tested material was the observed easily etching "segregation zone", which appeared as an evenly thinned zone along some grain boundaries particularly near the notch tip after testing (Figs 22-25,27,28,32). This feature was practically absent or very small in the as-received material, and showed a maximum width of about 2-3 µm near the strained notch tip region after 7900 h and 10300 h of testing at 150°C/46 MPa. Within this zone the oxygen and phosphorus contents are higher than in the surrounding matrix but lower than in the boundary films (Figs 29-31). The zone is from one side bounded by the grain matrix without any apparent phase boundary in TEM, but with a relatively sharp edge so that it does not appear to be a typical diffusion zone either. Conventional etching of copper (e.g. with ferric chloride) resulted in so strong dissolution of this zone that the appearance was that of grain boundary cracking.
4.3 Life prediction from accelerated testing
Because no extensive creep cavitation was yet confirmed in multiaxial testing, it is not certain that the LICON approach described above is properly applicable to predict creep life. However, assuming that the failure to observe extensive creep cavitation damage is only because the testing time was relatively short, a conservative life estimate can be obtained.
For uniaxial creep testing specimen analogously to equation (1)
'
'⋅σ−υ
= o
u A
Assuming the same temperature and reference stress for uniaxial and multiaxial cases, the time acceleration factor to creep crack initiation (extensive creep damage) can be obtained from the equations (1) and (6) as ' , υ µ⋅ =H t t x u u (8)
Assuming that at 150°C and 46 MPa, the multiaxial specimen would show constrained creep cavitation leading to creep crack initiation in a time at least of 41000 h, as 10300 h was not sufficient for reaching a cavity density of 100/mm2. This conclusion is based on experiments and
experience of the evolution of creep cavitation in metallic components, when normalised in terms of time expired under load divided by time to macroscopic creep cracking, and noting that the cavity density level of 100/mm2 is approximately at the lower limit of damage class 2 (scattered or isolated creep cavitation) in the inspection guidelines (Nordtest NT TR-170 1992, VGB TW-507 1992, Nordtest NT TR-302 1995).
Furthermore, taking from the FE analysis H = 3.65 (Fig 14), and assuming that µ = 1 (constrained conservative case) and υ' = 2.07 or υ' = 4.64 from two uniaxial rupture curves (see below), the resulting multiaxial acceleration factors in time are
59 . 14 65 . 3 2.07 , = = x u u t t and 3.654.64 406.5 , = = x u u t t
In this case the predicted minimum uniaxial life would be 598000 65 . 3 41000⋅ 2.07 = = u
t h = 68 years for the shorter prediction, and 16700000 65 . 3 41000⋅ 4.64 = = u
t h = 1900 years for the longer prediction.
This result can be compared with the corresponding uniaxial creep life for Cu-OFP (series 400) from the Manson-Haferd expression of Lindblom et al (1995), predicting for same stress and temperature a uniaxial life of about 4300 years (Fig 34). Note that this creep rupture line gives for the above estimates the lower value of υ'.
In comparison, when using the MC expression from the present work (fitted to all available data, Fig 33), the predicted uniaxial creep life for the same conditions would be about 3100 years. This creep rupture line gives in the above estimates the higher value of υ'. As this value clearly results in a more consistent predicted life given by the two routes (the difference in time is well within a factor of two), the MC expression appears preferable for further predictions.
As noted above, both the uniaxial rupture curve and the multiaxial conversion approach involve significant factors of uncertainty for extended extrapolations. These factors partly originate from the fact that no extensive creep cavitation has yet been demonstrated in CT testing. Hence H-µυ' is not necessarily a relevant multiplier for the multiaxial case, and the assumption that µ ≈ 1 does not necessarily hold in the equation (1). Also, only relatively short term uniaxial creep rupture data is available, and particularly limited are the data sets at low temperatures.
However, for a rough indication of the resulting isothermal constant (initial) stress predictions, the life estimates at a range of relatively low temperatures are shown in Fig 35.
0 20 40 60 80 100 120 140 160 180 1 10 100 1000 10000
Time to failure (years)
S tr ess ( M P a) MH uniaxial MC uniaxial CT-MH CT-MC
Fig 34. The estimated uniaxial creep life at 150°C/46 MPa from the multiaxial test (CT-MH) in
comparison with the predicted life from the MH expression of Lindblom et al (1995, MH uniaxial), and the corresponding comparison from the same multiaxial test (CT-MC) and from the MC expression of the present work (MC uniaxial). The latter pair gives the values of predicted life within a factor of two at 46 MPa.
30 40 50 60 70 80 90 1000 10000 100000 1000000
Time to failure (years)
S tr ess ( M P a) 90C 100C 110C 120C
Fig 35. The predicted isothermal uniaxial creep life from the MC expression (eq. 6) for a range of
4.4 Additional factors promoting creep failure
When the material as well as the stress and temperature histories are set, in the above approach the main factors to promote creep failure are stress multiaxiality and time. In principle if the stress and temperature levels are sufficiently low, strain hardening of copper can attenuate the creep strain rate to an insignificant level, even if the required time frame is very long. Although it may be inconveniently time consuming to prove what exactly are the limiting stress and temperature combinations, without doubt such limits exist. However, these limits can be further decreased by allowing for additional mechanisms to enhance creep strain and damage. At least two such mechanisms are known and potentially present in the repository conditions: irradiation and corrosion.
Neutron irradiation can induce vacancies in metal, and although not sufficient to induce directed flow by itself, under stress the additional vacancies will inevitably increase the creep rate to the direction of stress. In addition, irradiation could also reduce ductility and thereby further promote creep failure. However, the estimated maximum irradiation in copper in 100000 years is about 4⋅10-7 dpa, which is not enough to add significantly to the thermal equilibrium concentration of vacancies (Guinan 2001).
Although not all corrosion processes can facilitate easier flow (creep) of corroding copper, some mechanisms do. For example, the corrosion mechanisms that produce hydrogen on metal surfaces can offer an easy route for this hydrogen to enter the metal under the oxide film. This interstitial hydrogen is able to reduce the flow strength of the metal, and particularly strongly at locations of high tensile stress where hydrogen concentration can increase considerably. Fortunately the corrosion processes producing hydrogen are generally thought be absent under repository conditions. However, other corrosion processes can produce vacancies that enter the metal from the surface. Due to slow diffusion rates at low temperatures, these vacancies probably would not affect much the bulk behaviour of copper. In case of defects or cracks open to the surface, corrosion could however provide more significant local interaction at the tip regions. Such effects have not been studied in copper at the temperatures of interest.
The observed selective dissolution at grain boundaries could also in principle mean reduced corrosion resistance at the grain boundaries under long term service conditions. The corrosion environment in the repository may prevent this in practice, but it is a potential mechanism that should not be ruled out without good reason. If such a selective dissolution at the grain boundaries took place, it could promote stress concentration and further reduce the apparent ductility.
The combined effects of the above factors enhancing creep could be additive, partially redundant or acting synergistically (Fig 36). To study such possibilities, it would be useful to test the effects of at least two of the enhancing factors present simultaneously, while retaining relatively low temperature and effective (reference) stress. Such suggested tests could include
• notched specimens loaded in a corrosive environment at 120-180ºC; and
• model vessel testing, with a stress enhancing notch and elevated pressure to facilitate a temperature of 120-180°C in the test.
The testing should have a target duration of about 5000- 10000 h or more to avoid large acceleration factors and transient effects. As the uniaxial creep and creep rupture database is still modest to properly support life prediction, it is also recommended that longer term creep testing is
continued with the relevant copper materials. As it was demonstrated that multiaxial testing can enhance effects of interest but the evidence is based on a single specimen, such testing should be included in the program with similar minimum duration but preferably with specimens of higher constraint. Temp (Fast strain) Slow Creep damage & failure time corrosion
irradiation multi-axiality
Stress 0 1 0 1 Corrosion ∫da/S Creep ∫dt/tR Interaction No true interaction a) b)
Fig 36. a) Additional potential or likely factors promoting creep and creep damage; b) types of interaction between damage mechanisms (example on corrosion and creep).
5 Conclusions and recommendations
Multiaxial notched compact tension (CT) specimens of copper with 60 ppm oxygen and 79 ppm phosphorus have been tested at 150°C with a slowly decreasing rate of load line displacement. In post-test inspection, scattered grain boundary cavity indications at low density (< 100/mm2) have been demonstrated in testing up to 10300 hours at 46 MPa reference stress. Based on experience on creep cavitation damage, this would suggest a minimum life to crack initiation at the notch tip of at least about 40000 hours. The actual creep life could be considerably longer, due to uncertainties on the cavity indications that could be at least partially caused by locally dissolved inclusions.
After 5000-10000 h of testing, particularly the most heavily loaded areas near the notch tip of the CT specimen showed "segregation zones" with higher P and O content than in the surrounding matrix. These zones have a tendency to etch evenly and more than the matrix. Even higher P and O contents were found in narrow boundary films adjacent to certain grain boundaries. These films were present already in the as-new state, and appear to etch less than the matrix in metallographic specimen preparation.
Parallel uniaxial creep testing at 150°C/120 MPa initial stress has also been performed up to 14000 hours, showing no definite minimum creep rate or necking up to 13.5% true strain. At this point, the predicted time to 25% true strain is about 60000 h if no necking intervenes.
The predicted isothermal uniaxial creep life at 150°C/46 MPa is about 1900 years, when assessed from the converted multiaxial (CT) testing results. The corresponding predicted uniaxial life is 3100 years, when using directly the available creep testing data as a parametric best fit expression
according to PD6605. Although these predictions show satisfactory agreement by being within a factor of two in time, the uncertainties in such extended extrapolations remain large.
It is recommended that in future the effects of at least two of the enhancing factors are tested simultaneously, while retaining relatively low temperature and effective (reference) stress. Such suggested tests could include
• notched creep testing specimens loaded in a corrosive environment at 120-180ºC; and
• model vessel creep testing, with a stress enhancing notch and elevated pressure to facilitate a testing temperature of 120-180°C.
Future testing should have a minimum target duration of about 5000-10000 h to minimise acceleration factors and transient effects. As the uniaxial creep and creep rupture database is still modest to properly support life prediction, it is also recommended that longer term creep testing is continued with the relevant copper materials. Since it was demonstrated that multiaxial testing can enhance effects of interest but the evidence is now largely based on a single specimen, such testing should be continued, preferably with specimens of even higher constraint.
6 Summary
Multiaxial (compact tension, CT) creep testing of copper has been performed for copper with 79 ppm phosphorus and 60 ppm oxygen. The test load levels were selected according to results from preceding uniaxial creep testing and FE analysis of the CT specimens. Interrupted testing was used for metallographic inspection of the specimens for creep damage.
After 7900 h and 10300 h of testing at 150°C and 46 MPa (reference stress), inspected CT specimens showed cavity indications with a low maximum density (< 100/mm2) and a typical maximum dimension of less than about 1 µm near the notch tip. No such damage indications were observed after 3000 h or 5018 h of testing. Based on experience on creep cavitation damage, the results would suggest a minimum life to crack initiation at the notch tip of at least 40000 hours. However, as the observed cavity indications could be at least partially false calls from locally dissolved inclusions, the actual creep life could be considerably longer.
The interrupted testing of CT specimens also showed a "segregation zone" along some grain boundaries, mainly near the notch tip. This zone appears to contain more P and O than the surrounding matrix, but less than the narrow grain boundary films that are already present in the as-new material. The "segregation zone" etches readily, and shows a relatively sharp edge towards the matrix without an obvious phase boundary.
Using converted multiaxial (CT) testing results, the predicted isothermal uniaxial creep life at 150°C/46 MPa is about 1900 years. The corresponding predicted uniaxial life is 3100 years, when estimated from the uniaxial test data and a parametric best fit expression according to PD6605. Although the two results are satisfactorily within a factor of two in time, the uncertainties in this kind of extended extrapolations remain large.
It is recommended that in future the effects of at least two of the creep enhancing factors are tested simultaneously. Such testing could include notched creep testing in a corrosive environment at 120-180ºC as well as model vessel creep testing with a stress enhancing notch and elevated
at least 5000-10000 h to minimise the acceleration factors and transient effects. As the uniaxial creep and creep rupture database is still modest, it is also recommended that longer term creep testing is continued, including multiaxial testing with preferably even higher constraint than in the this work.
References
Auerkari, P., Borggreen, K. & Salonen, J., 1992. Reference micrographs for evaluation of creep damage in replica inspections. Nordtest Report NT TR-170, Nordtest, Espoo. 41 p.
Auerkari, P., Salonen, J. & Borggreen, K., 1995. Guidelines for evaluating in-service creep damage. Nordtest Report NT TR-302. VTT Manufacturing Technology, Espoo. 15 p.
Auerkari, P., Bendick, W., Holdsworth, S., Rantala, J.H., Hurst, R., Coussement, C. & Hack, R., 2001. Predicting long term creep behaviour using the LICON methodology. Proceedings of the 3rd Conference on Advances in Materials Technology for Fossil Power Plants, University College of Swansea, UK, p. 329-339.
Guinan, M.W., 2001. Radiation effects in spent nuclear fuel canisters. SKB Technical Report TR-01-32, Stockholm. 22 p.
Lindblom, J., Henderson, P. & Seitisleam, F., 1995. Creep testing of oxygen-free phosphorus copper and extrapolation of the results. SIMR report IM-3197. 33 p.
Miller, A.G., 1988. Review of limit-loads of structures containing defects. Pressure Vessels & Piping 32, p. 197.
Nilsson, F. (comp.), 1992. Mechanical integrity of canisters - summary report. SKB Technical Report 92-45. 10 p + app.
PD6605-1:1998: Guidance on methodology for assessment of stress-rupture data. BSI Published Document, London. 51 p.
VGB-TW 507, 1992. Guideline for the assessment of microstructure and damage development of creep exposed materials for pipes and boiler components. VGB, Essen. 7p.+app.