Measuring universal health coverage based on an index of
effective coverage of health services in 204 countries and
territories, 1990–2019: a systematic analysis for the Global
Burden of Disease Study 2019
GBD 2019 Universal Health Coverage Collaborators*
Summary
Background Achieving universal health coverage (UHC) involves all people receiving the health services they need, of
high quality, without experiencing financial hardship. Making progress towards UHC is a policy priority for both
countries and global institutions, as highlighted by the agenda of the UN Sustainable Development Goals (SDGs) and
WHO’s Thirteenth General Programme of Work (GPW13). Measuring effective coverage at the health-system level is
important for understanding whether health services are aligned with countries’ health profiles and are of sufficient
quality to produce health gains for populations of all ages.
Methods Based on the Global Burden of Diseases, Injuries, and Risk Factors Study (GBD) 2019, we assessed UHC
effective coverage for 204 countries and territories from 1990 to 2019. Drawing from a measurement framework
developed through WHO’s GPW13 consultation, we mapped 23 effective coverage indicators to a matrix representing
health service types (eg, promotion, prevention, and treatment) and five population-age groups spanning from
reproductive and newborn to older adults (≥65 years). Effective coverage indicators were based on intervention
coverage or outcome-based measures such as mortality-to-incidence ratios to approximate access to quality care;
outcome-based measures were transformed to values on a scale of 0–100 based on the 2·5th and 97·5th percentile of
location-year values. We constructed the UHC effective coverage index
by weighting each effective coverage indicator
relative to its associated potential health gains, as measured by disability-adjusted life-years for each location-year and
population-age group. For three tests of validity (content, known-groups, and convergent), UHC effective coverage
index performance was generally better than that of other UHC service coverage indices from WHO (ie, the current
metric for SDG indicator 3.8.1 on UHC service coverage), the World Bank, and GBD 2017. We quantified frontiers of
UHC effective coverage performance on the basis of pooled health spending per capita, representing UHC effective
coverage index levels achieved in 2019 relative to country-level government health spending, prepaid private
expenditures, and development assistance for health. To assess current trajectories towards the GPW13 UHC billion
target—1 billion more people benefiting from UHC by 2023—we estimated additional population equivalents with
UHC effective coverage from 2018 to 2023.
Findings Globally, performance on the UHC effective coverage index improved from 45·8 (95% uncertainty interval
44·2–47·5) in 1990 to 60·3 (58·7–61·9) in 2019, yet country-level UHC effective coverage in 2019 still spanned from
95 or higher in Japan and Iceland to lower than 25 in Somalia and the Central African Republic. Since 2010,
sub-Saharan Africa showed accelerated gains on the UHC effective coverage index (at an average increase of
2·6% [1·9–3·3] per year up to 2019); by contrast, most other GBD super-regions had slowed rates of progress in
2010–2019 relative to 1990–2010. Many countries showed lagging performance on effective coverage indicators for
communicable diseases relative to those for communicable diseases and maternal and child health, despite
non-communicable diseases accounting for a greater proportion of potential health gains in 2019, suggesting that many
health systems are not keeping pace with the rising non-communicable disease burden and associated population
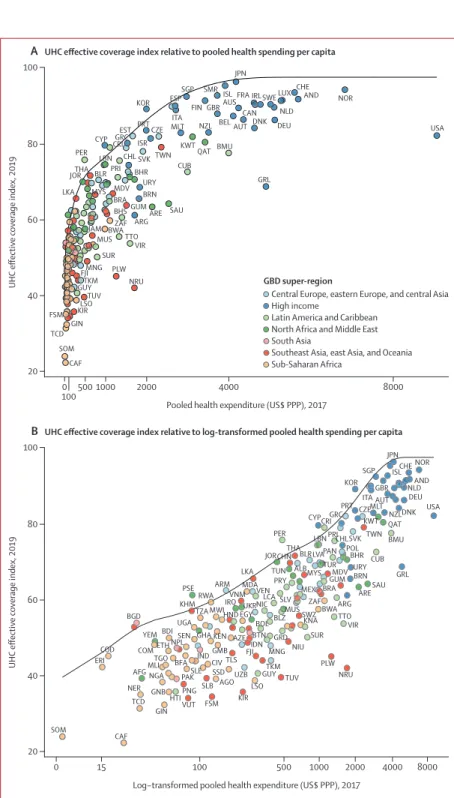
health needs. In 2019, the UHC effective coverage index was associated with pooled health spending per capita
(r=0·79), although countries across the development spectrum had much lower UHC effective coverage than is
potentially achievable relative to their health spending. Under maximum efficiency of translating health spending
into UHC effective coverage performance, countries would need to reach $1398 pooled health spending per capita
(US$ adjusted for purchasing power parity) in order to achieve 80 on the UHC effective coverage index. From
2018 to 2023, an estimated 388·9 million (358·6–421·3) more population equivalents would have UHC effective
coverage, falling well short of the GPW13 target of 1 billion more people benefiting from UHC during this time.
Current projections point to an estimated 3·1 billion (3·0–3·2) population equivalents still lacking UHC effective
coverage in 2023, with nearly a third (968·1 million [903·5–1040·3]) residing in south Asia.
Interpretation The present study demonstrates the utility of measuring effective coverage and its role in supporting
improved health outcomes for all people—the ultimate goal of UHC and its achievement. Global ambitions to
Lancet 2020; 396: 1250–84
Published Online
August 27, 2020 https://doi.org/10.1016/ S0140-6736(20)30750-9 See Comment page 1130 *Collaborators are listed at the end of the paper Correspondence to: Prof Rafael Lozano, Institute for Health Metrics and Evaluation, University of Washington, Seattle, WA 98105, USA
accelerate progress on UHC service coverage are increasingly unlikely unless concerted action on non-communicable
diseases occurs and countries can better translate health spending into improved performance. Focusing on effective
coverage and accounting for the world’s evolving health needs lays the groundwork for better understanding how
close—or how far—all populations are in benefiting from UHC.
Funding Bill & Melinda Gates Foundation.
Copyright © 2020 The Author(s). Published by Elsevier Ltd. This is an Open Access article under the CC BY
4.0
license.
Research in context
Evidence before this study
Various approaches have been proposed for monitoring
universal health coverage (UHC) service coverage, including
those from WHO (ie, the UHC service coverage index,
the official UN measure for the Sustainable Development Goal
indicator 3.8.1) and the World Bank. Currently available service
coverage metrics are heavily focused on infectious diseases as
well as reproductive, neonatal, maternal, and child health,
despite the recognition that advances towards UHC also
require service provision for non-communicable diseases and
delivering interventions to a broader range of population-age
groups. Inconsistent trend estimation across indicators,
if time series are generated, impedes measurements of
progress—a priority emphasised in the member-state-led
Political Declaration for the UN High-Level Meeting on
Universal Health Coverage in 2019. Although the 2014 WHO
and World Bank framework for UHC service coverage is
explicitly focused on health-system effective coverage,
efforts to date have focused on crude coverage or
health-system resource inputs, or a combination of both. Effective
coverage at the health-system level, or the fraction of
potential health gains delivered by a health system, has yet to
be incorporated into UHC monitoring efforts, even though
WHO and member states have signalled increasing interest in
understanding the impact of UHC beyond service coverage
alone.
Added value of this study
Drawing from the WHO Thirteenth General Programme of
Work (GPW13) Expert Reference Group and Task Force on
Metrics recommendations on UHC monitoring and conceptual
work on effective coverage of health systems, the present
study offers a new measurement framework for UHC effective
coverage, representing health needs and corresponding
service types across the life course while accounting for
potential health gains delivered to populations.
The framework mapped 23 effective coverage indicators
against five health service domains—promotion, prevention,
treatment, rehabilitation, and palliation—and five
population-age groups (ie, reproductive and newborn, children <5 years,
children and adolescents aged 5–19 years, adults aged
20–64 years, and adults aged ≥65 years). Based on estimates
from the Global Burden of Diseases, Injuries, and Risk Factors
Study (GBD) 2019, these 23 effective coverage indicators
involved either direct measures of intervention coverage
(eg, antiretroviral therapy coverage) or outcome-based
indicators, such as mortality-to-incidence ratios, to approximate
access to quality care. We weighted each effective coverage
indicator on the basis of potential health gains deliverable by
health systems, as approximated by the disability-adjusted
life-years associated with each effective coverage indicator,
and aggregated them to produce the UHC effective coverage
index. Three types of validity were assessed (content, known
groups, and convergent) for the UHC effective coverage index
and other multi-country service coverage measures (eg, the UHC
service coverage index for 2017, as estimated by WHO, and the
GBD 2017 UHC service coverage index for 2017). We also
quantified relationships between pooled health spending per
capita (ie, government expenditures, prepaid private
spending, and development assistance for health) and UHC
effective coverage performance to examine how well
countries are currently translating resources into improved
UHC effective coverage. Last, we estimated the number of
population equivalents covered by effective health services
from 2018 to 2023—a key component of WHO’s GPW13—
by assuming a direct translation of the UHC effective coverage
index to a fractional metric and multiplying country-level
population estimates.
Implications of all the available evidence
This study offers another step forward in measuring UHC
effective coverage across settings, developing a measurement
framework and methods for country and global stakeholders
to better track progress in effective health service provision at
the population level. Our results highlight the importance of
including non-communicable disease indicators alongside
interventions for reproductive, neonatal, maternal, and child
health and for infectious diseases, as well as capturing
potential health gains delivered by health systems at the
population level. In combination, we expect these analytical
advances to better identify where countries have improved
effective health service delivery, and what health needs along
the life course increasingly threaten further progress. Focusing
on UHC effective coverage, both in terms of its measurement
and its capacity for instilling greater accountability for
improving health outcomes across the development spectrum,
lays a data-driven path towards achieving UHC for all
populations.
Introduction
Universal health coverage (UHC) is viewed as a crucial
avenue through which improved health for all can be
attained,
1,2by ensuring all people can receive quality
health services they need,
without experiencing financial
hardship. Global agendas and actors have amplified calls
for UHC in recent years, driven at least in part by the
explicit inclusion of UHC achievement in target 3.8 of
the UN Sustainable Development Goals (SDGs)
3–5and
heightened emphasis within recent UN resolutions
1and
WHO programmatic objectives (eg, the target of 1 billion
more people benefiting from UHC from 2018 to 2023 as
part of WHO’s Thirteenth General Programme of Work
[GPW13]).
6,7Regional and country-driven efforts to elevate
UHC on policy agendas have occurred as well, both
building upon long estab lished UHC programmes (eg, in
Japan,
8much of western Europe,
9,10and many countries
in Latin America
11,12) and galvanising newer commitments
to UHC implementation (eg, in India, Kenya, and South
Africa).
13To better understand how actions and investments
are delivering on the ultimate goal of UHC—improving
health outcomes—it is essential to quantify and track
trends in effective health service provision, as well as the
extent to which advances in service coverage correspond
with the potential health gains populations should
experience.
In 2014, WHO and the World Bank published a UHC
measurement framework in which service coverage
was defined as a spectrum of services—promotion,
prevention, treatment, rehabilitation, and palliation—
across the life cycle.
14,15This framework emphasised
the importance of providing services for individuals’
health needs throughout their lifespans and quantifying
effective coverage of interventions delivered by health
systems. Conceptually, effective coverage unites
inter-vention need, use, and quality into a single metric,
representing the proportion of health gain that could
be potentially received from an intervention relative to
what is actually experienced.
16,17At the health-system
level, effective coverage aims to capture the fraction of
total potential health gains actually delivered relative to
what a health system could have theoretically delivered.
16To quantify such population-level health gains, Shengelia
and colleagues outlined an approach to measure an
aggregate of health-system effective coverage.
16Effective
coverage is a powerful measure: this metric not only
demands accountability of intervention availability and
use, but also requires that the services received are of
sufficient quality to provide the health gains they are
supposed to. Yet in practice, effective coverage has to date
been rarely measured, particularly across countries and
over time. Minimal uptake of effective coverage as a
metric for UHC monitoring is at least partly due to data
challenges, as most health data systems are not able to
capture all three intervention components together (ie,
need, use or receipt, and quality) and few data sources
can adequately represent these dimensions for conditions
involving more complex care (eg, cancer or stroke).
Tracer or proxy indicators of effective coverage exist for
certain interventions or cause groups (eg, cancers), and
recent health-system research by Kruk and colleagues
used mortality-to-incidence rates to garner insights into
health-care quality in low-income to middle-income
countries.
18Nevertheless, to date no multi-country UHC
measure ment effort to our knowledge has sought to
estimate effective coverage across health service domains
and population-age groups within a cohesive analytical
platform.
Following the 2014 WHO/World Bank UHC monitoring
framework and SDG adoption in 2015, several
multi-country health service coverage indices have been
developed to inform UHC measurement.
19–26Although
each effort has shown recognition of prevailing data
limitations and challenges with operationalising UHC
service coverage across myriad settings,
21,24they each have
limitations in how well they capture country-level trends
and health service needs across the life course.
17,27–31First,
current indices primarily rely solely on household survey
point estimates from multi-country survey series, which
can lead to various measurement limitations (ie, being
primarily focused on low-income to middle-income
countries; restricted sets of interventions captured; and
lags in data availability for understanding trends).
Second, most indices include either risk factor indicators
(eg, prevalence of non-smoking and non-raised blood
pressure in the UHC service coverage index,
19–21the
SDG indicator 3.8.1
4) or health-system inputs or process
indicators (eg, health workers per capita and hospital
beds per capita in the UHC service coverage index;
inpatient admission rates for Wagstaff and colleagues’
service coverage index
23,24), or both. The use of such proxy
indicators, as well as those influenced by factors outside
the health system (eg, tobacco prevalence), for service
coverage measurement could misattribute successes in
health service provision or misrepresent UHC service
coverage. With non-communicable diseases accounting
for at least 60% of early death and disability worldwide,
32the omission of non-communicable disease indicators
beyond risk factor prevalence proxies or cancer screening
is at odds with the reality of countries’ populations and
health systems. Third, approaches used to construct
overall indices of UHC service coverage typically involve
somewhat arbitrary weighting schemes (eg, a series of
geometric means
4,19–21or weighted geometric means
23,24),
and thus might not capture the alignment of services
provided given a country’s health and demographic
profile. Last, none of these approaches explicitly accounts
for the potential health gains delivered through the
health system, a limitation that inhibits our collective
understanding of whether or how gains in UHC are
improving health outcomes for all.
Recent developments from WHO indicate a revived
interest in using effective coverage for UHC monitoring;
these include the WHO GPW13 Expert Reference Group
(ERG) Task Force on Metrics recommendations on
effective service coverage measurement
33and the WHA72
resolution recommending country pilots on monitoring
UHC effective coverage.
7The GPW13 ERG also supported
initial efforts to map health services against
population-age groups within a measurement framework and to
identify indicator options across the life course in order to
estimate UHC effective coverage across countries.
33The
present analysis contributes to this endeavour through
the Global Burden of Diseases, Injuries, and Risk Factors
Study (GBD) 2019, mapping 23 effective coverage
indi-cators across health service types and population-age
groups for 204 countries and territories from 1990 to 2019.
Based on the construct of health-system effective coverage,
we aggregated individual effective coverage indicators
to produce an overall index using health gain weights,
which were derived from country-specific disease burden
estimates relative to theoretical levels of burden avertable
given intervention levels and associated effectiveness. We
compared the performance of this UHC effective coverage
measure against that of previous multi-country UHC
service coverage indices
21,24,26on a series of validity tests. We
then assessed the relationships between pooled health
spending per capita and index performance, aiming to
capture how close—or how far—countries were in
reaching UHC effective coverage frontiers relative to their
current spending. Finally, we considered applications of
this index for current global and national UHC priorities,
such as translating index performance to the number of
people covered by effective coverage for the GPW13 UHC
billion target.
Methods
Overview
Our primary
analysis involved three main steps: first, to
use intervention coverage or compute proxy measures of
effective coverage for 23 indicators; second, to calculate
the fraction of potential health gains associated with
each effective coverage indicator based on each location’s
disease burden profile; and third, to construct the overall
UHC effective coverage index by weighting each effective
coverage indicator relative to its health gains fraction.
We then did secondary analyses, assessing UHC
effec-tive coverage performance relaeffec-tive to health spending
and current trajectories towards the GPW13 UHC billion
target. Each step is summarised below and further
described in appendix 1 (pp 12–61).
This analysis uses estimates from the broader
GBD 2019,
34–36covering 204 countries and territories from
1990 to 2019. Details of disease-specific, injury-specific,
and coverage-specific data inputs and processing,
statis-tical synthesis approaches, and final models are available
in the accompanying GBD 2019 capstone publications.
34–36This study complies with the Guidelines for Accurate
and Transparent Health Estimates Reporting (GATHER)
statement,
37with further information provided in the
appendix 1 (pp 69–72).
Measurement of UHC effective coverage
Framework and indicators
Development of the UHC effective coverage
measure-ment framework and selection of effective coverage
indicators was based on consultation, methods testing,
and refinement via the WHO ERG on the GPW13
from 2017 to 2019;
7,33,38,39the background and details of
this process are provided in the appendix 1 (pp 12–28).
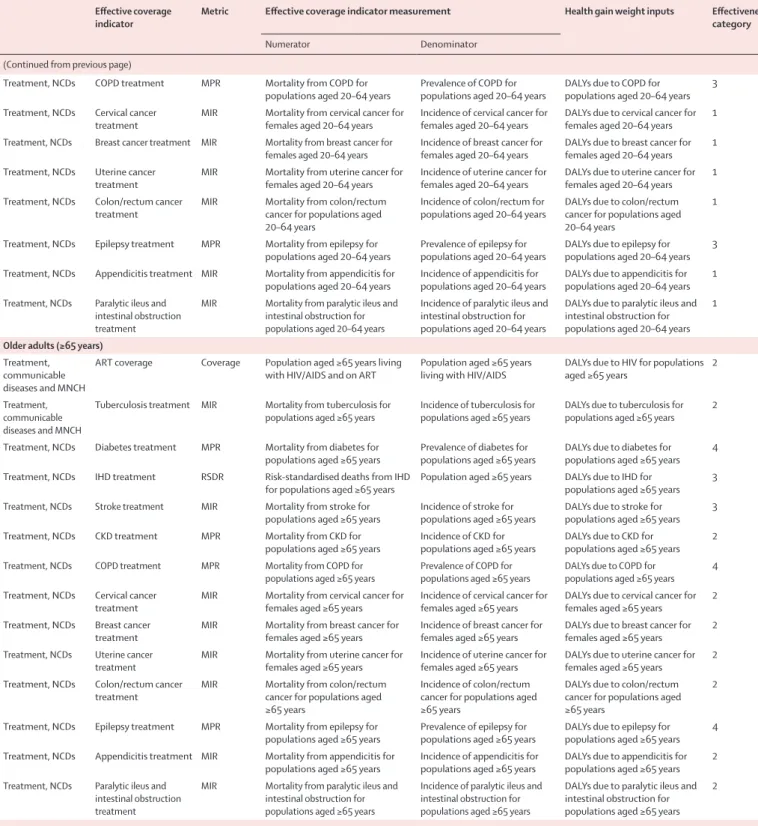
The resulting framework (figure 1) and currently
included effective coverage indicators (table 1) sought to
represent the range of different health services that
populations need across their lifespans while
recog-nising present data gaps and appeals for measurement
parsimony (appendix 1 pp 18–28).
As applied in this analysis, the UHC effective coverage
measurement framework involves 30 unique cells
from a matrix of five health service types—promotion,
prevention, treatment, rehabilitation, and palliation—
against five population-age groups (reproductive and
newborn, children younger than 5 years, children and
adolescents aged 5–19 years, adults aged 20–64 years,
and older adults aged ≥65 years). Treatment is
sub-divided into two separate groups: first, communicable
diseases and maternal, newborn, and child health; and
second, non-communicable diseases.
Effective coverage
indica tors were then mapped to these cells to represent
needed health services across the life course.
23 effective coverage indicators were included in the
present analysis (table 1). As recognised in previous
studies,
19–26data for directly measuring effective
inter-vention coverage are rarely available across health services,
locations, and over time. Subsequently, we used viable
proxy measures and analytical techniques to approximate
effective coverage for conditions considered amenable to
health care.
40–43Criteria set forth by the WHO ERG guided
selection of effective coverage indica tors and preferred
measurement approaches (appendix 1 pp 12–28).
33Such
criteria stipulated that effective coverage indicators should
be currently measurable (ie, data and methods that
support indicator measurement today); reflect differences
in effective health services and not factors outside the
immediate scope of health systems and UHC (eg, tobacco
taxation and physical infrastructure such as roads and
water systems); and use indicators already encompassed
within the SDGs and GPW13, or draw from data systems
required for monitoring of SDGs and GPW13. Several
other indicator candidates were considered from 2017
to 2019 (appendix 1 pp 12–28), but inadequate data
avail-ability, access, or quality, or a combination of these factors,
impeded their inclusion in the current analysis.
Four effective coverage indicators were measures
of intervention coverage and 19 were mortality-based
measures to proxy access to quality of care (table 1;
appendix 1 pp 30–32). For the mortality-based measures,
we primarily used mortality-to-incidence ratios (MIRs)
and mortality-to-prevalence ratios (MPRs) for chronic or
longer-term conditions (eg, diabetes or asthma). Without
better data on effective coverage, such mortality-based
measures are viewed as suitable proxies,
33,44–46providing
good signals on what access to quality care should, at
minimum, avert or protect against even if the onset of
disease cannot be wholly prevented. The main exception
was ischaemic heart disease, for which GBD input data
coverage and quality on non-fatal outcomes were less
robust than data on causes of death and related risks;
subsequently, we used risk-standardised death rates
instead of MIRs or MPRs to proxy effective coverage. As
a statistical approach used in previous GBD analyses
41,43and further described in the appendix 1 (pp 31–32),
risk standardisation aims to better isolate variations in
mortality associated with health-care access and quality
from differences in underlying risk exposures mainly
related to factors outside the health system.
Effective coverage indicators for intervention coverage
were kept on their natural scale (0–100%), whereas the
19 other effective coverage indicators were transformed
to values on a 0–100 scale (appendix pp 31–33). Across
locations and from 1990 to 2019, 0 was set by values at
the 97·5th percentile or higher (ie, “worst” levels of
MIRs) and 100 by the 2·5th percentile or lower (ie, “best”
levels of MIRs).
Figure 1: UHC effective coverage measurement framework
Additional information about the framework development process and selection of effective coverage indicators can be found in appendix 1 (pp 12–28). ART=antiretroviral therapy. DTP3=diphtheria-tetanus-pertussis vaccine, 3 doses. IHD=ischaemic heart disease. CKD=chronic kidney disease. COPD=chronic obstructive pulmonary disease. LRI=lower respiratory infection. MCV1=measles-containing-vaccine, 1 dose. MNCH=maternal, neonatal, and child health. NCDs=non-communicable diseases. TB=tuberculosis. UHC=universal health coverage.
Health service type
Population age group Promotion Prevention Treatment Rehabilitation Palliation
Communicable diseases and MNCH NCDs
Reproductive and newborn
Met need for family planning with modern contraception
Antenatal, peripartum, and postnatal care for newborn babies Antenatal, peripartum, and postnatal care for mothers
Antenatal, peripartum, and postnatal care for newborn babies
Antenatal, peripartum, and postnatal care for mothers
Children younger than 5 years Children and adolescents (5–19 years) Adults (20–64 years) Older adults (≥65 years) DTP3 coverage
MCV1 coverage LRI treatmentDiarrhoea treatment Acute lymphoid leukaemia treatment
ART coverage Acute lymphoid leukaemia
treatment Asthma treatment Epilepsy treatment Appendicitis treatment Paralytic ileus and intestinal obstruction treatment ART coverage TB treatment ART coverage TB treatment Diabetes treatment IHD treatment Stroke treatment CKD treatment COPD treatment Cervical cancer treatment Breast cancer treatment Uterine cancer treatment Colon and rectum cancer treatment
Epilepsy treatment Appendicitis treatment Paralytic ileus and intestinal obstruction treatment Diabetes treatment IHD treatment Stroke treatment CKD treatment COPD treatment Cervical cancer treatment Breast cancer treatment Uterine cancer treatment Colon and rectum cancer treatment
Epilepsy treatment Appendicitis treatment Paralytic ileus and intestinal obstruction treatment
Effective coverage
indicator Metric Effective coverage indicator measurement Health gain weight inputs Effectiveness category
Numerator Denominator
Reproductive and newborn
Promotion Met need for family planning with modern contraception
Coverage Females aged 15–49 years with demand for family planning met with modern contraception
Females aged 15–49 years with
demand for family planning 50% of DALYs due to maternal disorders for females aged 10–54 years 5 Prevention; treatment, communicable diseases and MNCH Antenatal, peripartum, and postnatal care for newborn babies
Early neonatal mortality rate
All-cause deaths during the
first 7 days of life Population of early neonates Early neonatal deaths multiplied by life expectancy at birth (on the basis of theoretical minimum risk life table) 3 Prevention; treatment, communicable diseases and MNCH Antenatal, peripartum, and postnatal care for mothers
Maternal mortality ratio
Deaths due to maternal disorders for
females aged 10–54 years Livebirths among females aged 10–54 years 50% of DALYs due to maternal disorders for females aged 10–54 years
1
Children younger than 5 years
Prevention DTP3 vaccine coverage Coverage Receipt of three doses of DTP vaccine among children aged 12–23 months
Children aged 12–23 months DALYs due to diphtheria, tetanus, and pertussis for children younger than 5 years
1 Prevention MCV1 coverage Coverage Receipt of MCV1 among children
aged 12–23 months Children aged 12–23 months DALYs due to measles for children younger than 5 years 1 Treatment,
communicable diseases and MNCH
LRI treatment MIR Mortality from LRIs for children
younger than 5 years Incidence of LRIs for children younger than 5 years DALYs due to LRIs for children younger than 5 years 1 Treatment,
communicable diseases and MNCH
Diarrhoea treatment MIR Mortality from diarrhoeal diseases
for children younger than 5 years Incidence of diarrhoeal diseases for children younger than 5 years DALYs due to diarrhoeal diseases for children younger than 5 years 1 Treatment, NCDs Acute lymphoid
leukaemia treatment MIR Mortality from acute lymphoid leukaemia for children aged 1–4 years
Incidence of acute lymphoid leukaemia for children aged 1–4 years
DALYs due to acute lymphoid leukaemia for children aged 1–4 years
1
Children and adolescents (5–19 years)
Treatment, communicable diseases and MNCH
ART coverage Coverage Populations aged 5–19 years living
with HIV/AIDS and on ART Populations aged 5–19 years living with HIV/AIDS DALYs due to HIV for populations aged 5–19 years 1 Treatment, NCDs Acute lymphoid
leukaemia treatment MIR Mortality from acute lymphoid leukaemia for populations aged 5–19 years
Incidence of acute lymphoid leukaemia for populations aged 5–19 years
DALYs due to acute lymphoid leukaemia for populations 5–19 years
1 Treatment, NCDs Asthma treatment MPR Mortality from asthma for
populations aged 5–19 years Prevalence of asthma for populations aged 5–19 years DALYs due to asthma for populations aged 5–19 years 1 Treatment, NCDs Epilepsy treatment MPR Mortality from epilepsy for
populations aged 5–19 years Prevalence of epilepsy for populations aged 5–19 DALYs due to epilepsy for populations aged 5–19 years 3 Treatment, NCDs Appendicitis treatment MIR Mortality from appendicitis for
populations aged 5–19 years Incidence of appendicitis for populations aged 5–19 years DALYs due to appendicitis for populations aged 5–19 years 1 Treatment, NCDs Paralytic ileus and
intestinal obstruction treatment
MIR Mortality from paralytic ileus and intestinal obstruction for populations aged 5–19 years
Incidence of paralytic ileus and intestinal obstruction for populations aged 5–19 years
DALYs due to paralytic ileus and intestinal obstruction for populations aged 5–19 years
1
Adults (20–64 years)
Treatment, communicable diseases and MNCH
ART coverage Coverage Population aged 20–64 years living
with HIV/AIDS and on ART Population aged 20–64 years living with HIV/AIDS DALYs due to HIV for populations aged 20–64 years 1 Treatment,
communicable diseases and MNCH
Tuberculosis treatment MIR Mortality from tuberculosis for
populations aged 20–64 years Incidence of tuberculosis for populations aged 20–64 years DALYs due to tuberculosis for populations aged 20–64 years 1 Treatment, NCDs Diabetes treatment MPR Mortality from diabetes for
populations aged 20–64 years Prevalence of diabetes for populations aged 20–64 years DALYs due to diabetes for populations aged 20–64 years 3 Treatment, NCDs IHD treatment RSDR Risk-standardised deaths from IHD
for populations aged 20–64 years Population aged 20–64 years DALYs due to IHD for populations aged 20–64 years 2 Treatment, NCDs Stroke treatment MIR Mortality from stroke for
populations aged 20–64 years Incidence of stroke for populations aged 20–64 years DALYs due to stroke for populations aged 20–64 years 2 Treatment, NCDs CKD treatment MPR Mortality from CKD for
populations aged 20–64 years Incidence of CKD for populations aged 20–64 years DALYs due to CKD for populations aged 20–64 years 1
Effective coverage
indicator Metric Effective coverage indicator measurement Health gain weight inputs Effectiveness category
Numerator Denominator
(Continued from previous page)
Treatment, NCDs COPD treatment MPR Mortality from COPD for
populations aged 20–64 years Prevalence of COPD for populations aged 20–64 years DALYs due to COPD for populations aged 20–64 years 3 Treatment, NCDs Cervical cancer
treatment MIR Mortality from cervical cancer for females aged 20–64 years Incidence of cervical cancer for females aged 20–64 years DALYs due to cervical cancer for females aged 20–64 years 1 Treatment, NCDs Breast cancer treatment MIR Mortality from breast cancer for
females aged 20–64 years Incidence of breast cancer for females aged 20–64 years DALYs due to breast cancer for females aged 20–64 years 1 Treatment, NCDs Uterine cancer
treatment MIR Mortality from uterine cancer for females aged 20–64 years Incidence of uterine cancer for females aged 20–64 years DALYs due to uterine cancer for females aged 20–64 years 1 Treatment, NCDs Colon/rectum cancer
treatment MIR Mortality from colon/rectum cancer for populations aged 20–64 years
Incidence of colon/rectum for
populations aged 20–64 years DALYs due to colon/rectum cancer for populations aged 20–64 years
1 Treatment, NCDs Epilepsy treatment MPR Mortality from epilepsy for
populations aged 20–64 years Prevalence of epilepsy for populations aged 20–64 years DALYs due to epilepsy for populations aged 20–64 years 3 Treatment, NCDs Appendicitis treatment MIR Mortality from appendicitis for
populations aged 20–64 years Incidence of appendicitis for populations aged 20–64 years DALYs due to appendicitis for populations aged 20–64 years 1 Treatment, NCDs Paralytic ileus and
intestinal obstruction treatment
MIR Mortality from paralytic ileus and intestinal obstruction for populations aged 20–64 years
Incidence of paralytic ileus and intestinal obstruction for populations aged 20–64 years
DALYs due to paralytic ileus and intestinal obstruction for populations aged 20–64 years
1
Older adults (≥65 years)
Treatment, communicable diseases and MNCH
ART coverage Coverage Population aged ≥65 years living
with HIV/AIDS and on ART Population aged ≥65 years living with HIV/AIDS DALYs due to HIV for populations aged ≥65 years 2 Treatment,
communicable diseases and MNCH
Tuberculosis treatment MIR Mortality from tuberculosis for
populations aged ≥65 years Incidence of tuberculosis for populations aged ≥65 years DALYs due to tuberculosis for populations aged ≥65 years 2 Treatment, NCDs Diabetes treatment MPR Mortality from diabetes for
populations aged ≥65 years Prevalence of diabetes for populations aged ≥65 years DALYs due to diabetes for populations aged ≥65 years 4 Treatment, NCDs IHD treatment RSDR Risk-standardised deaths from IHD
for populations aged ≥65 years Population aged ≥65 years DALYs due to IHD for populations aged ≥65 years 3 Treatment, NCDs Stroke treatment MIR Mortality from stroke for
populations aged ≥65 years Incidence of stroke for populations aged ≥65 years DALYs due to stroke for populations aged ≥65 years 3 Treatment, NCDs CKD treatment MPR Mortality from CKD for
populations aged ≥65 years Incidence of CKD for populations aged ≥65 years DALYs due to CKD for populations aged ≥65 years 2 Treatment, NCDs COPD treatment MPR Mortality from COPD for
populations aged ≥65 years Prevalence of COPD for populations aged ≥65 years DALYs due to COPD for populations aged ≥65 years 4 Treatment, NCDs Cervical cancer
treatment MIR Mortality from cervical cancer for females aged ≥65 years Incidence of cervical cancer for females aged ≥65 years DALYs due to cervical cancer for females aged ≥65 years 2 Treatment, NCDs Breast cancer
treatment MIR Mortality from breast cancer for females aged ≥65 years Incidence of breast cancer for females aged ≥65 years DALYs due to breast cancer for females aged ≥65 years 2 Treatment, NCDs Uterine cancer
treatment MIR Mortality from uterine cancer for females aged ≥65 years Incidence of uterine cancer for females aged ≥65 years DALYs due to uterine cancer for females aged ≥65 years 2 Treatment, NCDs Colon/rectum cancer
treatment MIR Mortality from colon/rectum cancer for populations aged ≥65 years
Incidence of colon/rectum cancer for populations aged ≥65 years
DALYs due to colon/rectum cancer for populations aged ≥65 years
2 Treatment, NCDs Epilepsy treatment MPR Mortality from epilepsy for
populations aged ≥65 years Prevalence of epilepsy for populations aged ≥65 years DALYs due to epilepsy for populations aged ≥65 years 4 Treatment, NCDs Appendicitis treatment MIR Mortality from appendicitis for
populations aged ≥65 years Incidence of appendicitis for populations aged ≥65 years DALYs due to appendicitis for populations aged ≥65 years 2 Treatment, NCDs Paralytic ileus and
intestinal obstruction treatment
MIR Mortality from paralytic ileus and intestinal obstruction for populations aged ≥65 years
Incidence of paralytic ileus and intestinal obstruction for populations aged ≥65 years
DALYs due to paralytic ileus and intestinal obstruction for populations aged ≥65 years
2
Additional information about the framework development process and selection of effective coverage indicators can be found in appendix 1 (pp 12–28). UHC=universal health coverage. DALYs=disability-adjusted life-years. MNCH=maternal, neonatal, and child health. DTP3=diphtheria-tetanus-pertussis vaccine, 3 doses. MCV1=measles-containing-vaccine, 1 dose. LRI=lower respiratory infection. MIR=mortality-to-incidence ratio. NCDs=non-communicable diseases. ART=antiretroviral therapy. MPR=mortality-to-prevalence ratio. IHD=ischaemic heart disease. RSDR=risk-standardised death rate. CKD=chronic kidney disease. COPD=chronic obstructive pulmonary disease.
Construction of UHC effective coverage index
As outlined by previous work,
14–17population-level measures
of effective coverage should represent the fraction of total
health gains a health system could potentially provide,
given currently available interventions, that a health
system actually delivers. This construct is thus grounded
in the principle of comparability—all health systems ought
to maximise potential health gains for their populations—
but also requires accounting for local health needs and
epidemiological profiles. For instance, if a country
currently experiences a high burden of diabetes and a
comparatively lower burden of HIV, at least equal or even
higher priority in expanding services for diabetes should
occur relative to HIV in order to further support health
gains.
To construct the UHC effective coverage index, we
weighted each effective coverage indicator relative to
their health gain weights, a metric approximating the
population health gains potentially deliverable by
health systems for each location-year. More detail is
provided in the appendix 1 (pp 32–35), but in brief,
calculations were based on three inputs for each
effective coverage indicator and corresponding
pop-ulation-age group: estimates on the 0–100 scale,
tar-geted disease burden, and effectiveness categories of
associated interventions or services (table 1). For
effec-tiveness, incremental values were assumed by category
(ie, 90% effectiveness for category 1, 70% for category 2,
50% for category 3, and so on), as informed by studies
published in the Cochrane Database of Systematic
Reviews, the Tufts Cost-Effectiveness Analysis Registry
and Global Health Cost-Effectiveness Analysis Registry,
and Disease Control Priorities, third edition (DCP3);
sensitivity analyses on shifting each effective coverage
indicator by one category (ie, moving each
category 2
indicator up to category 1 and then down to category 3)
showed high correlations with current assignments
(appendix 1 p 35).
As shown in figure 2, UHC effective coverage index
estimates based on health gain weighting and an
unweighted average across effective coverage indicators
were positively associated (r=0·95); however, effects
differed across countries.
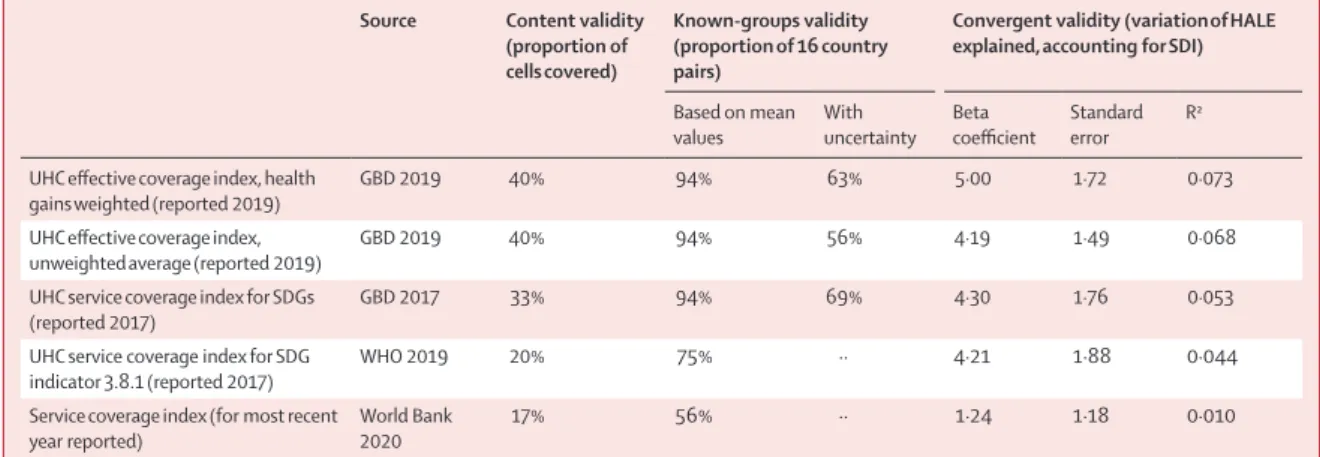
Validation
Since no gold-standard measures of UHC service
coverage currently exist, we used three types of validity
testing to compare UHC effective coverage index
perfor-mance to previously published multi-country indices of
UHC service coverage: the WHO UHC service coverage
index for 2017;
21UHC service coverage index from
GBD 2017;
26and service coverage index values from
the World Bank.
24Further details of these analyses are
provided in the appendix 1 (pp 38–52), with results
summarised in table 2.
For content validity, we computed the percentage
of 30 cells (ie, combinations of health services and
population-age groups) from the UHC effective
coverage framework that were represented by
indi-cators for each index. For known-groups validity, we
assessed how well each index could discriminate
between 16 country-pairs for which previous studies
show “country A” as having better performance or
progress on UHC service coverage than a similar
“country B”.
11,23,47–55These pairs were selected a priori,
and for each index we calculated the fraction of pairs
correctly ordered on the basis of mean estimates
and accounting for uncertainty where available. For
convergent validity, we quantified how much variation
in healthy life expectancy could be explained by each
index after removing the average relationship between
each index and overall socio demographic development
(as measured by Socio-demographic Index [SDI]). In
general, the UHC effective coverage index based on
health gain weights showed stronger performance
across these three validity mea
sures than previous
UHC service coverage measures and the unweighted
UHC effective coverage index (table 2; appendix 1
pp 38–52).
Figure 2: Comparing the UHC effective coverage index in 2019 with health gains weighting to the unweighted index (unweighted average of effective coverage indicators) in 2019
Locations are colour-coded by GBD super-region, and are abbreviated according to their ISO3 codes. ISO3 codes and corresponding location names are listed in appendix 1 (pp 64–68). UHC=universal health coverage. GBD=Global Burden of Diseases, Injuries, and Risk Factors Study.
CHN LAO MDVDD PHL LKAK THA FJI KIR FSM PNG SLB VUT AZE KAZ MNG TKM UZB BIH HUN MKD MNE SRB SVK SVN BLR EST RUS UKR JPN KOR SGP AUT DNK GRC NOR PRTR CHE C BLZ GRD GUY VCT PER BRAA MAR QATAA CAF BDI ETH KEN MWI MOZ RWAWW SOM UGA BWAWW LSOO NAM ZAF ZWE CPV TCD GMB GHA GIN GNB STP S SS SEN SLEE PLWLLWW PRI TUV VIR 20 40 60 80 100 20 40 60 80 100
UHC effective coverage index, unweighted average
UHC effective coverage index, health gains
weighted
GBD super-region
Central Europe, eastern Europe, and central Asia High income
Latin America and Caribbean North Africa and Middle East South Asia
Southeast Asia, east Asia, and Oceania Sub-Saharan Africa
For the Cochrane Database of
Systematic Reviews see
https://www.cochranelibrary. com/cdsr/reviews
For the Tufts Cost-Effectiveness
Analysis Registry see
https://cevr.tuftsmedicalcenter. org/databases/cea-registry For the Global Health
Cost-Effectiveness Analysis Registry
see https://ghcearegistry.org/ ghcearegistry/
For more on Disease Control
Priorities, third edition see
Relationship between health spending and UHC
effective coverage
To better understand potential drivers of UHC effective
coverage, we used stochastic frontier metaregression
to quantify UHC effective coverage
frontiers—esti-mated maximum levels of UHC effective coverage index
achieved given any
amount of health spending per
capita—and compared country-level UHC effective
coverage performance relative to these frontiers. The
magnitude of these gaps between the frontier and UHC
effective coverage index values provides insights into
potential inefficiencies, as well as measurement error, in
translating health spending into improved UHC effective
coverage at the population level. Further analytical details
are in the appendix 1 (pp 53–59).
Since UHC aims to minimise financial hardship
associated with receiving essential health services, we
focused on assessing the relationship between pooled
health spending per capita (ie, government spending,
prepaid private health spending, and development
assistance for health)
56and UHC effective coverage
performance. Alternative analyses, wherein out-of-pocket
spending was included (ie, total health expenditure) and
then development assistance for health was excluded
(ie, pooled domestic health expenditures), were also done
but are not reported here (appendix 2 pp 6–7).
Counting population equivalents with UHC effective
coverage
Spurred by the GPW13 UHC billion target,
6which
calls for 1 billion more people benefiting from UHC
by 2023, various approaches have been considered
for translating performance metrics into the number
of people covered by health services.
20,21,57,58For this
analysis, we used a similar approach currently
recom-mended by WHO:
58we applied index estimates as
fractional metrics and multiplied these values by
populations to approxi
mate population equivalents
with UHC effective coverage.
To assess UHC effective coverage trajectories and
their contributions towards meeting the UHC 1 billion
target, we first projected country-level UHC effective
coverage index estimates through to 2023. These
projections were based on stochastic frontier
meta-regression modelled relationships between UHC
effective coverage index and total health spending per
capita; a related method has been used previously by
GBD
26,59and is described further in the appendix 1
(pp 60–61). Taking UHC effective coverage index as a
fraction, we multiplied these values by country-level
GBD-based population forecasts through to 2023.
60Last, we aggregated these estimates globally and by
GBD super-region, and calculated additional population
equivalents with UHC effective coverage from 2018 (the
GPW13 baseline) to 2023.
Uncertainty analysis
GBD aims to propagate sources of uncertainty through
its estimation process,
34–36resulting in 1000 draws
from the posterior distribution for each measure by
location, age, sex, and year. We incorporated uncertainty
quantified for each effective coverage indicator and
associated disease burden based on GBD 2019
esti-mates, and did scaling, index construction, and UHC
effective coverage index projections at the draw-level to
reflect uncertainty. We report 95% uncertainty intervals
(95% UIs) based on the ordinal 25th and 975th draws
for each measure.
Source Content validity (proportion of cells covered)
Known-groups validity (proportion of 16 country pairs)
Convergent validity (variation of HALE explained, accounting for SDI)
Based on mean
values With uncertainty Beta coefficient Standard error R2 UHC effective coverage index, health
gains weighted (reported 2019) GBD 2019 40% 94% 63% 5·00 1·72 0·073
UHC effective coverage index,
unweighted average (reported 2019) GBD 2019 40% 94% 56% 4·19 1·49 0·068
UHC service coverage index for SDGs
(reported 2017) GBD 2017 33% 94% 69% 4·30 1·76 0·053
UHC service coverage index for SDG
indicator 3.8.1 (reported 2017) WHO 2019 20% 75% ·· 4·21 1·88 0·044
Service coverage index (for most recent
year reported) World Bank 2020 17% 56% ·· 1·24 1·18 0·010
Content validity was evaluated on the basis of the percentage of 30 matrix cells of health service types against population-age groups covered by each index. Known-groups validity was evaluated on the basis of the percentage of 16 country pairs correctly ranked based on country A’s UHC or health-system performance being recognised as better than country B’s performance; details are found in appendix 1 (pp 45–47). Convergent validity was evaluated on the basis of how much index performance could explain variation in HALE after controlling for levels of sociodemographic development (as measured by SDI). UHC=Universal health coverage. HALE=healthy life expectancy. SDI=Socio-demographic Index. GBD=Global Burden of Diseases, Injuries, and Risk Factors Study. SDGs=UN Sustainable Development Goals.
Table 2: Results for content, known-groups, and construct validity across multi-country health service indices for UHC service coverage measurement
Role of the funding source
The funder of the study had no role in study design, data
collection, data analysis, data interpretation, or writing of
the report. The corresponding author had full access to
all the data in the study and had final responsibility for
the decision to submit for publication.
Results
National UHC effective coverage patterns in 2019
In 2019, UHC effective coverage performance showed
some strong geographical patterns (figure 3), but sizeable
heterogeneities also emerged. Various European
coun-tries, including Iceland, as well as Australia, Canada,
Japan, Singapore, and South Korea, comprised the highest
decile, followed by a more geographically diverse group in
the ninth decile (eg, Costa Rica, Israel, New Zealand,
Portugal, and the USA). Sub-Saharan Africa had among
the widest range of UHC effective coverage performances
in 2019, with two countries ranking in the sixth decile
(Rwanda and South Africa) and 11 countries in the first
decile; the countries in the first decile were mainly in
western or central sub-Saharan Africa, but also spanned
the continent (eg, Angola, Lesotho, Madagascar, and
Somalia). Outside of sub-Saharan Africa, ten countries,
including Afghanistan, Haiti, Pakistan, and Papua New
Guinea, were also in the lowest decile in 2019. In east,
southeast, and south Asia, countries largely fell between
the eighth (China and Thailand) and second deciles
(Laos), with India and Indonesia occupying the third
decile. Within Latin America, various countries scored in
the eighth or seventh deciles (eg, Chile, Colombia, Peru,
and Brazil) but others saw UHC effective coverage index
values within the fourth to fifth deciles (eg, Bolivia,
Guatemala, and Nicaragua).
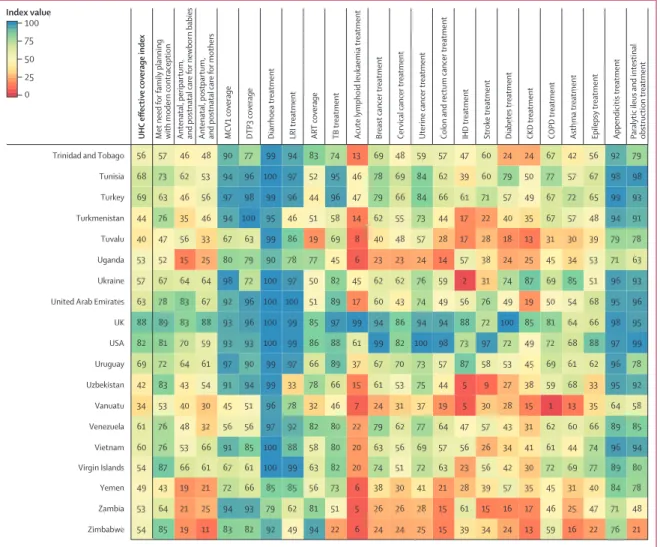
Performance on the overall UHC effective coverage
index often corresponded with levels achieved across
individual effective coverage indicators (figure 4); for
instance, countries with effective coverage index values
of 85 or higher generally had the vast majority of
effec-tive coverage indicators exceeding 80. Although
high-performing locations usually had lower values for at least
some subsets of indicators (eg, met need for family
planning or antiretroviral therapy coverage), such
indi-cators often represented areas of lower potential health
gains—especially relative to effective coverage indicators
proxying health services or interventions for conditions
with higher potential health gains in these countries
(eg, cardiovascular diseases, cancers, and diabetes).
Countries and territories with fairly low overall UHC
effective coverage index performance in 2019 (ie, <40)
scored similarly low across most effective coverage
indicators, although vaccine coverage and proxies for
lower respiratory infection and diarrhoea treatment were
among the main exceptions.
Figure 3: Map of the UHC effective coverage index, by decile, in 2019
Deciles are based on the distribution of UHC effective coverage index values in 2019. UHC=universal health coverage. UHC effective coverage index deciles
22·3 to <41·0 41·0 to <46·3 46·3 to <50·4 50·4 to <54·0 54·0 to <59·2 59·2 to <62·5 62·5 to <69·2 69·2 to <76·5 76·5 to <87·7 87·7 to 96·3
Caribbean and central America Persian Gulf Balkan Peninsula Southeast Asia West Africa Eastern Mediterranean
(Figure 4 continues on next page) 68 61 60 78 93 93 100 99 75 64 80 75 85 69 98 62 73 44 82 86 70 97 88 74 Chile 10 4 6 16 58 39 21 25 40 28 11 8 10 6 51 31 28 15 39 16 35 65 23 31 Chad 5 3 5 20 49 48 21 33 37 13 1 1 1 0 20 7 19 9 23 10 31 42 19 22 Central African Republic
75 83 98 87 93 86 100 100 86 96 99 99 98 100 87 100 70 70 87 77 68 99 100 90 Canada 18 9 6 45 71 78 60 45 45 44 25 24 27 16 51 34 15 12 59 28 45 82 65 42 Cameroon 26 27 8 59 91 92 97 56 79 77 40 42 53 27 50 24 34 39 47 28 65 87 67 57 Cambodia 42 41 12 69 100 100 97 86 83 80 56 44 54 34 38 50 44 30 59 58 52 96 90 62 Cape Verde 19 12 6 38 91 95 69 72 75 49 14 12 14 7 38 26 18 23 28 18 36 48 40 50 Burundi 14 16 6 47 95 94 68 6 56 48 20 20 19 11 39 22 25 19 57 31 36 64 31 42 Burkina Faso 75 73 47 54 91 90 99 94 78 90 84 75 90 68 32 27 59 51 75 95 63 92 81 63 Bulgaria 65 51 31 69 98 98 96 94 62 87 77 76 69 66 54 74 41 30 65 68 54 97 86 66 Brunei 40 42 25 88 99 86 98 89 63 85 73 59 72 57 66 65 44 37 61 76 73 68 77 65 Brazil 20 32 10 78 85 84 86 71 94 66 47 45 49 29 60 37 10 14 45 23 50 87 68 58 Botswana 93 96 50 26 68 78 100 100 68 79 71 69 83 60 56 50 49 62 76 100 66 96 85 64 Bosnia and Herzegovina
33 22 8 52 95 92 98 80 64 71 49 42 43 49 62 46 26 4 52 60 56 88 55 52 Bolivia 21 20 8 80 99 100 95 70 65 75 45 40 48 28 43 33 47 27 29 23 54 96 87 51 Bhutan 81 60 82 87 99 98 100 99 54 100 95 83 87 92 76 86 57 56 86 83 91 97 98 78 Bermuda 9 12 7 28 73 81 77 32 56 53 20 18 20 12 51 33 30 17 52 27 45 75 51 45 Benin 48 39 11 66 89 82 97 85 54 60 65 52 59 47 66 53 24 18 57 50 52 87 70 54 Belize 90 92 99 86 96 99 100 100 85 96 94 71 98 91 96 78 91 72 86 77 70 99 92 87 Belgium 85 73 69 73 97 100 100 99 76 80 85 75 94 80 13 42 90 98 73 98 55 98 97 70 Belarus 47 45 28 67 91 90 100 95 86 89 77 64 71 66 68 56 31 35 77 62 60 93 74 61 Barbados 22 15 7 79 94 92 96 69 60 79 41 36 43 24 48 11 47 52 51 15 56 94 85 54 Bangladesh 88 52 49 69 99 100 100 100 70 96 79 66 85 69 65 81 35 46 81 48 67 98 94 71 Bahrain 60 36 14 86 89 90 99 91 76 63 72 63 67 57 56 53 43 28 71 65 65 89 74 61 The Bahamas 27 63 15 32 87 82 97 37 83 77 61 52 73 45 13 18 44 48 69 72 47 96 94 48 Azerbaijan 89 97 99 81 94 88 100 100 85 95 93 79 99 95 84 99 72 61 95 91 78 100 99 86 Austria 85 92 87 88 91 96 100 99 85 99 98 100 86 100 100 88 78 70 92 69 67 100 98 89 Australia 60 63 35 43 94 93 99 78 83 84 72 62 80 59 34 48 42 67 63 100 89 95 95 62 Armenia 58 44 26 73 92 86 99 95 55 67 66 68 76 53 79 51 53 28 67 78 71 95 70 61 Argentina 64 50 26 83 94 92 99 93 46 100 76 58 68 65 67 49 34 26 77 74 53 92 83 60 Antigua and Barbuda
18 19 6 32 54 42 80 65 22 46 19 18 21 11 50 38 28 24 50 28 56 79 63 39 Angola 100 100 99 88 98 99 100 100 39 95 98 93 100 97 99 94 96 68 89 79 74 98 97 92 Andorra 66 36 10 75 91 82 99 93 57 87 50 55 58 42 42 56 40 13 21 44 53 88 86 53 American Samoa 36 38 26 75 84 92 99 95 80 94 70 63 67 52 46 60 72 41 65 47 62 96 97 65 Algeria 56 81 58 10 92 98 100 90 41 92 84 81 88 65 60 31 94 70 81 68 57 98 99 70 Albania 18 11 5 43 62 65 92 62 45 60 18 15 18 7 21 27 41 9 39 20 23 67 50 39 Afghanistan UHC eff ectiv e co ve rage inde x Met need f or family planning with moder n contraception Antenatal, per ipar tum,
and postnatal care f
or ne
wbor
n babies
Antenatal, postpar
tum,
and postnatal care f
or mothers MCV1 co ve rage DTP3 co ve rage
Diarrhoea treatment LRI treatment ART co
ve
rage
TB treatment Acute lymphoid leukaemia treatment Breast cancer treatment Cerv
ical cancer treatment
Uter
ine cancer treatment
Colon and rectum cancer treatment IHD treatment Strok
e treatment
Diabetes treatment CKD treatment COPD treatment Asthma treatment Epilepsy treatment Appendicitis treatment Paralytic ileus and intestina
l obstr uction treatment 0 25 50 75 100 Index value
(Figure 4 continues on next page) 100 100 90 69 94 94 100 100 84 93 88 79 93 80 66 76 86 87 87 73 77 98 95 82 Czech Republic 92 100 98 85 89 99 100 100 33 94 98 64 98 99 77 69 66 52 77 100 85 100 89 80 Cyprus 89 46 49 89 99 99 100 97 76 96 88 74 83 79 52 63 85 51 73 70 74 90 90 73 Cuba 83 91 91 39 89 91 100 100 81 90 87 98 100 82 64 55 80 75 85 99 69 99 95 79 Croatia 7 13 7 40 72 75 86 46 54 42 19 18 19 12 51 43 25 16 48 31 44 78 60 43 Côte d’Ivoire 61 55 42 86 100 97 99 98 85 82 89 73 86 77 80 88 84 48 75 80 82 92 95 79 Costa Rica 100 95 35 78 96 83 100 98 21 90 73 73 85 69 56 78 23 37 75 74 79 95 94 62 Cook Islands 24 14 6 40 72 65 83 83 30 48 22 21 24 13 36 37 24 18 47 36 62 80 69 44 Congo 11 24 6 33 83 84 85 60 66 61 18 20 22 11 46 46 19 25 42 33 50 68 59 48 Comoros 56 42 30 87 94 91 99 93 79 87 84 67 82 71 73 80 76 55 67 83 77 91 89 74 Colombia 70 75 72 96 98 99 99 90 32 97 91 60 88 86 66 43 80 61 41 86 65 98 98 70 China 16 16 12 62 60 57 74 71 51 63 21 17 22 13 60 31 14 28 31 35 41 12 4 47 Ethiopia 28 34 6 81 93 88 79 61 93 40 26 23 27 16 56 32 1 3 43 20 40 79 56 53 eSwatini 100 96 82 73 91 100 100 99 86 79 90 93 100 91 61 72 78 74 84 87 53 100 99 82 Estonia 23 5 6 30 100 95 73 69 45 49 13 10 13 8 41 15 13 17 37 28 41 55 40 42 Eritrea 24 24 6 33 39 45 96 82 30 66 36 31 37 22 69 52 27 23 58 43 78 90 83 50 Equatorial Guinea 63 50 17 82 97 87 98 96 58 81 75 50 74 58 58 73 40 10 69 75 75 91 90 62 El Salvador 73 51 12 85 97 96 89 88 75 86 57 37 67 42 12 67 34 28 59 36 79 95 85 55 Egypt 51 38 16 72 75 81 99 92 63 75 69 61 68 68 80 70 37 13 65 75 65 94 80 64 Ecuador 27 32 10 84 83 75 97 92 71 62 64 54 59 46 28 42 28 23 56 35 55 80 94 52 Dominican Republic 29 32 10 83 86 93 98 86 47 71 62 51 57 44 64 51 38 14 59 47 40 85 62 52 Dominica 20 8 6 52 83 57 88 60 19 56 25 20 27 15 59 45 16 24 57 39 53 77 67 45 Djibouti 82 100 100 81 92 97 100 100 70 95 90 91 97 90 99 75 67 71 81 85 66 98 93 84 Denmark 19 7 6 23 82 73 81 75 78 40 15 13 15 8 42 25 31 22 33 20 46 79 62 45 Democratic Republic of the Congo
44 35 6 72 80 86 95 84 70 75 40 45 54 26 19 51 5 21 9 6 49 76 73 45 54 50 19 83 95 90 100 90 24 92 63 67 78 57 28 81 55 34 35 63 85 96 97 64 Guam 45 43 13 79 92 88 99 87 59 94 68 55 59 53 51 45 31 16 65 66 54 92 61 50 Grenada 60 70 21 75 91 95 100 98 75 87 67 81 67 56 71 72 67 57 50 65 45 94 75 69 Greenland 90 90 97 61 97 100 100 99 86 82 92 70 98 89 67 54 98 59 89 99 85 99 94 80 Greece 17 21 6 43 94 93 89 70 37 50 32 30 35 20 45 38 25 17 47 27 68 67 61 49 Ghana 88 90 100 83 97 97 100 100 83 97 93 94 98 91 80 87 90 61 97 81 81 99 93 86 Germany 62 51 20 52 93 84 99 95 83 88 66 57 74 50 31 18 55 60 78 37 71 96 82 56 Georgia 20 4 6 30 89 93 91 72 33 55 22 20 24 13 43 38 24 16 48 32 37 80 52 48 The Gambia 29 20 7 49 69 78 92 86 72 69 34 29 35 19 45 46 21 14 55 40 70 88 83 53 Gabon 90 85 99 92 90 97 100 100 87 87 95 87 99 92 100 84 71 83 97 86 67 99 91 91 France 100 96 98 89 93 88 100 100 80 93 100 94 96 97 72 83 100 91 96 94 68 100 95 91 Finland Fiji 55 29 8 61 74 60 98 88 12 58 36 44 52 30 16 24 10 2 2 22 37 75 72 34 Federated States of Micronesia
UHC eff ectiv e co ve rage inde x Met need f or family planning with moder n contraception Antenatal, per ipar tum,
and postnatal care f
or ne
wbor
n babies
Antenatal, postpar
tum,
and postnatal care f
or mothers MCV1 co ve rage DTP3 co ve rage
Diarrhoea treatment LRI treatment ART co
ve
rage
TB treatment Acute lymphoid leukaemia treatment Breast cancer treatment Cerv
ical cancer treatment
Uter
ine cancer treatment
Colon and rectum cancer treatment IHD treatment Strok
e treatment
Diabetes treatment CKD treatment COPD treatment Asthma treatment Epilepsy treatment Appendicitis treatment Paralytic ileus and intestina
l obstr uction treatment 0 25 50 75 100 Index value
(Figure 4 continues on next page) 69 74 97 77 93 96 100 99 76 99 92 77 97 92 77 80 81 66 99 85 82 99 96 83 Malta 3 6 6 39 73 73 75 22 41 50 18 16 20 11 56 31 25 16 46 20 31 73 42 41 Mali 41 36 40 37 91 87 99 97 28 88 74 71 85 71 63 64 54 38 73 52 60 100 100 67 Maldives 73 46 23 77 90 90 100 98 76 92 66 63 78 61 43 59 64 42 58 48 84 95 82 67 Malaysia 16 16 6 72 93 92 86 63 82 46 18 20 19 10 53 35 23 40 43 32 39 65 47 56 Malawi 18 12 5 51 73 86 59 62 12 59 15 15 15 8 39 29 22 29 37 18 44 64 53 40 Madagascar 99 85 99 88 99 100 100 100 83 99 95 90 99 93 100 82 100 70 99 78 68 100 94 91 Luxembourg 93 84 55 72 90 100 100 99 66 80 78 68 74 69 34 57 77 97 76 92 57 99 97 70 Lithuania 62 55 21 67 87 87 99 97 48 89 65 57 74 47 47 72 71 40 78 55 59 95 95 66 Libya 18 1 5 47 92 89 68 72 42 59 21 19 22 13 55 38 34 16 63 35 43 75 47 48 Liberia 12 9 6 77 98 99 73 49 62 22 14 11 18 10 51 16 1 2 28 0 30 71 30 39 Lesotho 67 67 69 66 81 76 100 98 67 93 85 79 91 68 37 100 78 53 87 64 72 98 99 75 Lebanon 86 72 61 71 98 100 100 99 68 85 80 40 95 70 39 45 69 87 79 92 54 100 98 70 Latvia 22 21 7 67 70 62 90 52 70 50 29 34 42 19 35 26 33 19 41 3 68 88 64 44 Laos 37 49 14 66 90 92 96 75 56 85 60 54 73 39 30 19 63 50 56 83 31 94 91 53 Kyrgyzstan 66 89 73 85 95 98 100 97 83 99 87 74 91 81 73 85 92 66 80 69 77 100 99 82 Kuwait 33 13 6 41 80 70 92 85 42 28 19 27 29 15 23 19 3 5 0 1 21 41 28 36 Kiribati 23 11 7 74 77 84 77 67 63 58 22 14 21 11 63 42 19 26 42 32 56 23 8 52 Kenya 65 68 29 79 95 95 99 81 74 86 70 69 78 55 38 21 67 57 43 53 52 96 90 59 Kazakhstan 47 54 38 57 81 89 100 93 50 92 75 63 82 61 75 83 53 38 79 62 76 99 93 70 Jordan 100 92 98 60 97 98 95 99 78 92 100 99 97 100 99 98 100 83 96 92 89 100 98 96 Japan 36 37 14 85 100 96 99 96 77 79 74 59 63 59 81 44 27 27 67 50 60 91 85 57 Jamaica 95 93 99 70 93 100 100 100 82 99 97 97 100 99 96 74 81 76 92 97 83 98 98 89 Italy 95 90 93 83 98 96 100 100 84 94 88 84 95 83 99 87 57 45 90 79 72 99 93 81 Israel 87 97 100 80 91 95 100 100 84 93 97 93 100 97 87 82 98 80 87 75 73 100 97 90 Ireland 44 50 18 55 79 78 99 94 61 86 64 53 74 48 41 47 44 31 72 54 67 99 96 58 Iraq 55 68 43 78 99 98 99 96 40 89 77 64 83 62 52 68 62 56 69 52 74 96 98 70 Iran 32 27 4 78 82 77 89 85 48 70 43 41 55 33 38 33 9 39 42 23 96 43 32 49 Indonesia 17 22 15 75 94 90 80 59 72 76 36 35 43 23 34 26 54 34 29 32 39 47 53 47 India 95 100 100 87 94 91 100 100 86 98 99 98 100 99 93 96 100 88 99 89 78 100 99 95 Iceland 92 74 77 57 97 98 100 99 79 96 81 69 90 73 51 67 75 74 69 83 79 95 95 72 Hungary 46 30 8 78 93 89 93 95 85 59 57 34 58 39 54 21 63 13 33 46 51 70 84 54 Honduras 15 3 4 45 72 71 75 53 55 60 28 22 17 17 15 16 30 13 37 19 24 44 20 36 Haiti 28 22 7 57 95 91 94 83 62 54 53 43 47 35 21 24 23 5 58 43 36 64 52 41 Guyana 9 15 6 48 80 74 65 68 47 13 16 17 14 10 26 20 16 5 40 21 32 61 22 36 Guinea-Bissau 12 2 6 21 49 45 74 24 47 36 12 14 13 8 42 29 21 12 45 22 34 73 55 32 Guinea 54 28 9 68 82 78 92 79 67 59 58 36 49 36 64 59 31 16 51 48 44 78 67 52 Guatemala UHC eff ectiv e co ve rage inde x Met need f or family planning with moder n contraception Antenatal, per ipar tum,
and postnatal care f
or ne
wbor
n babies
Antenatal, postpar
tum,
and postnatal care f
or mothers MCV1 co ve rage DTP3 co ve rage
Diarrhoea treatment LRI treatment ART co
ve
rage
TB treatment Acute lymphoid leukaemia treatment Breast cancer treatment Cer
vical cancer treatment
Uter
ine cancer treatment
Colon and rectum cancer treatment IHD treatment Strok
e treatment
Diabetes treatment CKD treatment COPD treatment Asthma treatment Epilepsy treatment Appendicitis treatment Paralytic ileus and intestina
l obstr uction treatment 0 25 50 75 100 Index value
(Figure 4 continues on next page) 48 66 29 60 87 92 99 83 69 88 71 62 84 62 24 35 84 85 71 100 48 97 93 62 Moldova 50 41 22 77 98 82 99 82 21 88 66 58 80 54 21 47 27 21 53 38 60 89 91 49 Niue 6 15 14 39 61 54 41 1 50 65 28 24 29 18 49 43 19 30 58 46 50 58 44 38 Nigeria 16 9 7 43 64 60 42 26 58 46 14 12 14 6 41 28 18 22 42 22 33 69 28 35 Niger 58 49 19 87 100 100 97 90 33 82 77 52 69 59 56 62 42 6 53 68 67 90 89 57 Nicaragua 80 76 92 83 90 95 100 100 79 100 99 85 89 98 83 76 72 62 83 57 64 99 99 83 New Zealand 84 93 100 83 93 95 100 100 80 94 97 93 99 97 99 82 81 77 87 90 75 98 94 90 Netherlands 24 12 7 62 95 86 94 56 66 71 32 32 36 22 49 11 59 25 9 21 29 92 78 47 Nepal 44 28 9 53 100 99 98 75 18 73 51 58 66 43 9 13 8 5 25 22 40 78 82 42 Nauru 27 28 7 82 100 91 90 80 94 64 39 33 41 25 59 34 15 25 39 19 52 87 61 62 Namibia 20 25 8 78 84 73 93 48 71 76 36 42 52 25 48 3 23 33 41 4 58 94 85 47 Myanmar 14 19 5 47 97 95 84 50 50 24 16 15 15 8 51 27 14 19 48 30 42 56 17 44 Mozambique 42 34 12 73 91 96 95 91 77 79 54 40 57 32 16 53 58 34 57 40 69 94 92 58 Morocco 85 85 72 45 60 87 100 99 85 88 80 80 89 71 57 18 72 57 88 100 86 99 90 66 Montenegro 44 47 9 67 92 96 97 71 45 75 50 41 67 34 30 0 55 39 47 64 47 76 54 48 Mongolia 100 100 100 89 88 100 100 100 38 80 97 98 100 97 83 82 100 83 100 89 91 99 93 91 Monaco 53 46 20 77 87 74 98 91 76 76 78 52 77 62 64 81 33 16 60 71 73 74 80 61 Mexico 52 46 24 75 85 85 99 96 80 85 69 60 72 63 53 62 21 11 70 34 57 99 98 56 Mauritius 18 3 6 29 80 69 82 73 79 69 31 27 33 20 74 55 19 24 63 52 62 85 68 53 Mauritania 46 27 7 86 88 64 98 82 37 73 29 37 43 18 11 30 35 8 4 16 35 68 67 44 Marshall Islands 69 59 72 71 99 93 100 99 67 97 85 69 91 78 75 97 49 58 97 60 95 100 97 80 Qatar 65 63 68 88 91 88 100 98 67 71 94 84 86 88 80 97 48 37 76 76 77 98 95 76 Puerto Rico 97 86 96 80 100 98 100 100 86 80 94 95 98 88 98 60 81 48 84 100 61 97 95 84 Portugal 89 95 75 47 92 95 100 99 87 93 73 32 91 51 67 57 77 80 84 99 64 97 89 73 Poland 41 39 3 57 84 81 95 79 13 86 43 48 60 33 37 42 22 16 52 21 83 61 66 55 Philippines 50 38 20 65 87 84 98 91 70 88 72 69 74 90 93 79 52 42 93 78 83 95 81 76 Peru 58 34 13 80 97 92 98 94 55 76 69 56 69 50 68 63 29 17 65 79 66 85 84 63 Paraguay 26 16 6 40 54 40 86 36 51 62 23 30 29 18 30 29 19 42 7 8 40 73 80 38 Papua New Guinea
58 39 31 76 94 82 96 92 71 73 83 67 81 67 82 74 56 41 73 61 74 94 91 71 Panama 59 64 20 66 99 99 100 98 1 84 65 52 74 49 47 51 40 38 65 66 48 96 94 61 Palestine 59 33 22 67 89 81 99 80 20 87 66 68 73 60 19 49 24 8 34 51 69 89 95 45 Palau 2 15 10 52 75 80 79 50 41 71 27 29 35 18 34 22 33 10 25 17 47 36 51 39 Pakistan 63 62 50 46 88 89 100 97 49 96 79 68 83 69 41 62 43 67 54 89 95 99 99 71 Oman 99 100 99 86 97 97 100 100 73 95 96 94 98 96 97 100 97 82 93 95 75 100 99 94 Norway 71 37 33 78 97 93 99 93 51 95 71 71 83 66 38 54 40 15 19 64 73 97 91 60 Northern Mariana Islands
61 85 53 19 85 87 100 98 83 86 79 60 88 62 49 20 52 60 66 95 72 99 82 61 North Macedonia 52 45 12 86 99 100 98 89 30 86 53 55 71 48 41 24 57 45 30 56 39 95 88 53 North Korea UHC eff ectiv e co ve rage inde x Met need f or family planning with moder n contraception Antenatal, per ipar tum,
and postnatal care f
or ne
wbor
n babies
Antenatal, postpar
tum,
and postnatal care f
or mothers MCV1 co ve rage DTP3 co ve rage
Diarrhoea treatment LRI treatment ART co
ve
rage
TB treatment Acute lymphoid leukaemia treatment Breast cancer treatment Cerv
ical cancer treatment
Uter
ine cancer treatment
Colon and rectum cancer treatment IHD treatment Strok
e treatment
Diabetes treatment CKD treatment COPD treatment Asthma treatment Epilepsy treatment Appendicitis treatment Paralytic ileus and intestina
l obstr uction treatment 0 25 50 75 100 Index value