1 © The Author(s) 2020. Published by Oxford University Press.
This is an Open Access article distributed under the terms of the Creative Commons Attribution Non-Commercial License (http:// creativecommons.org/licenses/by-nc/4.0/), which permits non-commercial re-use, distribution, and reproduction in any medium, provided the original work is properly cited. For commercial re-use, please contact journals.permissions@oup.com
Epidemiology
Patterns of multimorbidity and
pharmacotherapy: a total population
cross-sectional study
Tomas Forslund
a,b,, Axel C Carlsson
c,d, Gunnar Ljunggren
c,d,
Johan Ärnlöv
c,eand Caroline Wachtler
c,*
aDepartment of Healthcare Development, Stockholm Region, Public Healthcare Services Committee, Box 6909, Stockholm S-102 39, Sweden, bKarolinska Institutet, Centre for Pharmacoepidemiology, Stockholm S-171 76, Sweden, cDepartment of Neurobiology, Care Sciences and Society, Division of Family Medicine and Primary Care, Karolinska Institutet, Alfred Nobels allé 23, D2, Huddinge, S-141 83, Sweden, dAcademic Primary Health Care Centre, Stockholm Region, Stockholm, Sweden and eDalarna University, School of Health and Social Sciences, Falun S-791 88, Sweden
*Correspondence to Caroline Wachtler, Karolinska Institute, Department of Neurobiology, Care Sciences and Society, Division of Family Medicine and Primary Care, Alfred Nobels allé 23, D2, Huddinge S-141 83, Sweden; E-mail: caroline. wachtler@ki.se
Abstract
Background: Treatment of multimorbid patients can be improved. Development of patient-centred care of high-quality requires context-bound understanding of the multimorbid population’s patterns of demographics, co-morbidities and medication use.
Objective: The aim of this study was to identify patterns of multimorbidity in the total population of Region Stockholm, Sweden, by exploring demographics, claimed prescription drugs, risk of mortality and non-random association of conditions.
Methods: In this cross-sectional descriptive population-based cohort study, we extracted data from the Swedish VAL database (N = 2 323 667) including all consultations in primary and specialized outpatient care, all inpatient care and all prescriptions claimed during 2017. We report number of chronic conditions and claimed prescription drugs, physical and mental co-morbidity, and 1-year mortality. We stratified the analyses by sex. We examined non-random associations between diseases using cluster analysis.
Results: In total, 21.6% had multimorbidity (two or more chronic conditions) and 24.1% had polypharmacy (more than five claimed prescription drugs). Number of claimed drugs, co-occurrence of mental and physical conditions, and 1-year mortality increased as multimorbidity increased. We identified seven multimorbidity clusters with clinically distinct characteristics. The smallest cluster (7% of individuals) had prominent cardiovascular disease, the highest 1-year mortality rate, high levels of multimorbidity and polypharmacy, and was much older. The largest cluster (27% of individuals) was younger and heterogenous, with primarily mental health problems.
Conclusions: Individuals with chronic conditions often show clinical complexity with both concordant and discordant conditions and polypharmacy. This study indicates that clinical guidelines addressing clustering of conditions may be one strategy for managing complexity.
Key words: Chronic disease, frailty, multimorbidity, phamacology/drug reactions, population health, primary health care
Introduction
As multimorbidity, defined as two or more chronic health conditions, becomes the norm, patients are increasingly complex in primary care where most consultations take place (1–4). Degree of multimorbidity has been shown to be highly correlated with health care resource use and costs in a variety of contexts (5–8). Multimorbidity leads to polypharmacy, increased hospitalization and non-adherence, and increased potentially inappropriate medication (9,10). Despite this, evidence-based management guidelines for common chronic con-ditions are usually based on a single-disease paradigm and seldom take into account co-morbidities or patient complexity (11,12). The NICE guidelines and comprehensive review of the literature pub-lished 2016 recommend a shift in primary care towards systematic identification of patients with multimorbidity who need individually tailored management (13).
High-quality patient-centred care requires context-bound under-standing of the multimorbid population’s patterns of demographics, co-morbidities and medication use (14). In Sweden, there is a na-tional impetus to improve care of individuals with multimorbidity (15). The Swedish Study on Aging and Care in Kungsholmen (SNAC-K), following a cohort of individuals aged 60+ in central Stockholm, indicated that some constellations of multimorbidity and trajectories of development are likely to lead to decreased function and cognitive ability (16–18). However, population-based patterns of multimorbidity, medication and increased risk for mortality have yet to be described.
The aim of this study was to identify patterns of multimorbidity in the total population of Region Stockholm, Sweden, by exploring demographics, claimed prescription drugs, risk of mortality and non-random association of conditions.
Material and methods
In this cross-sectional descriptive population-based cohort study, we used the Swedish VAL database to identify the entire population of Region Stockholm 31 December 2017 (N = 2 323 667).
Database and study sample
Region Stockholm (Stockholm city and surrounding suburban and rural areas) has 2.3 million residents, ~20% of the total population of Sweden. In Sweden, all necessary medical care is funded by public health insurance covering all legal residents. Services are provided by region, either at public facilities or by private providers under contractual agreement with the region. Providers are obligated to record diagnoses and file reports, including information on health care utilization, reasons for hospitalizations and consultations in pri-mary and specialist care, all diagnosis codes, data on prescriptions and socio-demographics. In Region Stockholm, this information is automatically collated in the comprehensive health administration VAL database used for health care planning, practice remuneration and quality assessment. All living residents of Region Stockholm are registered in VAL. Date of death as well as migration in and out of the region are included in VAL. The VAL database is described in more detail elsewhere (19).
In this study, we included data from all consultations in primary care, all consultations in specialized outpatient care, all inpatient care and all prescriptions claimed during 2017. All extracted data were anonymized.
Variable identification
Chronic conditions and multimorbidity
As we wanted to investigate multimorbidity separately from pharma-cotherapy, we revised a definition based on 40 chronic health condi-tions identified as internationally clinically important (2) using only ICD codes (Supplementary Table 1). We define multimorbidity as two or more chronic health conditions across the 40 listed chronic conditions. We report degree of multimorbidity using the inter-vals 0–1, 2–4, 5–9 and 10+ diagnoses, based on current literature indicating that 5+ and 10+ diagnoses reflect clinically relevant cut points (2).
Pharmacotherapy
We collected the Anatomical Therapeutic Chemical (ATC) Classification System codes for all the individual’s claimed prescrip-tion drugs during 2017. Each ATC code was counted as one claimed prescription in the analysis to avoid overcounting because of drug it-eration. We report number of claimed prescription drugs in the inter-vals 0–4, 5–9, 10–14 and 15+, using accepted previous definitions of polypharmacy (20), and the current literature indicating that 15+ medications compared with less than five medications substantially increases risk for adverse events (21).
Analyses
All descriptive data are reported as frequencies. For the 40 chronic conditions, we described median age, median number of co-morbid-ities, median number of medications and 1-year mortality. We identi-fied the top 12 most common multimorbid conditions as those with the highest median number of co-morbidities and the largest number of individuals. For each degree of multimorbidity, we reported sex, age group (10-year intervals), number of claimed prescription drugs, frequency of physical–mental health co-morbidity, frequency for the top 12 conditions and 1-year mortality rate, calculated using mor-tality data from 1 January until 31 December 2018. For graphical display we defined age groups in 20-year intervals.
We stratified data for sex and repeated frequency calculations. Relative risk was calculated for women compared with men for age group (10-year intervals), number of claimed prescription drugs, fre-quency of physical–mental health co-morbidity, frefre-quency of the top 12 conditions and 1-year mortality rate.
We use percentages and graphical display to describe the propor-tions of the top 25 co-morbidities and the proporpropor-tions of the top 25 claimed medications for the top 12 conditions.
To examine non-random associations between diseases in indi-viduals, we identified individuals with at least two conditions and conducted a cluster analysis. To find the optimum number of clusters the data was initially grouped into 50 clusters using the FASTCLUS k-means procedure with 100 iterations. We used the CLUSTER pro-cedure using the centroid method to determine the optimal number Key Messages
• Multimorbidity present in 22% of individuals in the Stockholm region. • Increased multimorbidity associated with high prevalence of sedatives.
• Clinical multimorbidity management guidelines should address clustering of conditions.
of clusters. The Cubic Clustering Criterion, Pseudo F and Pseudo T-Squared statistics all suggested seven clusters which was deemed appropriate after clinical analysis. Last, individuals were grouped into seven clusters using the k-means procedure with 100 iterations.
Data analyses were performed with SAS EG 7.1. Due to the na-ture of the database, there was no missing data.
Results
Table 1 shows demographics, multimorbidity and pharmaco-therapy characteristics, and 1-year mortality rate of all 2 323 667 individuals residing in the Stockholm region during 2017. 21.6% had multimorbidity. The top 12 conditions associated with multimorbidity were heart failure, chronic kidney disease, cor-onary heart disease, atrial fibrillation, COPD, stroke/TIA, dementia, peripheral vascular disease, hypertension, diabetes and cancer (Supplementary Table 2). One-year all-cause mortality increased as number of diagnoses increased (from 0.1% to 19.3%). There was
2.7%, absolute 1-year risk of mortality in multimorbid patients, but these deaths represented most deaths in the total population (>85%). In the total population, 24% had more than five claimed prescrip-tion drugs and number of drugs increased as the number of diag-noses increased. Of individuals with >10 diagdiag-noses, 80% had >15 medications. Co-occurrence of mental and physical conditions in-creased with number of diagnoses (24.1–58.5%).
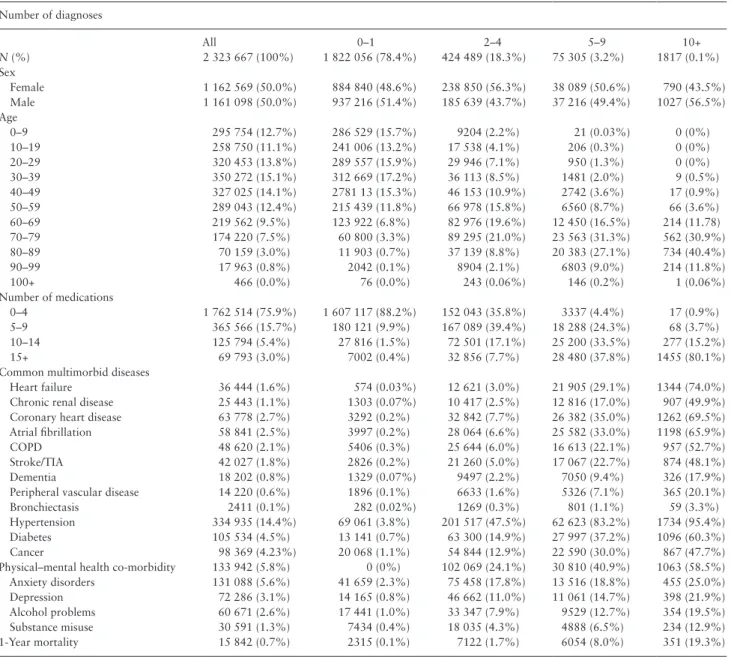
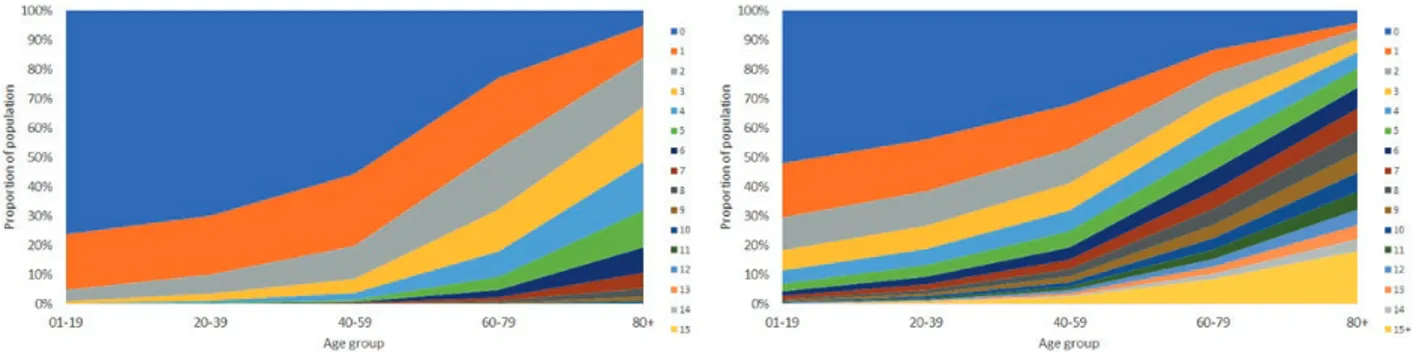
With age, the proportion of individuals with multimorbidity and number of co-morbidities increased (Fig. 1a), as did number of claimed prescription drugs (Fig. 1b). Multimorbidity increased after age 50, existed in more than half of the population at age 70, and in >80% over age 80. A similar age-related pattern was seen in the proportion of individuals with >5, 10 and 15 claimed prescription drugs. However, after the age of 90, the population showed de-creased multimorbidity and polypharmacy.
Disease patterns differed between the sexes (Table 2, Supplementary Table 3). Under 60, women were more likely than men to have multimorbidity, with elevated risk of 10+ conditions
Table 1. Demography, pharmacotherapy, common multimorbid diseases, physical–mental health co-morbidity and 1-year mortality by
number of diagnoses Number of diagnoses All 0–1 2–4 5–9 10+ N (%) 2 323 667 (100%) 1 822 056 (78.4%) 424 489 (18.3%) 75 305 (3.2%) 1817 (0.1%) Sex Female 1 162 569 (50.0%) 884 840 (48.6%) 238 850 (56.3%) 38 089 (50.6%) 790 (43.5%) Male 1 161 098 (50.0%) 937 216 (51.4%) 185 639 (43.7%) 37 216 (49.4%) 1027 (56.5%) Age 0–9 295 754 (12.7%) 286 529 (15.7%) 9204 (2.2%) 21 (0.03%) 0 (0%) 10–19 258 750 (11.1%) 241 006 (13.2%) 17 538 (4.1%) 206 (0.3%) 0 (0%) 20–29 320 453 (13.8%) 289 557 (15.9%) 29 946 (7.1%) 950 (1.3%) 0 (0%) 30–39 350 272 (15.1%) 312 669 (17.2%) 36 113 (8.5%) 1481 (2.0%) 9 (0.5%) 40–49 327 025 (14.1%) 2781 13 (15.3%) 46 153 (10.9%) 2742 (3.6%) 17 (0.9%) 50–59 289 043 (12.4%) 215 439 (11.8%) 66 978 (15.8%) 6560 (8.7%) 66 (3.6%) 60–69 219 562 (9.5%) 123 922 (6.8%) 82 976 (19.6%) 12 450 (16.5%) 214 (11.78) 70–79 174 220 (7.5%) 60 800 (3.3%) 89 295 (21.0%) 23 563 (31.3%) 562 (30.9%) 80–89 70 159 (3.0%) 11 903 (0.7%) 37 139 (8.8%) 20 383 (27.1%) 734 (40.4%) 90–99 17 963 (0.8%) 2042 (0.1%) 8904 (2.1%) 6803 (9.0%) 214 (11.8%) 100+ 466 (0.0%) 76 (0.0%) 243 (0.06%) 146 (0.2%) 1 (0.06%) Number of medications 0–4 1 762 514 (75.9%) 1 607 117 (88.2%) 152 043 (35.8%) 3337 (4.4%) 17 (0.9%) 5–9 365 566 (15.7%) 180 121 (9.9%) 167 089 (39.4%) 18 288 (24.3%) 68 (3.7%) 10–14 125 794 (5.4%) 27 816 (1.5%) 72 501 (17.1%) 25 200 (33.5%) 277 (15.2%) 15+ 69 793 (3.0%) 7002 (0.4%) 32 856 (7.7%) 28 480 (37.8%) 1455 (80.1%) Common multimorbid diseases
Heart failure 36 444 (1.6%) 574 (0.03%) 12 621 (3.0%) 21 905 (29.1%) 1344 (74.0%) Chronic renal disease 25 443 (1.1%) 1303 (0.07%) 10 417 (2.5%) 12 816 (17.0%) 907 (49.9%) Coronary heart disease 63 778 (2.7%) 3292 (0.2%) 32 842 (7.7%) 26 382 (35.0%) 1262 (69.5%) Atrial fibrillation 58 841 (2.5%) 3997 (0.2%) 28 064 (6.6%) 25 582 (33.0%) 1198 (65.9%) COPD 48 620 (2.1%) 5406 (0.3%) 25 644 (6.0%) 16 613 (22.1%) 957 (52.7%) Stroke/TIA 42 027 (1.8%) 2826 (0.2%) 21 260 (5.0%) 17 067 (22.7%) 874 (48.1%) Dementia 18 202 (0.8%) 1329 (0.07%) 9497 (2.2%) 7050 (9.4%) 326 (17.9%) Peripheral vascular disease 14 220 (0.6%) 1896 (0.1%) 6633 (1.6%) 5326 (7.1%) 365 (20.1%) Bronchiectasis 2411 (0.1%) 282 (0.02%) 1269 (0.3%) 801 (1.1%) 59 (3.3%) Hypertension 334 935 (14.4%) 69 061 (3.8%) 201 517 (47.5%) 62 623 (83.2%) 1734 (95.4%) Diabetes 105 534 (4.5%) 13 141 (0.7%) 63 300 (14.9%) 27 997 (37.2%) 1096 (60.3%) Cancer 98 369 (4.23%) 20 068 (1.1%) 54 844 (12.9%) 22 590 (30.0%) 867 (47.7%) Physical–mental health co-morbidity 133 942 (5.8%) 0 (0%) 102 069 (24.1%) 30 810 (40.9%) 1063 (58.5%) Anxiety disorders 131 088 (5.6%) 41 659 (2.3%) 75 458 (17.8%) 13 516 (18.8%) 455 (25.0%) Depression 72 286 (3.1%) 14 165 (0.8%) 46 662 (11.0%) 11 061 (14.7%) 398 (21.9%) Alcohol problems 60 671 (2.6%) 17 441 (1.0%) 33 347 (7.9%) 9529 (12.7%) 354 (19.5%) Substance misuse 30 591 (1.3%) 7434 (0.4%) 18 035 (4.3%) 4888 (6.5%) 234 (12.9%) 1-Year mortality 15 842 (0.7%) 2315 (0.1%) 7122 (1.7%) 6054 (8.0%) 351 (19.3%)
in age groups 30–39 and 40–59 [relative risk (RR) 4.55 and 4.23, respectively]. After 60, there were more women than men that were healthy or had only one condition (RR 1.15) and this like-lihood increased with increasing age (to RR 3.54 at age 90–99). Women were more likely than men to have polypharmacy. Men suf-fered multimorbidity due to cardiovascular disease, kidney disease and diabetes to a higher degree than women. Women had higher prevalence of multimorbidity including lung disease and dementia. Compared with men, women were more likely to have both physical and mental health conditions.
For individuals with the top 12 conditions, 6 of the top 10 drugs were medications aimed at improvement of cardiovascular health (Table 3). There was high prevalence of potentially inappropriate medications: hypnotics and sedatives were prescribed to between 19.8% (diabetes) and 33.5% (dementia); anxiolytics to between 10% (diabetes) and 27% (dementia); proton-pump inhibitors to be-tween 23.3% (hypertension) and 35.2% (heart failure). Additionally, opioids were the 14th most prescribed drug and were prescribed to between 16.5% (hypertension) and 25.6% (heart failure). Anti-depressants were claimed by between 15% (hypertension, cancer) and 41% (dementia).
In the top 12 conditions, we identified the 25 most common co-morbidities (Supplementary Table 4). Hypertension was the most common, found in 44–81%, followed by diabetes (11–32%), hearing loss (10–16%) and thyroid disorders (12–16%). Anxiety disorders and depression were associated with all 12 common con-ditions, but at low rates (5–8% and 5–7%, respectively).
Cluster analysis examining non-random associations between diseases in the 501 611 individuals with at least two conditions, resulted in seven clusters (Table 4). The largest cluster included the 27% of individuals with multimorbidity not in other clusters. This cluster was characterized by lower median age, number of co-morbidities and number of drugs compared to the other clusters. No single disease was dominant, but in this group, 40% had anx-iety, 26% depression, 17% alcohol problems and 14% had irritable bowel syndrome (IBS). The second largest cluster consisted of in-dividuals with hypertension but without diabetes, cancer, thyroid disorders or hearing loss, and with a low degree of other cardiovas-cular disease, followed by a cluster of individuals with hypertension and diabetes. The fourth cluster consisted of individuals with cancer and hypertension. In the fifth cluster, thyroid disorders, 18% had anxiety, 10% had depression, 38% had hypertension and 9% had IBS. In the sixth cluster, hearing loss, there was a broad spectrum of conditions with hypertension and anxiety disorders most common. The smallest cluster, 7% of individuals, was characterized by hyper-tension in combination with one or several other cardiovascular
diseases and to some extent diabetes. This cluster had a higher me-dian age, number of co-morbidities and number of drugs, and higher 1-year mortality rate compared with the other clusters.
Discussion
Summary of the findings
In this total population study, the proportion of individuals with multimorbidity and polypharmacy increased with age until age 90, after which multimorbidity and polypharmacy decreased drastically. Multimorbid individuals had a low absolute 1-year risk of mor-tality but represented most deaths in the total population. Increased number of conditions was associated with increased risk for con-comitant physical–mental disease. The top 12 conditions associated with multimorbidity were heart failure, chronic kidney disease, cor-onary heart disease, atrial fibrillation, COPD, stroke/TIA, dementia, peripheral vascular disease, hypertension, diabetes and cancer, all as-sociated with high prevalence of multiple co-morbid conditions and high prevalence of prescribed medication, including potentially in-appropriate medications. Women were more likely than men to have multimorbidity before age 60, less likely to have multimorbidity after age 80 and more likely than men to have lung disease, de-mentia and co-morbid physical and mental conditions. We identified seven clinically distinct non-randomly clustered conditions: a mental health cluster; a thyroid disease cluster; a cancer cluster; a hearing loss cluster; and a hypertension cluster, a hypertension-metabolic cluster and a cardiovascular cluster.
Relationship with previous research
Our study population resembles other cohorts. In a cross-sectional study of individuals registered at medical practices in Scotland, 23.2% had multimorbidity (2). As in the current study, prevalence increased with increasing age and prevalence of mental health dis-orders increased as the number of physical co-morbidities increased (2). In a retrospective cohort study of a random sample of primary care attenders in England, 16% of individuals had multimorbidity (22). Prevalence of multimorbidity in a population-based study in Ontario, Canada was 24.3% and patterns of concurrent disease were complex, similar to our study (3). No previous study has re-ported both the patterns of multimorbidity and polypharmacy on a population level.
The top 12 conditions identified in our study population overlap with clinically relevant conditions collated in a systematic review (23), but also include chronic kidney disease, dementia and periph-eral vascular disease, while depression and arthritis do not make our
Figure 1. Proportion of the population in 2017 (N = 2 323 667) with (A) number of diagnoses per age group and (B) numbers of claimed prescription drugs per
age group.
top 12. Our list overlaps with the common conditions identified in multimorbid populations by several other large population-based studies (3,22,24).
Three general patterns of non-random associations between con-ditions have been identified by systematic review: cardiovascular and metabolic diseases, mental health problems and musculoskeletal
Table 2. Relative risk proportion of women compared to men for demography, pharmacotherapy, common multimorbid diseases,
physical–mental health co-morbidity and 1-year mortality by number of diagnoses
All 0–1 2–4 5–9 10+
Relative risk proportion of women versus men N/A 0.94 (0.94-0.94) 1.29 (1.28–1.29) 1.02 (1.01–1.04) 0.77 (0.70–0.84) Age 0–9 0.94 (0.93–0.94) 1.00 (1.00–1.01) 0.62 (0.60–0.65) 1.59 (0.66–3.83) N/A 10–19 0.93 (0.93–0.94) 0.96 (0.95–0.97) 1.11 (1.08–1.14) 3.31 (2.39–4.58) N/A 20–29 0.99 (0.98–1.00) 0.99 (0.98–0.99) 1.35 (1.32–1.38) 3.36 (2.89–3.91) N/A 30–39 0.96 (0.95–0.96) 0.94 (0.94–0.95) 1.39 (1.36–1.42) 2.64 (2.36–2.96) 4.55 (0.95–21.8) 40–49 0.97 (0.96–0.97) 0.94 (0.94–0.95) 1.21 (1.19–1.23) 1.95 (1.80–2.11) 4.23 (1.38–12.9) 50–59 0.98 (0.97–0.99) 0.98 (0.97–0.99) 0.89 (0.88–0.91) 1.19 (1.13–1.24) 1.30 (0.81–2.09) 60–69 1.03 (1.02–1.04) 1.15 (1.14–1.16) 0.77 (0.77–0.78) 0.79 (0.77–0.82) 0.96 (0.75–1.24) 70–79 1.13 (1.12–1.14) 1.46 (1.44–1.49) 0.86 (0.85–0.87) 0.72 (0.71–0.74) 0.87 (0.76–1.01) 80–89 1.48 (1.46–1.50) 2.15 (2.07–2.23) 1.27 (1.25–1.30) 1.05 (1.03–1.08) 0.96 (0.85–1.07) 90–99 2.46 (2.38–2.54) 3.54 (3.20–3.93) 2.34 (2.23–2.45) 1.80 (1.72–1.89) 1.32 (1.03–1.70) 100+ 5.95 (4.59–7.70) 6.99 (3.59–13.6) 5.52 (3.77–8.09) 4.31 (2.84–6.54) N/A Number of medications 0–4 0.88 (0.87–0.88) 0.92 (0.92-0.92) 0.78 (0.78–0.79) 0.67 (0.63–0.72) 0.54 (0.19–1.53) 5–9 1.43 (1.42–1.44) 1.84 (1.82–1.85) 0.98 (0.97–0.99) 0.71 (0.69–0.72) 0.28 (0.15–0.52) 10–14 1.64 (1.62–1.66) 2.66 (2.60–2.73) 1.34 (1.32–1.36) 0.93 (0.91–0.95) 0.58 (0.45–0.73) 15+ 1.93 (1.90–1.96) 3.05 (2.89–3.21) 1.92 (1.87–1.96) 1.40 (1.37–1.42) 1.17 (1.12–1.22) Common multimorbid diseases
Heart failure 0.87 (0.85–0.89) 0.80 (0.68–0.94) 0.69 (0.67–0.72) 0.85 (0.83–0.87) 0.98 (0.93–1.04) Chronic renal disease 0.70 (0.68–0.72) 0.69 (0.62–0.78) 0.57 (0.55–0.60) 0.68 (0.65–0.70) 0.72 (0.65–0.79) Coronary heart disease 0.63 (0.62–0.64) 0.43 (0.40–0.46) 0.47 (0.46–0.48) 0.68 (0.67–0.70) 0.93 (0.87–0.99) Atrial fibrillation 0.73 (0.72–0.74) 0.42 (0.39–0.45) 0.58 (0.56–0.59) 0.77 (0.75–0.78) 0.84 (0.78–0.90) COPD 1.34 (1.31–1.36) 1.30 (1.23–1.37) 1.18 (1.15–1.21) 1.14 (1.11–1.17) 1.13 (1.03–1.23) Stroke/TIA 0.91 (0.89–0.92) 0.99 (0.92–1.06) 0.74 (0.72–0.76) 0.84 (0.82–0.86) 0.94 (0.85–1.04) Dementia 1.72 (1.67–1.77) 2.65 (2.35–2.98) 1.66 (1.59–1.73) 1.24 (1.19–1.30) 1.11 (0.91–1.35) Peripheral vascular disease 1.33 (1.28–1.37) 2.39 (2.16–2.63) 1.26 (1.20–1.32) 0.89 (0.85–0.94) 0.96 (0.80–1.16) Bronchiectasis 2.16 (1.98–2.36) 2.34 (1.82–3.00) 1.87 (1.66–2.11) 1.85 (1.60–2.14) 1.77 (1.06–2.94) Hypertension 1.07 (1.06–1.07) 1.18 (1.16–1.20) 0.85 (0.84–0.86) 0.93 (0.92–0.93) 0.98 (0.96–1.00) Diabetes 0.75 (0.74–0.76) 0.59 (0.57–0.61) 0.60 (0.60–0.61) 0.77 (0.75–0.78) 0.91 (0.84–0.98) Cancer 1.00 (0.99–1.02) 1.29 (1.26–1.33) 0.82 (0.81–0.84) 0.74 (0.72–0.75) 0.75 (0.68–0.83) Physical–mental health co-morbidity 1.56 (1.54–1.57) N/A 1.28 (1.26–1.29) 1.31 (1.29–1.33) 1.16 (1.07–1.25) 1-Year mortality 1.07 (1.03–1.10) 0.97 (0.89–1.05) 0.97 (0.92–1.01) 0.95 (0.91–1.00) 0.90 (0.75–1.10)
Table 3. The 12 most common conditions with prevalence of the top 25 claimed medication groups (N = 469 778)
Heart failure Chronic renal disease Coronary heart disease Atrial
fibrillation COPD Stroke/TIA Dementia Peripheral
vascular
disease Bronchiectasis Hypertension Diabetes Cancer N (%) 36444 (1.6%) 25443 (1.1%) 63778 (2.7%) 58841 (2.5%) 48620 (2.1%) 42027 (1.8%) 18202 (0.8%) 14220 (0.6%) 2411 (0.1%) 334935 (14.4%) 105534 (4.5%) 98369 (4.2%)
Number of drugs (median) 12 11 10 9 10 9 9 8 9 7 8 7
B01A ANTITHROMBOTIC AGENTS 80% 54% 83% 83% 38% 75% 51% 56% 26% 36% 39% 33%
C07A BETA BLOCKING AGENTS 77% 53% 70% 74% 33% 42% 34% 36% 23% 39% 37% 27%
C10A LIPID MODIFYING AGENTS, PLAIN 47% 44% 69% 38% 30% 55% 27% 46% 19% 37% 53% 25%
N02B ANALGESICS AND ANTIPYRETICS 46% 41% 39% 38% 38% 39% 47% 35% 35% 30% 32% 31%
C08C CALCIUM CHANNEL BLOCKERS 25% 39% 29% 24% 22% 30% 21% 30% 15% 37% 30% 20%
C09A ACE INHIBITORS, PLAIN 42% 29% 33% 27% 18% 26% 20% 22% 10% 29% 27% 15%
A02B DRUGS FOR PEPTIC ULCER, REFLUX 35% 34% 35% 27% 30% 29% 26% 28% 31% 23% 25% 24% C09C ANGIOTENSIN II RECEPTOR BLOCKERS 29% 30% 24% 23% 18% 20% 13% 18% 16% 28% 21% 15%
N05C HYPNOTICS AND SEDATIVES 32% 28% 26% 27% 29% 29% 34% 26% 25% 21% 20% 23%
J01C PENICILLINS 26% 25% 21% 23% 27% 20% 15% 23% 38% 19% 20% 22%
M01A NSAIDS 9% 9% 14% 8% 18% 11% 6% 15% 18% 17% 17% 16%
A06A DRUGS FOR CONSTIPATION 29% 26% 23% 24% 22% 27% 41% 21% 23% 17% 17% 23%
B03B VITAMIN B12 AND FOLIC ACID 30% 30% 24% 24% 21% 26% 44% 22% 18% 18% 22% 17%
N02A OPIOIDS 26% 23% 21% 21% 23% 21% 23% 22% 19% 16% 17% 19%
N06A ANTIDEPRESSANTS 20% 18% 17% 16% 21% 25% 41% 17% 17% 15% 16% 15%
D02A EMOLLIENTS AND PROTECTIVES 25% 23% 18% 20% 18% 20% 34% 18% 19% 14% 17% 15%
A10B BLOOD GLUCOSE LOWERING DRUGS, EXCL. INSULINS 14% 12% 17% 11% 10% 11% 8% 11% 5% 14% 56% 7%
R03A ADRENERGICS, INHALANTS 20% 14% 15% 14% 53% 12% 9% 15% 48% 13% 12% 11%
D07A CORTICOSTEROIDS, PLAIN 14% 14% 13% 14% 15% 13% 12% 14% 14% 12% 13% 13%
R06A ANTIHISTAMINES FOR SYSTEMIC USE 10% 11% 10% 9% 16% 11% 8% 11% 17% 11% 11% 11%
H03A THYROID PREPARATIONS 13% 13% 11% 11% 12% 11% 15% 11% 12% 11% 12% 11%
N05B ANXIOLYTICS 16% 13% 13% 13% 17% 15% 27% 12% 13% 11% 10% 11%
R05C EXPECTORANTS EXCL. COMBINATIONS 17% 13% 13% 13% 28% 12% 10% 13% 38% 10% 10% 11% H02A CORTICOSTEROIDS FOR SYSTEMIC USE 15% 19% 11% 12% 20% 10% 6% 11% 24% 9% 9% 13%
A12A CALCIUM 15% 15% 11% 12% 14% 12% 15% 12% 19% 10% 9% 11%
disorders (25). In our study, the mental health cluster and the thy-roid disease cluster are both younger than the other clusters and have a very low 1-year mortality rate. We identified three cardiovascular/ metabolic disease clusters that seemed to represent different phases and/or possibly different health trajectories. Individuals in the hyper-tension cluster had a low level of associated cardiovascular conditions, no diabetes, and few drugs while individuals in the hypertension-metabolic cluster had diabetes, more co-morbidities and more medi-cation. Individuals in the cardiovascular cluster were older, had many concurrent conditions and drugs, and had a high one-year mortality rate. Hypertension was highly prevalent in the multimorbid popula-tion, not specific to any one cluster. Hypertension may be best under-stood as a disease marker or a predictive factor for multimorbidity, and it would be interesting to further evaluate differences between individuals in the hypertension cluster compared to other clusters.
A cohort study of a population aged 77 years or older in Region Stockholm identified similar clusters: two clusters of cardiovascular conditions, one mental illness and musculoskeletal cluster, a dia-betes mellitus and malignancy cluster, and a visual impairment and anaemia cluster (16). The clusters in the current study included all age groups, explaining some of the differences between studies. The mental health and thyroid clusters as well as the three cardiovascular/ metabolic clusters may represent causal associative multimorbidity, or common pathophysiological pathways within these clusters (26).
Our study aligns with other cross-sectional analyses showing an increase in prescribing with increased age, for example in Scotland (27), Italy (28) and Sweden (27). However, this is the first study of its size to identify the frequencies of claimed prescription for the most common multimorbid conditions. A recent Swedish study of polypharmacy in the elderly found similar trends for potentially
Table 4. Clusters of co-morbidities in 501 611 individuals in the Stockholm Region in 2017 Clusters of multimobidity n=501611 Proportion 27% 19% 13% 12% 12% 11% 7% Age (median) 40 68 67 72 59 63 79 No. of morbidities (median) 2 2 3 3 3 3 6
No. of drugs (median) 5 7 9 8 7 6 12
One-year mortality 1% 2% 2% 5% 1% 2% 12%
Hypertension 0% 100% 86% 70% 38% 35% 85%
Heart failure 1% 2% 2% 3% 1% 2% 82%
Atrial fibrillation 3% 10% 7% 10% 4% 6% 74%
Coronary heart disease 3% 14% 14% 11% 5% 7% 64%
Diabetes 2% 0% 100% 17% 6% 4% 30%
Gout/rheumatoid arthritis 9% 15% 12% 12% 10% 9% 24%
Cancer 2% 0% 0% 100% 7% 7% 22%
Stroke/TIA 3% 11% 9% 9% 4% 6% 22%
Chronic renal disease 1% 6% 6% 6% 2% 2% 21%
COPD 6% 11% 8% 9% 6% 7% 19% Prostate disorders 7% 13% 10% 18% 3% 9% 17% Hearing loss 0% 0% 8% 10% 0% 100% 16% Thyroid disorders 0% 0% 11% 9% 100% 15% 15% Glaucoma 6% 14% 11% 14% 9% 10% 13% Dementia 2% 4% 3% 4% 3% 3% 9%
Periph. vascular disease 2% 3% 3% 3% 2% 2% 6%
Psoriasis or eczema 15% 7% 5% 7% 7% 8% 5% Alcohol problems 17% 8% 6% 4% 4% 4% 5% Painful condition 8% 6% 5% 5% 6% 5% 5% Asthma 13% 6% 4% 4% 6% 7% 5% Blindness 3% 3% 3% 3% 2% 4% 5% Anxiety disorders 40% 11% 5% 4% 18% 13% 5% Depression 26% 7% 5% 4% 10% 7% 4% Constipation 5% 2% 2% 3% 2% 4% 4% Diverticular disease 9% 3% 3% 4% 4% 5% 4%
Irritable bowel syndrome 14% 5% 3% 4% 9% 7% 3%
Chronic liver disease 2% 2% 3% 3% 2% 1% 2%
Dyspepsia 5% 2% 2% 2% 3% 3% 2%
Inflam. bowel disease 5% 2% 2% 2% 2% 2% 1%
Substance misuse 12% 2% 2% 1% 2% 2% 1% Epilepsy 2% 1% 1% 1% 1% 1% 1% Chronic sinusitis 3% 2% 1% 2% 2% 2% 1% Viral hepatitis 3% 1% 1% 1% 1% 1% 1% Schizophrenia 4% 1% 2% 1% 3% 1% 1% Bronchiectasis 0% 0% 0% 1% 0% 0% 1% Migraine 4% 1% 1% 1% 2% 2% 0% Multiple sclerosis 1% 1% 0% 0% 1% 0% 0% Anorexia or bulimia 5% 0% 0% 0% 2% 1% 0% Learning disability 5% 0% 0% 0% 1% 3% 0% Hypertension Cardiovascular disease Anxiety Depression
Alcohol problems Hypertension
Diabetes
Hypertension Cancer Thyroid disorders Hearing loss
inappropriate prescribing, including high frequencies of anxiolytics and hypnotics (29). Our study may indicate deficiencies in appro-priate prescribing for atrial fibrillation (30) and heart failure (31), similar to a recent Irish study (32).
Strengths and weaknesses
This study used the total population of Stockholm County, >2 mil-lion individuals and is one of the largest population-based studies of multimorbidity to date. This is a complete data set comprising all health care visits, diagnoses and claimed prescription medications for this population. This data set is representative for Sweden but may have limited generalizability in other settings.
Registry data relies on reporting and therefore risks misclassi-fication of diagnoses. Previous studies have shown much higher prevalence of anxiety (33) and depression (34) than in the VAL data-base, and have identified underreporting of these diagnoses (35). In our data, individuals with multimorbidity more often had a pre-scription for anti-depressants than a diagnosis of mental disorder, indicating underdiagnosing in this group. Mental disorders are often underdiagnosed in the elderly population. Our ‘mental health’ cluster is younger than the other clusters. Using medication data in our clustering model as proxy for mental health diagnoses might yield different clusters. Our data likely reflects underdiagnosing of chronic kidney disease. A study of the total population of Stockholm, reported only 12 % of individuals with a glomerular filtration rate below 60 ml/min/1.73 m2 ICD-coded for chronic kidney disease (36).
Accurate prevalence figures could result in these conditions being much higher. In the VAL database, inpatient and outpatient data are reported to the Swedish National Inpatient Register, which has been validated (37). However, data from primary care have not been val-idated. An individual’s age and sex are identifiable from the national identification number, and registered visits are directly relayed to VAL, so these variables are unlikely to be misclassified. Residual con-founding by variables not recorded in VAL could not be evaluated. Data includes only claimed prescription drugs, not written prescrip-tions, adherence to treatment, nor over the counter drugs.
Implications for practice
Patient-centred primary care should take account of patient complexity and multimorbidity (38). The Ariadne principles of multimorbidity management in primary care advise patients and providers to set realistic treatment goals based on assessment of interactions between conditions and treatment, patient priorities, and individualized plans and follow-up (39). This requires the phys-ician to identify serious or debilitating dominant conditions for pri-oritization and to distinguish between concordant conditions (with shared pathophysiology profile and similar management strategies), and discordant conditions (that may require separate or competing management strategies) (40). In this study, the identified clusters in-clude concordant conditions, but also discordance, potentially com-plicating individual management (25). For example, while clustering of cancer and hypertension cluster may not change cancer manage-ment per se, it points out that even managemanage-ment of cancer patients needs to take account of multimorbidity. Better understanding of disease clustering and development of clinical management guide-lines for common clusters could help clinicians with the difficulties of managing the complexity of multimorbidity.
Future research should explore understanding why many patients with multimorbidity are prescribed potentially inappropriate drugs such as sedatives, opioids and anxiolytics, and if there are potential omissions in prescribing. Finally, the findings from this study should
inform development and testing of interventions for improving the health care of the steadily growing multimorbid population.
Conclusions
Individuals with chronic conditions often show clinical complexity with both concordant and discordant conditions and polypharmacy. This study indicates that clinical guidelines addressing clustering of conditions may be one strategy for managing complexity.
Supplementary material
Supplementary data are available at Family Practice online.
Declaration
Funding: This project was supported by the Karolinska Institute and the Stockholm Region. Funders of this study had no role in study design, data collection, analysis or write-up.
Ethical approval: This study was approved by the Regional Ethics Committee in Stockholm (2017/1690-32).
Conflict of interest: none.
References
1. Uijen AA, van de Lisdonk EH. Multimorbidity in primary care: preva-lence and trend over the last 20 years. Eur J Gen Pract 2008; 14 (suppl 1): 28–32.
2. Barnett K, Mercer SW, Norbury M, Watt G, Wyke S, Guthrie B. Epidemi-ology of multimorbidity and implications for health care, research, and medical education: a cross-sectional study. Lancet 2012; 380: 37–43. 3. Pefoyo AJ, Bronskill SE, Gruneir A et al. The increasing burden and
com-plexity of multimorbidity. BMC Public Health 2015; 15: 415.
4. Violan C, Foguet-Boreu Q, Flores-Mateo G et al. Prevalence, determinants and patterns of multimorbidity in primary care: a systematic review of observational studies. PLoS One 2014; 9: e102149.
5. Perkins AJ, Kroenke K, Unützer J et al. Common comorbidity scales were similar in their ability to predict health care costs and mortality. J Clin
Epidemiol 2004; 57: 1040–8.
6. McPhail SM. Multimorbidity in chronic disease: impact on health care resources and costs. Risk Manag Healthc Policy 2016; 9: 143–56. 7. Thavorn K, Maxwell CJ, Gruneir A et al. Effect of socio-demographic
factors on the association between multimorbidity and healthcare costs: a population-based, retrospective cohort study. BMJ Open 2017; 7: e017264.
8. Violán C, Foguet-Boreu Q, Roso-Llorach A et al. Burden of multimorbidity, socioeconomic status and use of health services across stages of life in urban areas: a cross-sectional study. BMC Public Health 2014; 14: 530. 9. Wimmer BC, Cross AJ, Jokanovic N et al. Clinical outcomes associated
with medication regimen complexity in older people: a systematic review.
J Am Geriatr Soc 2017; 65: 747–53.
10. Morin L, Vetrano DL, Rizzuto D, Calderón-Larrañaga A, Fastbom J, Johnell K. Choosing Wisely? Measuring the burden of medications in older adults near the end of life: nationwide, longitudinal cohort study.
Am J Med 2017; 130: 927–36.e9.
11. Tinetti ME, Fried TR, Boyd CM. Designing health care for the most common chronic condition–multimorbidity. JAMA 2012; 307: 2493–4. 12. Wyatt KD, Stuart LM, Brito JP et al. Out of context: clinical practice
guidelines and patients with multiple chronic conditions: a systematic re-view. Med Care 2014; 52(Suppl 3): S92–S100.
13. National Guideline Centre. National Institute for Health and Care
Ex-cellence: Clinical Guidelines. Multimorbidity: Assessment, Prioritisa-tion and Management of Care for People with Commonly Occurring Multimorbidity. London, UK: National Institute for Health and Care
Ex-cellence (UK) Copyright (c) National Institute for Health and Care Excel-lence; 2016.
14. Navickas R, Petric VK, Feigl AB, Seychell M. Multimorbidity: what do we know? What should we do? J Comorb 2016; 6: 4–11.
15. Effektiv vård GS. Slutbetänkande av En nationell samordnare för
effektivare resursutnyttjande inom hälso och sjukvården (Effective Healthcare: Conclusions from the National Coordinator for More Ef-fective Use of Resources in Healthcare). In: SOU (ed). Stockholm, Sweden:
Wolters Kluwer Sverige AB, 2016.
16. Marengoni A, Roso-Llorach A, Vetrano DL et al. Patterns of multimorbidity in a population-based cohort of older people: sociodemographic, lifestyle, clinical, and functional differences. J Gerontol A Biol Sci Med Sci 2020;
75: 798–805.
17. Calderón-Larrañaga A, Santoni G, Wang HX et al. Rapidly developing multimorbidity and disability in older adults: does social background matter? J Intern Med 2018; 283: 489–99.
18. Vetrano DL, Rizzuto D, Calderón-Larrañaga A et al. Trajectories of func-tional decline in older adults with neuropsychiatric and cardiovascular multimorbidity: a Swedish cohort study. PLoS Med 2018; 15: e1002503. 19. Carlsson AC, Wändell P, Ösby U, Zarrinkoub R, Wettermark B,
Ljunggren G. High prevalence of diagnosis of diabetes, depression, anx-iety, hypertension, asthma and COPD in the total population of Stock-holm, Sweden – a challenge for public health. BMC Public Health 2013;
13: 670.
20. Cadogan CA, Ryan C, Hughes CM. Appropriate polypharmacy and medi-cine safety: when many is not too many. Drug Saf 2016; 39: 109–16. 21. Guthrie B, Makubate B, Hernandez-Santiago V, Dreischulte T. The rising
tide of polypharmacy and drug-drug interactions: population database analysis 1995–2010. BMC Med 2015; 13: 74.
22. Salisbury C, Johnson L, Purdy S, Valderas JM, Montgomery AA. Epidemi-ology and impact of multimorbidity in primary care: a retrospective co-hort study. Br J Gen Pract 2011; 61: e12–21.
23. Diederichs C, Berger K, Bartels DB. The measurement of multiple chronic diseases–a systematic review on existing multimorbidity indices. J
Gerontol A Biol Sci Med Sci 2011; 66: 301–11.
24. Nunes BP, Flores TR, Mielke GI, Thumé E, Facchini LA. Multimorbidity and mortality in older adults: a systematic review and meta-analysis. Arch
Gerontol Geriatr 2016; 67: 130–8.
25. Prados-Torres A, Calderón-Larrañaga A, Hancco-Saavedra J, Poblador-Plou B, van den Akker M. Multimorbidity patterns: a systematic review. J
Clin Epidemiol 2014; 67: 254–66.
26. van den Akker M, Buntinx F, Roos S, Knottnerus JA. Problems in determining occurrence rates of multimorbidity. J Clin Epidemiol 2001;
54: 675–9.
27. Hovstadius B, Hovstadius K, Astrand B, Petersson G. Increasing polypharmacy – an individual-based study of the Swedish population 2005-2008. BMC Clin Pharmacol 2010; 10: 16.
28. Franchi C, Tettamanti M, Pasina L et al. Changes in drug prescribing to Italian community-dwelling elderly people: the EPIFARM-Elderly Project 2000-2010. Eur J Clin Pharmacol 2014; 70: 437–43.
29. Hovstadius B, Petersson G, Hellström L, Ericson L. Trends in inappro-priate drug therapy prescription in the elderly in Sweden from 2006 to 2013: assessment using national indicators. Drugs Aging 2014; 31: 379– 86.
30. Friberg L, Rosenqvist M, Lip GY. Net clinical benefit of warfarin in pa-tients with atrial fibrillation: a report from the Swedish atrial fibrillation cohort study. Circulation 2012; 125: 2298–307.
31. McMurray JJ, Adamopoulos S, Anker SD et al.; Task Force for the Diag-nosis and Treatment of Acute and Chronic Heart Failure 2012 of the European Society of Cardiology; ESC Committee for Practice Guidelines. ESC guidelines for the diagnosis and treatment of acute and chronic heart failure 2012: the task force for the diagnosis and treatment of acute and chronic heart failure 2012 of the European Society of Cardiology. Devel-oped in collaboration with the Heart Failure Association (HFA) of the ESC. Eur J Heart Fail 2012; 14: 803–69.
32. Galvin R, Moriarty F, Cousins G et al. Prevalence of potentially inappro-priate prescribing and prescribing omissions in older Irish adults: findings from the Irish LongituDinal Study on Ageing study (TILDA). Eur J Clin
Pharmacol 2014; 70: 599–606.
33. Lotfi L, Flyckt L, Krakau I, Mårtensson B, Nilsson GH. Undetected de-pression in primary healthcare: occurrence, severity and co-morbidity in a two-stage procedure of opportunistic screening. Nord J Psychiatry 2010;
64: 421–7.
34. Puyat JH, Marhin WW, Etches D et al. Estimating the prevalence of de-pression from EMRs. Can Fam Physician 2013; 59: 445.
35. Cepoiu M, McCusker J, Cole MG, Sewitch M, Belzile E, Ciampi A. Recog-nition of depression by non-psychiatric physicians–a systematic literature review and meta-analysis. J Gen Intern Med 2008; 23: 25–36.
36. Gasparini A, Evans M, Coresh J et al. Prevalence and recognition of chronic kidney disease in Stockholm healthcare. Nephrol Dial Transplant 2016; 31: 2086–94.
37. Ludvigsson JF, Andersson E, Ekbom A et al. External review and valid-ation of the Swedish nvalid-ational inpatient register. BMC Public Health 2011;
11: 450.
38. Guthrie B, Payne K, Alderson P, McMurdo ME, Mercer SW. Adapting clinical guidelines to take account of multimorbidity. BMJ 2012; 345: e6341.
39. Muth C, van den Akker M, Blom JW et al. The Ariadne principles: how to handle multimorbidity in primary care consultations. BMC Med 2014; 12: 223.
40. Piette JD, Kerr EA. The impact of comorbid chronic conditions on diabetes care. Diabetes Care 2006; 29: 725–31.