SPECIFIC FEATURES OF METHODS FOR
EXPRESS CONTROL OF LIQUID AND VISCOUS
MEDIA IN ENVIRONMENTAL MONITORING
V.V. Davydov
1E.N. Velichko
1V.V. Davydova
2Saint-Petersburg State Politechnical University
1, Russia
Saint-Petersburg State University of Trade and Economics
2, Russia
ABSTRACT
Technological advances lead to emergence of factors and enhancement of factors that have a negative impact on the environment. Solid media are more stable and therefore the strongest influence is experienced by air and aquatic environments.
In this situation the role of express control of liquid and viscous media becomes extremely important. Devices for analysis of such media (spectrometers etc.) are expensive and require laboratory conditions. So it is more reasonable to analyze liquid and viscous media in which a deviation from the normal condition has been revealed. This is the main task of express - control in on-site testing of media.
The requirements to the express control methods are reliability and accessibility, they must not affect the condition of the medium tested. At present three methods are used:
1. Chemical, i.e., indicator testers. The drawback of this method is that each tester is used to control one-two impact factors. In addition, each medium requires its own tester that has a limited application period.
2. Optical, i.e., exposure of a medium to UV, visible, and IR radiation. The medium must be relatively transparent. The drawback is a limited number of media that can be tested by this method.
3. The method based on the nuclear magnetic resonance (NMR). By measuring relaxation constants Т1 and Т2 of a liquid or viscous medium, it is possible to find very quickly the deviation of its aggregate state from the “normal” one. The only condition for application of the NMR method is the presence of protons or nuclei having magnetic moments in the medium (fluorine, lithium, and sodium). The NMR method is almost universal because more than 90 % of liquid and viscous media contain protons. The disadvantage is a large weight and a high cost of the magnetic system for detection of NMR signals.
At present a considerable research effort is directed towards modification of the devices for the optical and NMR methods.
The authors have developed a small-size NMR spectrometer for express control of liquid and viscous media that can be connected to a laptop to process results of measurements. Our studies have shown a high efficiency of the NMR method for express control of liquid and viscous media as compared with the chemical and optical methods. A further modification of small-size NMR spectrometers can reduce their cost and make the method marketable.
KEYWORDS: environmental monitoring, express control, liquid and viscous media,
nuclear magnetic resonance.
1. INTRODUCTION
Environmental load of different technological processes increases every year [1,2]. Industrial development and agriculture intensification (the use of new chemical fertilizers and herbicides to control pests) gives rise to new factors that have a negative impact on the environment [3, 4]. The air and water environments experience the most versatile effects [1-5]. The water environment is vital for almost all life processes [5], beginning from the direct consumption of water (drinking water), etc. In this situation monitoring of the water condition not only in artificial tanks and reservoirs but also in lakes, rivers, small ponds and streams acquires a constantly growing role. It is important to monitor the water condition and coastal areas because at any time, for example during floods, water can easily propagate at considerable distances and bring with it dangerous substances, which can lead to unpredictable consequences [1-5].
The water condition and coastal areas of seas should be monitored because many rivers run into seas and during high tides dangerous substances from sea water and coastal area can penetrate into the river water. This can lead to the death of river inhabitants and pollution of the river and river bed.
Early identification of pollution bubbles will allow one to carry out measures to clean up the coast and water. This can prevent an environmental disaster.
Space-based surveillance, aerial surveys, and water patrol sampling are used for monitoring [1]. However, there are many area covered by vegetation (bushes etc) in the coastal areas of seas, lakes and rivers, which are far from roads and can be reached only on foot. A similar situation is met in the lowlands with water and swamps near highways, from which small streams which often contain hazardous substances flow. Air monitoring is not efficient under these conditions. The most reliable control is manual sampling but the possibility to get a large number of samples is limited. In addition, the equipment for analysis of the samples (x-ray and optical spectrometers) is expensive and is mainly situated in stationary laboratories. So, a detailed study of a sample is expensive and takes from 15 to 20 minutes. For this reason, it is reasonable to use this equipment for analyzing only the samples in which a deviation from the "normal" state has been revealed.
To save time and money (not to study normal liquid and viscous media) and, which is most important, to take measures to prevent the effects of pollution in time, an efficient rapid on-site control of the samples is required. Thus, an inexpensive, easy-to-use, portable, and versatile (which can be used for a large number of liquids) measuring device is needed. We suggest one of devices that can be used for the efficient express-control of liquid and viscous media, i.e., a portable nuclear magnetic (NMR) spectrometer [1-3].
2. PORTABLE
NUCLEAR-MAGNETIC
RELAXOMETER
AND
MEASURING METHODS
Basic parameters of any liquid or viscous medium (e.g., river mud) by which a change in its aggregative state (a temperature increase, a presence of other substances, whether dissolved or not) can be instantly established are longitudinal T1 and transverse T2 relaxation times [1, 5-7]. Nuclear magnetic spectrometers allow one to perform non-contact measurements of the relaxation times of the liquid medium, both in the stationary and flowing state [1 - 5]. The only condition for their application is the presence of a sufficient number of nuclei with magnetic moments in the medium under study. They can be most efficiently used for liquid and viscous fluids containing nuclei of hydrogen, fluorine, lithium, iron, chlorine, phosphorus, etc. Almost all
nuclei or water with large magnetic moments [6, 7].
One can get information on the condition of a liquid medium by measuring the temperature of the liquid or viscous medium and comparing the measured relaxation times T1 and T2 with the basic ones [1-5].
It is necessary to measure two relaxation constants because there are many mixtures of water, alcohol-containing and fermented milk products with various hazardous substances, in which T2 is the same as in the original medium in a certain temperature range. Simultaneous measurements of T1 and T2 excludes an error in determining the condition of the medium studied.
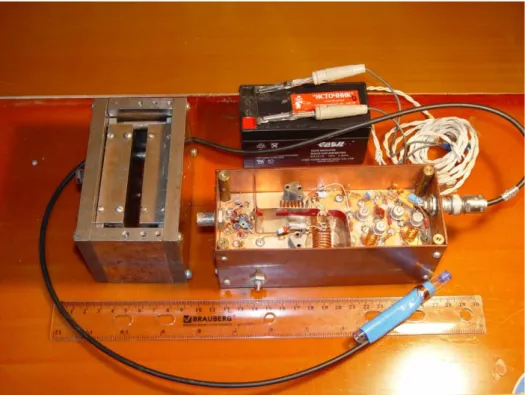
Figure 1 shows the laboratory model of a compact NMR spectrometer. To detect NMR signals, a small-size magnetic system on the basis of two available flat (rectangular) samarium-cobalt magnets with platinum impurities was designed and manufactured. To adjust the relative position of the magnetic system poles, a compact "neutral" with adjusting screws was developed. This design allows one to achieve the required degree of the magnetic induction inhomogeneity in the gap with smaller sizes of poles, which leads to a reduction of the mass of the magnetic structure together with modulation coils to 2.417 kg. The distance between the magnet poles is 12 mm, the magnetic field induction is В0 = 62 mT, the heterogeneity is 0.510-3 cm-1, the NMR signal detection frequency is fNMR = 2614 kHz.
Figure 1. Laboratory model of compact NMR spectrometer
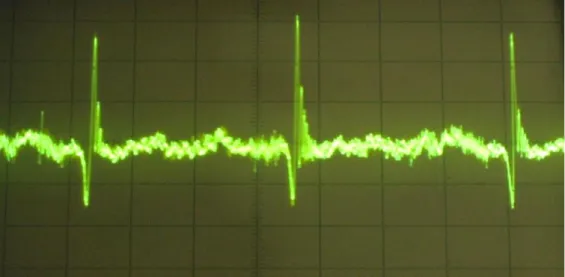
The NMR signals was detected in such a weak magnetic field В0 by a recently developed generator of weak vibrations placed into a shielded enclosure. This allowed us to detect the NMR signal in the magnetic field of the magnetic system described above from liquids 1.0–1.5 ml in volume. Figure 2 shows the NMR signal detected from water.
Figure 2. NMR signal detected from water
The line shape of the NMR signal is “approximated” by
Uc (t) = U0 exp (- t/T2*) cos ( at2/2) a = dt dHz = d( dt )
where a is the rate of change of the magnetic field offset, Т2* is the effective time of transverse
relaxation, and U0 is the maximum amplitude of the detected MNR signal.
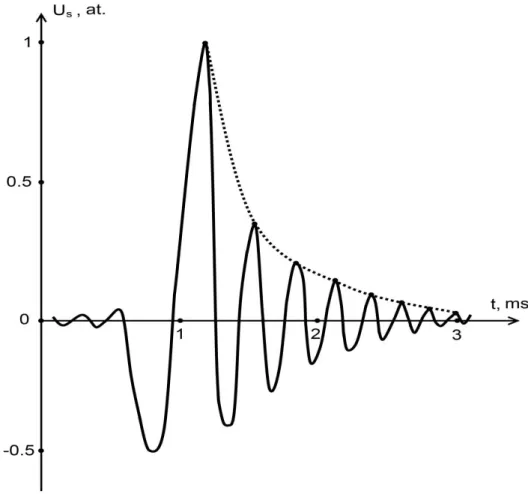
The effective time of transverse relaxation Т2* is calculated from the decay of the NMR signal
Figure 3. Approximation of the MNR signal envelope for determination of Т2*
The transverse relaxation time Т2 of a liquid medium is given by * 1 2 Т 2 1 Т Н
where H is the magnetic field inhomogeneity in the zone where the coil for the MNR signal detection is placed.
To measure the longitudinal relaxation time Т1 by the NMR spectrometer, the authors developed a novel method for determination of the longitudinal relaxation constant. In the case of a periodical modulation symmetric with respect to the field of the magnet В0 = fNMR*/, the NMR
signal amplitude is the highest only if the time between two successive passages through the resonance is long as compared with Т1. If this condition is not fulfilled, the thermal equilibrium has no enough time to be restored, and the detected NMR signals decrease as
М = М0 ) exp( 1 ) exp( 1 1 1 T T
The value of M in this expression is proportional to the NMR signal amplitude, and М0 is the initial magnetization of the liquid medium (it is the same for any frequency because the field of the magnet is constant).
By measuring the NMR signal amplitudes at two different modulation frequencies (for two different ) and dividing one ratio by the other, one can graphically find Т1.
3.
RESULTS AND DISCUSSION
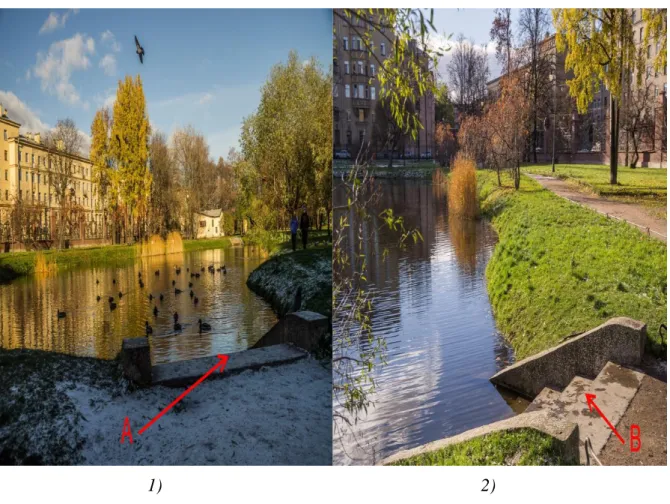
The procedures for measuring Т1 and Т2 by the laboratory portable NMR spectrometer was tested at one of the water bodies situated in the 9th January Memorial Park of St. Petersburg. Figure 4.1-2 shows this pond.
1) 2)
Figure 4.1-2 The pond at which tests were performed
This is an autonomous natural water formation with underwater springs. The water depth is from 0.2 to 3.5 m. Different pond inhabitants and fish (crucian) live there. Earlier crayfishes could be met there, and people used to swim in it. Now the pond is overgrown with weeds. During the tests a team of volunteers measured relaxation constants of water and bottom mud along the shore line at different distances Lс from each other. The distance between the measuring points along the shore line was 0.3 m. The coastline length Lp was 116.2 m and 141.6 m if you moved around the pond to the right and left from the reference point A (see Figure 4.1) to point B (see Figure 4.2), respectively.
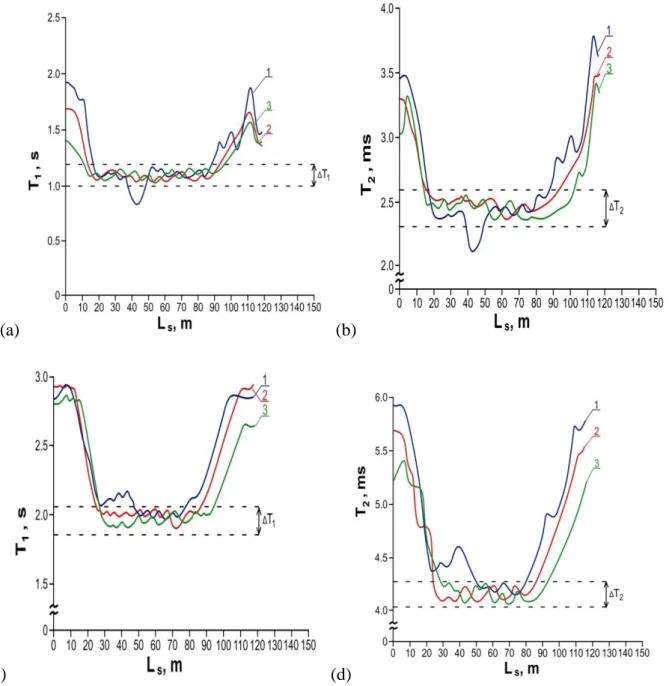
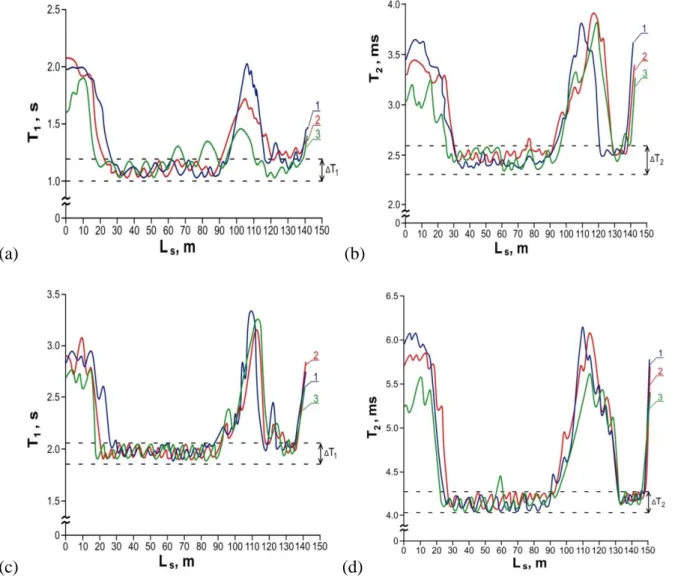
Figures 5 and 6 show dependences of relaxation constants of water and bottom mud at different points of the pond along its perimeter. The graphs show intervals ΔТ1 and ΔТ2, i.e., deviation of relaxation constants from those in the normal condition. These intervals are different for different liquid or viscous media and depend on temperature of the medium. The measurements were performed at the temperature of the medium Т = 274 К. Since the volume of the medium
to the environmental temperature Т in several seconds.
(a) (b)
(c) (d)
Figure 5.1 Relaxation constants of water (5.1, 5.2) and bottom mud (5.3, 5.4) at different points of the pond along its perimeter if you moved around the pond to the right from the reference point A to point B. Curves 1,2,3 correspond to Lс = 5,15,30 cm respectively
(a) (b)
(c) (d)
Figure 6.1 Relaxation constants of water (6.1, 6.2) and bottom mud (6.3, 6.4) at different points of the pond along its perimeter if you moved around the pond to the left from the reference point A to point B. Curves 1,2,3 correspond to Lс = 5,15,30 cm respectively
A large number of deviations of relaxation constants from those of water and bottom mud in the normal condition was revealed though the water was transparent (see Figure 4). Experimental data showed that in the case of an acute pollution two relaxation constants deviated from the “normal” ones. This was especially true for the places where cane and grass grew (see Figure 4.2). No additional studies of the samples were required in this case. Polluted areas can be found from the dependences shown in Figures 5 and 6. Additional analysis of the samples is required for the cases of small deviations. Causes of pollution should be established. In some cases, contaminants can be localized and neutralized with time in a natural way. Then no territory cleaning-up is required.
In one of the pond areas (D), T1 was found to be twice as high as the “normal” value, while T2 did not significantly increase. The bottom mud samples were characterized by appreciably increased T1 and T2 relaxation constants.
The water and bottom mud samples with deviations of relax constants were investigated at a stationary X-ray S2 RANGER spectrometer (BRUKER) at a laboratory of St. Petersburg National Mineral Resources University (University of Mines). It was found that the water and bottom mud from the pond area D contained a dissolved substance with the composition similar
concentrations of building lime, gasoline of all grades, varnishes, technical oils and fats, zinc, iron, manganese, and so on. In two samples mercury was detected.
Having completed the research activities, the volunteers cleared the pond and thoroughly inspected the extracted bottom mud, algae, etc.
Damaged packages with citric acid and pepper were found in the pond area D. A box of broken thermometers was found in the pond area the samples from which contained mercury. So different substances in water and bottom mud were caused by the presence of different packages, containers, etc, in the pond.
We cleared the pond areas for which no deviation of relaxation constants was detected. Waste of different kinds was found in the bottom mud (for example, bottles). After cleaning from the waste, this bottom mud could be used as a fertilizer for the flower beds in the Park.
For comparison, let us consider the situation when environmental monitoring of the pond with a full analysis of the samples is performed in a conventional way. Then 5156 containers for samples would be needed. Since 28 samples are loaded simultaneously into the S2 RANGER spectrometer and the total time for analysis of the sample is 15–20 minutes, the studies would require not less than 47 hours of continuous operation. The use of the rapid analysis method allowed us to conduct the necessary research at the S2 RANGER during 5 hours. In some areas of the pond where a danger of pollution was detected, the density of sampling was increased twice.
CONCLUSION
The experimental results have shown that the portable NMR spectrometer we suggest is a convenient tool for express control of liquid and viscous media. Our test demonstrated high operational efficiency of environmental monitoring (including identification of pollution foci) using our express control method. This method has also proved to be cost effective.
REFERENCES
1. Davydov V.V., Dudkin V.I., Karseev A.U., 2012. The nuclear-magnetic spectrometer for liquid environments analysis express in the conditions of the ecological territory. Proceedings of the 9th International Forum «ECOBALTICA’2012». 69–70.
2. Davydov V.V., Mihin Y.A., 2011 Compact nuclear-magnetic spectrometer. Proceedings of the 8th International forum «ECOBALTICA’2011». 228–229.
3. Selivanov K.O., Davydov V.V., 2002. The application nuclear-magnetic flowmeter-relaxometer on water purification stations for different ingradients control. The 4th International Youth Environmental Forum “ECOBALTICA’2002”. 80.
4. Davydov V.V., Ermak S.V., 2001. A quantum spectrum analyzer based on radiooptical resonance. Instruments and Experimental Techniques. 44, 2, 215–218.
5. Davydov V.V., 1999. The control of expenditure and quality of urban water by NMR flowmeter-relaxometer. Seminar on ecological technology and management “ECO – TECH’ 99 ”. 2, 28–31.
6. Davydov V.V., 1998. The calculation of relaxation times T1 and T2 for flow liquid. International Journal of Modern Physics.7, 9, 798–801.
7. Chen В., Ivanov I., Klein M.L., Parrinello M., 2003. Hydrogen bonding in water. Phys. Rev. Lett. 91(21), 2155–2158.