© Martin Olofsson & Daniel Persson 2013 Division of Production Management
Department of Industrial Management and Logistics Lunds University
Box 118
221 00 LUND, SWEDEN
Preface
This thesis was written during the spring of 2013 as the final part of our Master of Science degree in Industrial Engineering and Management at Lund University, Sweden. This thesis was developed together with BorgWarner TTS Landskrona with the aim to provide a better understanding of the risks in supply chain operations and how they affect the service level towards customers.
It has been an interesting and challenging, but most of all fun, period during which we have learned a lot. The support from the BorgWarner employees both in terms of time invested and keeping our spirits up has been invaluable. We would therefore like to express our outmost gratitude to the employees of BorgWarner and the logistics department in particular. We would like to dedicate a special thanks to our company supervisor Johan Cederfeldt, Logistics manager at BorgWarner, for making this project possible and for providing all the necessary resources.
We would also like to thank our supervisor at the university, Assistant Professor Fredrik Olsson at the department of industrial management and logistics, for raising important questions and giving us valuable comments throughout our thesis.
Finally, as this marks the end of our five-year long journey towards the degree in Industrial Engineering and Management, we would like to thank all of our classmates out of which many have become friends for life.
Lund, June 2013
………. ……….
Abstract
Title: Developing an analysis tool for risk calculation in supply chain operations – A case study at BorgWarner TTS Landskrona
Authors: Martin Olofsson & Daniel Persson
Supervisors: Assistant Professor Dr. Fredrik Olsson, Department of Industrial Management and Logistics, Lund University, Sweden
Logistics Manager Johan Cederfeldt, BorgWarner TTS Landskrona, Sweden
Problem: The case study company, BorgWarner, currently has no quantitative method for evaluating the risks connected to different inventory levels throughout their internal supply chain. Meanwhile there are internal goals for lowering the amount of capital tied in inventory.
Purpose: The purpose of this thesis is to investigate how changes in the component and finished goods inventory levels affect the service level. Currently, the inventory level in each instance of inventory is set manually by the material and production planners and is based on their experience. Consequently, there is no way to evaluate the impact or quantify the risks of stock-outs if there is a decision to lower the inventory levels. The outcome of this thesis is a quantitative tool that shows how changes in inventory will affect the service level towards the customers and the capital tied in inventory.
Delimitations: The scope is limited to only include BorgWarner TTS Landskrona and to only analyze the effect on the customers and products associated with the serial production. Only the immediate suppliers and customers will be included. Spare parts and any return flows are excluded from the scope of this thesis.
Methodology: The thesis work was carried out by a comprehensive value stream mapping of all activities and processes connected to the internal supply chain, such as;
forecasting, product assembly and stock keeping. The value stream map formed the basis for the data analysis from which statistical conclusions could be drawn. Finally, the analysis formed the basis for the quantitative tool.
Result & conclusion: To fulfill the thesis’ purpose, a computerized analysis tool has been developed. The tool evaluates the effect a change in inventory level has on the service level and capital tied in inventory. The approach during this thesis has both contributed to the effectiveness of obtaining the results and for the validation of the analysis model.
Keywords: Inventory control, inventory management, simulation, multi-echelon inventory, value stream mapping, BorgWarner
Sammanfattning
Titel: Utveckling av ett riskberäkningsverktyg för interna värdeflödesaktiviteter – En fallstudie på BorgWarner TTS Landskrona
Författare: Martin Olofsson & Daniel Persson
Handledare: Dr. Fredrik Olsson, Assisterande Professor, Institutionen för teknisk ekonomi och logistik, Lunds universitet
Johan Cederfeldt, Logistikchef, BorgWarner TTS Landskrona Problem: Fallstudieföretaget, BorgWarner, har idag ingen kvantitativ
metod för att utvärdera de risker som finns kopplade till olika lagernivåer. Samtidigt finns det en intern målsättning att sänka kapitalbindningen i lager.
Syfte: Syftet med det här examensarbetet är att undersöka hur förändringar i material- och färdigvarulager påverkar servicenivån mot BorgWarners kunder. I dagsläget sätts lagernivåerna för respektive lager manuellet av material- och produktionsplanerare baserat på deras erfarenhet. Följaktligen finns det inget sätt att utvärdera den påverkan eller kvantifiera de risker för brister som finns kopplat till ändringar av lagernivåerna. Resultatet av detta examensarbete är ett kvantitativt verktyg som visar hur ändringar i lagernivåerna påverkar servicenivån mot kunderna samt kapitalet bundet i lagret.
Avgränsningar: Arbetet är avgränsat till att endast omfatta BorgWarner TTS i Landskrona och endast analysera effekten på de produkter och kunder som omfattas av serieproduktion. Endast BorgWarners direkta leverantörer och kunder kommer att omfattas av analysen. Exkluderat från arbetet är flödet av reservdelar och eventuella returflöden.
Metodik: Examensarbetet utförs genom en grundlig värdeflödesanalys av alla aktiviteter i den interna värdeflödeskedjan så som; prognostisering, produktmontering och lagerhållning. Värdeflödesanalysen följs av en dataanalys där data från värdeflödesanalysen
anpassas till statistiskt användbar data. Denna data är sedan grunden för utvecklingen av analysverktyget.
Resultat & slutsats: För att uppfylla examensarbetets syfte, har ett datoriserat analysverktyg utvecklats för att utvärdera hur en förändrad lagernivå påverkar leveranssäkerheten och kapitalbindningen i lager. Det valda tillvägagångssättet har under detta examensarbete bidragit till att underlätta framtagandet av resultatet och till att validera analysmodellen.
Nyckelord: lagerstyrning, flernivålagerstyrning, värdeflödesanalys, simulering, BorgWarner
List of acronyms
A list of acronyms used in this thesis is presented in Table 1.1.
Table 1.1. List of acronyms used in this thesis.
Acronym Expansion Explanation
BOM Bill Of Materials List of sub-components of a product. BW TTS
BorgWarner TorqTransfer Systems
The focal company of this thesis.
CNC Computer
Numerical Control Computer system for controlling machine tools. ERP Enterprise
Resource Planning Software system used to manage a company. FGI Finished Goods
Inventory
The inventory where finished products are stored.
FIFO First In First Out Inventory policy.
FCA Free Carrier INCO-term. Responsibility and ownership is transferred when the goods leave the sender. Gen4 Generation 4 Product generation at BW TTS.
Gen5 Generation 5 Product generation at BW TTS. INCO International
Commerce Terms International organization for trade terms ISO
International Organization for Standardization
International organization for setting commercial and industrial standards.
MRP
Material Requirements Planning
Production and inventory control system, see Section 3.2.3.
OEM Original Equipment Manufacturer
In automotive industry; the manufacturer of the vehicle.
OEE Overall Equipment Efficiency
A metric for measuring the effectiveness of a manufacturing operation.
List of figures
Figure 1.1. Schematic figure of organizational structure (Borg, 2013). ... 3
Figure 1.2. The scope and limitations of the master's thesis. ... 5
Figure 1.3. Schematic view of the thesis. ... 6
Figure 2.1. Illustration of the abductive research process (Kovács & Spens, 2005) . 9 Figure 2.2. Process over the incremental development design ... 10
Figure 2.3. The different stages of research procedure in this thesis. ... 11
Figure 2.4. As the thesis progresses, the scope of the thesis gets more specific. .. 14
Figure 3.1. (R, Q) policy with periodic review and continuous demand (Axsäter, 2006). ... 24
Figure 3.2. (s, S) policy with periodic review and continuous demand (Axsäter, 2006). ... 25
Figure 3.3. Different ways to analyze a system (Law & Kelton, 2000) ... 28
Figure 4.1. A Gen4 (left) and Gen5 (right) coupling. (BorgWarner Inc., 2013) ... 32
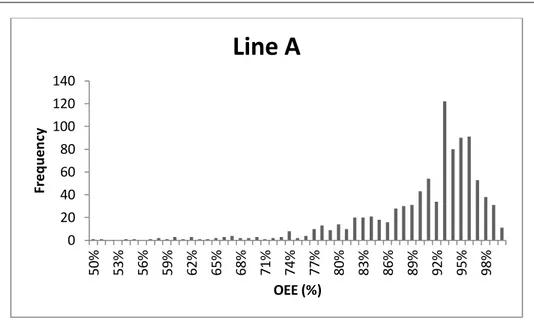
Figure 4.2. Histogram of the OEE output of assembly line A. ... 35
Figure 4.3. Histogram of the OEE output of assembly line B... 35
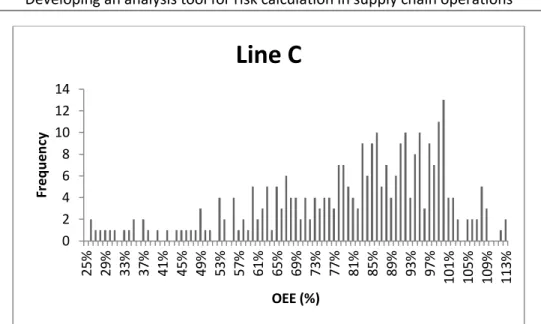
Figure 4.4. Histogram of the OEE output of assembly line C. ... 36
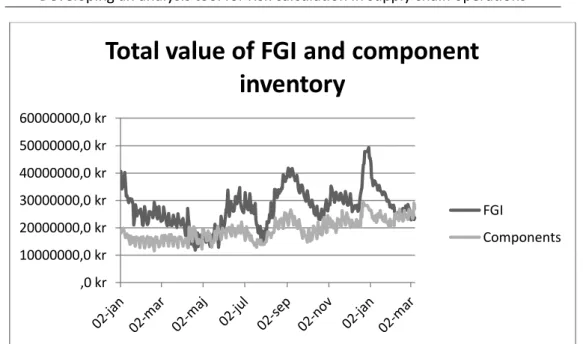
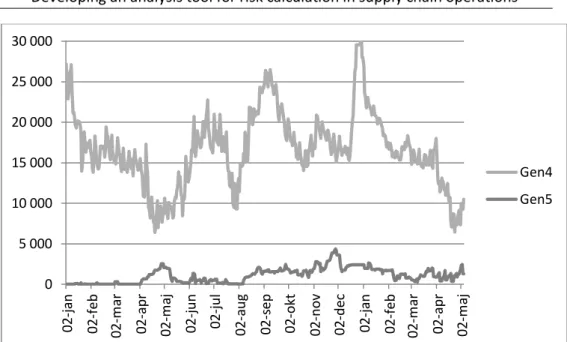
Figure 4.5. Total value of the FGI and component inventory from January 2012 to March 2013. ... 41
Figure 4.6. Total inventory levels (units) per generation from January 2012 to May 2013... 42
Figure 4.7. Inventory levels at the consignment stock and the FGI for customer Y from January 2012 to May 2013. ... 43
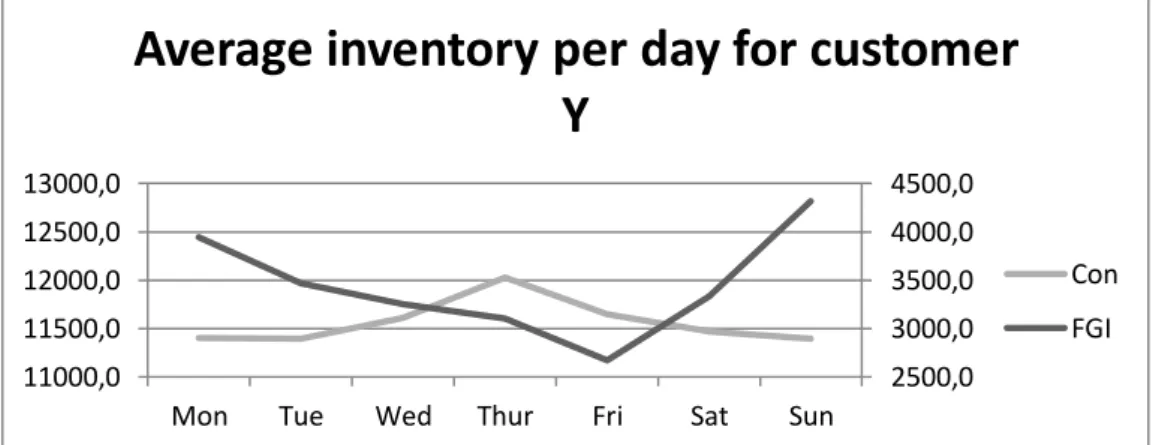
Figure 4.8. Average inventory per day at the consignment stock and the FGI for couplings for customer Y from January 2012 to May 2013. ... 43
Figure 4.9. Average inventory (units) per day for couplings for customer X from January 2012 to May 2013. ... 44
Figure 4.10. Total value of components buffer January 2012 to March 2013. ... 45
Figure 5.1. Normal distribution with mean value and standard deviation to represent the data. ... 48
Figure 5.2. Deviations from forecasted plan for customer X... 51
Figure 6.1. The two modules in the model. ... 57
Figure 6.2. Interaction between the two modules. ... 58
Figure 6.3. Graphical representation of arbitrary output. ... 59
Figure 6.4. Description of the calculations steps in the FGI module. ... 64 Figure 6.5. The difference between the real-life assembly system and the model.
Figure 7.1. The capital tied in inventory over the entire simulation run. ... 80 Figure 7.2. The total production over-time needed during the simulation run. ... 81 Figure 7.3. The service level over the entire simulation run. ... 82 Figure 10.1. Gen4 value stream map. ... 93 Figure 10.2. Gen5 value stream map. ... 95
List of tables
Table 1.1. List of acronyms used in this thesis... viii
Table 3.1. The OEE losses. ... 18
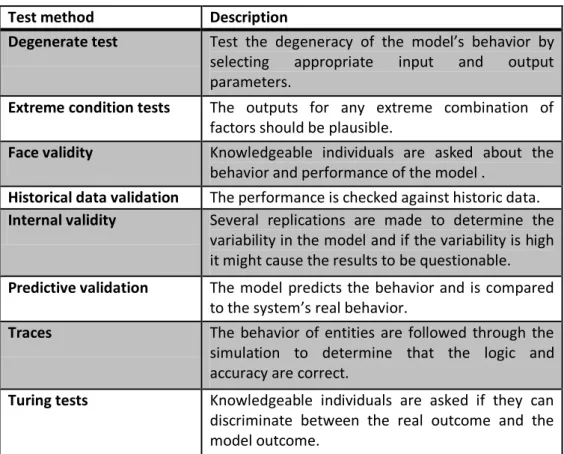
Table 3.2. Different tests for validation and verification (Sargent, 2010). ... 30
Table 4.1. Parameters for each assembly line. ... 34
Table 5.1. Outcome of chi-square test on the OEE of the assembly lines... 49
Table 5.2. Chi-square test for the normal distribution fitted to the observed forecast deviations of customer X. ... 52
Table 5.3. Deviations from forecasted plan for customer Y. ... 53
Table 6.1. Product specific input parameters. ... 62
Table 6.2. Relationship between production day and arrival day ... 68
Table 6.3. Component specific parameters ... 72
Table 6.4. Coupling house specific parameters ... 72
Table 7.1. Overview of the results of the example simulation. ... 81
Table 10.1. Process family matrix for the products and activities at BorgWarner. 91 Table 10.2. Number of observations, mean and standard deviation of the OEE of the assembly lines per month and total. ... 95
Table 10.3. Normal (X) and overtime (O) operating hours for line A, B & C. ... 96
Table 10.4. Parameters for the machining department. ... 97
Table of contents
1 INTRODUCTION ... 1
1.1 BACKGROUND ... 1
1.1.1 The inventory’s role in business ... 1
1.1.2 BorgWarner TorqTransfer Systems ... 2
1.2 PURPOSE AND RESEARCH QUESTION ... 4
1.3 SCOPE AND DELIMITATION ... 4
1.4 REQUIREMENTS SPECIFICATION FOR THE ANALYSIS TOOL ... 5
1.5 STRUCTURE OF THESIS ... 6 1.6 TARGET GROUP ... 6 2 METHODOLOGY ... 7 2.1 SCIENTIFIC APPROACH ... 7 2.2 RESEARCH METHOD ... 8 2.3 RESEARCH STRATEGY ... 9 2.4 DESIGN STRATEGY ... 10 2.5 DATA COLLECTION... 11
2.5.1 Quantitative and qualitative data... 11
2.5.2 Primary and secondary data ... 12
2.5.3 Exploratory interview ... 12
2.5.4 First literature review ... 12
2.5.5 Mapping - Observations, ERP data extraction and interviews ... 12
2.5.6 Second literature review ... 13
2.6 VALIDITY AND RELIABILITY ... 14
3 THEORETICAL FRAMEWORK ... 15
3.1 VALUE STREAM MAPPING... 15
3.1.2 Creating the current state map... 16
3.2 GENERAL INVENTORY CONTROL ... 17
3.2.1 Uncertainties and forecasts ... 17
3.2.2 Definitions ... 20
3.2.3 Ordering policies ... 23
3.3 STATISTICS THEORY IN CONNECTION WITH INVENTORY CONTROL ... 26
3.3.1 Distributions ... 26
3.3.2 Goodness of fit test ... 27
3.4 MODELING... 28
3.4.1 Experiment with the actual system vs. experiment with a model of the system 29 3.4.2 Physical model vs. mathematical model ... 29
3.4.3 Actual solution vs. simulation ... 29
3.5 SIMULATION ... 29
4 EMPIRICAL DATA ... 31
4.1 PURPOSE OF VALUE STREAM MAPPING ... 31
4.2 PRODUCTS ... 31
4.3 ASSEMBLY LINES ... 32
4.3.1 Efficiency ... 33
4.3.2 Scheduled production and overtime production ... 36
4.4 MACHINING DEPARTMENT ... 37
4.5 CUSTOMERS AND FORECASTING ... 38
4.6 SUPPLIERS AND SUPPLY PLANNING ... 39
4.8.2 Component buffer ... 44
4.9 SERVICE LEVEL ... 45
4.10 QUALITY ISSUES ... 45
5 DATA ANALYSIS ... 47
5.1 PURPOSE AND STRATEGY OF DATA ANALYSIS ... 47
5.2 FITTING STATISTICAL DISTRIBUTIONS TO THE DATA ... 47
5.2.1 OEE output of assembly lines ... 47
5.2.2 Output of the machining department ... 49
5.2.3 Deviation of supplier deliveries ... 50
5.2.4 Forecast deviations ... 51
5.2.5 Delays during shipping ... 53
5.3 STATIC DATA ... 53
6 MODEL... 55
6.1 MODEL APPROACH ... 55
6.1.1 Type of approach ... 55
6.1.2 Validation and verification of the model ... 56
6.2 OVERALL STRUCTURE ... 57
6.3 ASSUMPTIONS ... 59
6.3.1 Periodic review... 59
6.3.2 Changeover times ... 60
6.3.3 Rescheduling ... 60
6.3.4 Inventory for customer Y ... 60
6.4 FINISHED GOODS INVENTORY MODULE ... 60
6.4.1 Input data ... 60
6.4.2 Module overview ... 63
6.4.4 Reduction of inventory ... 69 6.5 COMPONENT MODULE ... 70 6.5.1 Input data ... 71 6.5.2 Module overview ... 72 6.5.3 Calculations ... 73 7 RESULTS ... 79 7.1 OVERVIEW ... 79 7.2 EXAMPLE SIMULATION ... 79
7.3 ADDITIONAL RESULTS AND USE OF THE TOOL ... 82
8 CONCLUSION ... 83
8.1 FULFILLMENT OF PURPOSE ... 83
8.2 EVALUATION OF THE CHOSEN APPROACH ... 84
8.3 DIFFICULTIES DURING THE THESIS ... 84
8.4 RECOMMENDATIONS FOR FUTURE RESEARCH ... 84
9 REFERENCES ... 87
1 Introduction
This chapter gives an introduction to this master’s thesis and
describes the background of the studied field and the case
company. The purpose, research questions, scope and
delimitations are also presented as well as the structure and the
target group of the thesis.
1.1 Background
This master’s thesis is conducted as a case study at BorgWarner TorqTransfer Systems in Landskrona in the field of inventory control. In this section the reader is introduced both to the topic and the company.
1.1.1 The inventory’s role in business
Today, manufacturing companies operate in a competitive environment and streamlining the company’s supply chain is becoming an even more important priority (Christopher, 2005). Reducing capital tied in inventory is a focus in many companies. The ability to finance the business and the company’s return on equity is directly affected by the capital tied in inventory (Mattsson, 2003). In the average manufacturing company the capital tied in inventory represents a significant proportion of the total capital. Generally, manufacturing companies tie as much capital in inventory as in plant and equipment assets and more than the capital tied in accounts receivables (Mattsson, 2003). This shows that there is room for improvement, which is recognized by top management in many firms (Axsäter, 2006).
Reducing inventory and planning production have consequently become important means for companies to compete in the market (Voss & Woodruff, 2005). A well-known philosophy in manufacturing companies is the Lean concept, which focuses on reducing waste in the production system. In the Lean perspective inventory is regarded as one of seven defined wastes, since components and goods in inventory does not add any value to the customer (Pepper & Spedding, 2010). The Lean concept is well adopted, especially in manufacturing companies, since efficient production systems are capable of producing goods at a lower total cost. Compared to an investment in a new machine, the inventory level is not only affected by a single decision or position. Improvements are made through better planning processes and control systems (Mattsson, 2003).
Inventory control is a structured and analytical approach to manage inventory and production schedules in organizations. One of the central and original pillars of
inventory control is Materials Requirement Planning (MRP), which is the planning of materials requirements, in production, using demand forecasts for future time periods. This facilitates more precise control and links demand with material ordering (Jacobs & Weston Jr, 2007). Before the introduction of MRP systems simple decision rules were used and planning had to be done manually (Axsäter, 2006). Computerized MRP systems emerged in the 1960s as a tool for planning and scheduling of products with complex product structures (Jacobs & Weston Jr, 2007). The development of information technology has enabled more efficient inventory control through more accurate and real-time information flows (Axsäter, 2006).
The field of inventory control has contradictory objectives; minimizing cost and maximizing customer service. The costs are related to ordering, holding inventory, production and transportation. Customer service level concerns meeting customer requirements in terms of delivery capabilities (Axsäter, 2006). The cost and customer service aspects are closely correlated; improving one aspect is likely to have negative impact on the other. For example, by increasing inventory a higher customer service level can often be achieved but will also lead to higher inventory holding cost (Lumsden, 2006). To further increase the complexity, inventory control is influenced by a number of variables which affect the performance of the system (Axsäter, 2006). Consequently, companies need to continuously work with inventory control in order to achieve a cost efficient way to produce their goods.
1.1.2 BorgWarner TorqTransfer Systems
BorgWarner TorqTransfer Systems AB produces all-wheel drive couplings for passenger cars. The company’s mission is to develop leading powertrain technologies that improve fuel economy, emissions and performance (BorgWarner Inc., 2011). The patented product features a programmable electronic control unit that can be customized to meet each customer’s specific requirements (Cederfeldt, 2013). This type of coupling was first produced in 1998 by the Haldex Traction System division at the plant in Landskrona, Sweden. The development of couplings has progressed over the years and has been driven, mainly, by a cost reduction focus. Currently, a fourth generation coupling is the principal product sold but the company is in a transitional phase where the less expensive generation five coupling is being introduced and will replace the fourth generation (Cederfeldt, 2013).
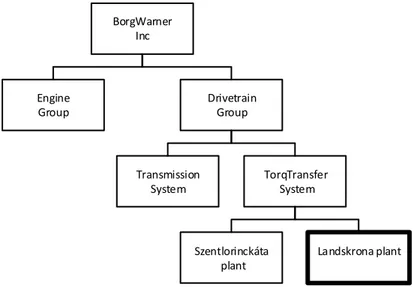
(BorgWarner Inc., 2011). The company is divided into Engine and Drivetrain solutions, where BorgWarner TTS is a business unit within Drivetrain solutions, see Figure 1.1 (Borg, 2013). BorgWarner TTS Europe has approximately 430 employees where 330 are based at the plant in Landskrona, which is also the headquarter of the business unit, and 100 employees are based at the plant in Szentlorinckáta, Hungary (Borg, 2013).
BorgWarner Inc Engine Group Drivetrain Group Transmission System TorqTransfer System Szentlorinckáta plant Landskrona plant
Figure 1.1. Schematic figure of organizational structure (Borg, 2013).
The main value adding activity performed at the Landskrona plant is the assembly of couplings. The product range consists of approximately twenty different couplings (BorgWarner TTS, 2013), which are assembled in four semi-automatic assembly lines with a total yearly output of approximately 900 000 couplings (BorgWarner TTS, 2013). Each coupling consists of 40 to 70 different components depending on generation and variant (BorgWarner TTS, 2013). All, but one, of the components for the couplings are externally sourced from a worldwide supplier base although the majority of the suppliers are based in Europe. The component that is not fully sourced from outside suppliers is the coupling house, which is the base of the coupling (Svensson, et al., 2013). Approximately one third of the coupling houses are processed at the Landskrona plant, which has its own machining department with six CNC lathes and a yearly output of 300 000 coupling houses. The rest of the coupling houses are bought, fully processed, from external suppliers (Svensson, et al., 2013).
An important supporting function at the Landskrona plant is the logistics department, which has the complete responsibility for receiving customer orders, planning the assembly and machining departments and calling off material from suppliers in order to meet production. The logistics department also overlooks the
warehousing and shipping department where finished couplings are sent to customers (Cederfeldt, 2013). The customers that the Landskrona plant serves are primarily first tier suppliers to the European automotive industry. The main customers, in terms of sold products, is a drivetrain manufacturer located in Austria and a Swedish manufacturer of driveline solutions (Palm & Sahlé, 2013). The Landskrona plant has a finished goods inventory (FGI) on site and distributes couplings directly to the Swedish customer and spare parts and low volume couplings to smaller customers. The distribution to the Austrian customer is carried out via a consignment stock at the customer’s production site in Austria where BorgWarner retains ownership of the couplings until the customer uses them in production (Palm & Sahlé, 2013).
1.2 Purpose and research question
The purpose of this thesis is to investigate how changes in the component and finished goods inventory levels affect the service level. The service level is measured as the total amount of units delivered divided by the total amount requested by the customer. Today BorgWarner has a goal of 100% service level and the actual performance in 2011 was 99.8% (Palm & Sahlé, 2013). At the same time there is a goal to reduce the capital tied in inventory by reducing the number of inventory days. The logistics manager in Landskrona, suspects that optimal inventory levels are not utilized at the Landskrona plant. Currently, the inventory level in each instance of inventory is set manually by the material and production planners and is based on their experience. Consequently, there is no way to evaluate the impact, or quantify the risks, of stock-outs if there is a decision to lower inventory levels. The logistics manager needs a quantitative tool that shows the current and forecasted delivery ability, but also how changes in inventory will affect the performance. In order to build a foundation and to facilitate the development of such a tool the internal processes at BorgWarner needs to be mapped.
This purpose yields the following research questions:
- What are the risks and uncertainties that exist in the value chain? - How do these risks and uncertainties affect the inventory levels?
- How do changes in the inventory levels of each instance affect the service level?
Consequently, the thesis will only consider the suppliers closest upstream in the value chain and the immediate customers downstream of BorgWarner. Internal aspects such as machine breakdowns in assembly and disruptions in the intermediate transports of the value chain will be taken into consideration. See Figure 1.2 for a schematic view of the scope and limitations.
3291mm
Distribution Inbound transport
BorgWarner TTS Landskrona Plant
Machining Assembly Suppliers Outbound transport $ $ Customers Consignment stock Finished goods inventory Components buffer
Figure 1.2. The scope and limitations of the master's thesis.
The thesis is limited to the scope described above and does not consider changes in the current process setup. There are also a number of material flows going through the Landskrona production plant that will not be considered, such as spare part production, components not used in high volume serial production and return flows from customers. External, uncontrollable, factors unrelated to the material flow such as fires or earthquakes will not be taken into account.
1.4 Requirements specification for the analysis tool
The goal of this thesis is to deliver an analysis tool to BorgWarner for use in situations related to inventory and service levels. Together with the logistics manager, the following requirement specification for the tool was established:
- Fulfill the purpose outlined above.
- Function independently of any enterprise system. - Compatible with MS Excel 2010.
- Show current stock value in component buffer and finished goods inventory.
- Show predicted service level per product within the planning horizon. - Show how manual changes of inventory levels, per product and
component, affect the service level.
1.5 Structure of thesis
In Figure 1.3, a schematic view of the thesis is shown. The introduction and methodology chapters introduce the background to the study, the research questions and the chosen approach. The theoretical framework chapter forms the basis for the analysis together with the empirical data chapter.
The analysis chapter combines the theoretical findings with the empirical findings to form a foundation of analyzed data, which is to be used as input for the tool. Finally, the model and the logic of the model are described in the model chapter and a discussion about the outcome of the thesis is presented in the conclusion chapter.
1. Introduction 2. Methodology
3. Theoretical framework
4. Empirical data
5. Data analysis 6. Model 7. Conclusions
Figure 1.3. Schematic view of the thesis.
1.6 Target group
The target group for this master’s thesis is primarily the logistics manager, material planners and production planners of BorgWarner. Additionally, staff at BorgWarner responsible for the material flow at the Landskrona plant and top management may be interested in the results of this thesis. The thesis can also work as a starting point for further improvements at BorgWarner, performed by employees or external sources, or similar initiatives at other companies. The thesis also targets academics in logistics and other people interested in the field of logistics.
2 Methodology
This chapter presents the methodology used in this thesis; the
scientific approach is presented followed by research method,
strategy, design and data collection plan. The methodology
chapter is a roadmap of how the purpose and research questions
of the thesis will be answered.
2.1 Scientific approach
When conducting research it is important to approach the problem in a methodological manner in order to give the reader a better understanding of what, previously, has been done within the field but also how future research can be conducted (Gammelgaard, 2004). Traditionally, research within the field of logistics has mostly been carried out in a positivistic approach (Gammelgaard, 2004). Gammelgaard (2004) argues that the positivistic research approach is too one-sided and that the field would benefit from more methodological approaches.
In this thesis the scientific approach adopted is a systems approach. The systems approach is characterized by a holistic view of the problem and that the links between each component of the problem is just as important as the components themselves (Arbnor & Bjerke, 1997). The objective of the researcher is to understand the components, links, goals and feedback mechanisms of a system in order to suggest improvements (Gammelgaard, 2004). This means that the systems approach is contextual and in order to find information it is necessary to analyze and compare cases instead of finding cause-and-effect relations (Gammelgaard, 2004).
The systems approach is also logical in its nature and therefore the outcome of the research conducted is a problem solution that works in practice as opposed to absolute facts (Gammelgaard, 2004). As the aim of this thesis is to understand how inventory levels and uncertainties in BorgWarner’s value chain affects the delivery performance, the systems approach is well suited for this thesis.
The systems approach can be compared to the analytical approach presented by Arbnor and Bjerke (1997) where each component should be analyzed individually in order to find an optimal solution for the whole system. This is not appropriate in this thesis or when optimizing multi-echelon inventory levels as the solution provided is likely to be sub-optimized (Axsäter, 2006). The outcome of this thesis also aims to provide a practical analysis tool as opposed to the optimal inventory levels.
Neither the actors approach, presented by Arbnor and Bjerke (1997), is suitable as it heavily focuses on the qualitative aspects of the people involved in the system. This is not sufficient as the main activity analyzed in this thesis concerns the processes at BorgWarner.
The three scientific approaches mentioned above, form the framework presented by Arbnor and Bjerke (1997). The basis of the framework is that the choice of research method should be influenced by the researcher’s perspective of reality and not solely on the nature of the research question (Arbnor & Bjerke, 1997). Gammelgaard (2004) argues that this framework is well suited for research in the field of logistics as a complement to the traditional positivistic approach.
2.2 Research method
It is important to select an appropriate research method for the problem in order to achieve the objectives of the study. The research method influences how the research is conducted, from what perspective it originates and how conclusions should be drawn. The research path generally moves between theoretical studies and empirical observations, and the method should be designed as a combination of these to fulfill the research goals (Arbnor & Bjerke, 1997).
For this thesis an abductive research method is used. The abductive method follows a process, which starts with empirical observations, where problems or deviations are identified (Kovács & Spens, 2005). A search for existing theories or frameworks in the field of study is then initiated to match the observations made. This is an iterative process which continues through additional empirical observations and further knowledge gains until an adequate theoretic framework can be established. This, suggested, research method can then have additional applicability in real-life (Kovács & Spens, 2005). An illustrative description of the abductive research method is shown in Figure 2.1.
P ar t o f th e re se ar ch Th eo re ti ca l Em p ir ic al (0) Prior theoretical knowledge
The abductive research process
(1) Deviating real-life observations
(2) Theory matching (3) Theory suggestion (Final conclusions: H/P)
(4) Application of conclusions
Figure 2.1. Illustration of the abductive research process (Kovács & Spens, 2005)
The abductive method is highly applicable to the purpose of this thesis. The thesis originated from an identification of a problem at BorgWarner and a central pillar of the research process is the task of matching this problem with established theory in the field of inventory control. The aim is to develop a theoretical model that represents BorgWarner’s situation, which will be the basis for the analysis tool. Since the thesis starts from an observed problem at the company and the intended finish point is the deployment of an analysis tool, neither a deductive nor inductive approach would be suitable. The deductive method starts in theory, where a hypothesis is formulated and empirical tested and then either confirmed and rejected. Inductive research starts with a real-life observation which is analyzed and theoretical conclusions are drawn (Kovács & Spens, 2005). However, inductive research lacks the iterative process between observations and theory. With this iterative process, the theoretical conclusion is developed through incrementally gained knowledge and understanding of the company’s processes, which assures validity of the conclusion and further usability.
2.3 Research strategy
It can easily be concluded that different research strategies should be utilized in different research situations. A number of strategies for approaching research have been identified in academic literature. Yin (2003) describes five frequently used strategies while Höst et al. (2006) mention four similar and related strategies. The strategies described by Yin (2003) are experiment, survey, archival analysis, history and case study. A case study can be defined in the following way:
“A case study is an objective, in-depth examination of a contemporary phenomenon where the investigator has little control over events.” (McCutcheon & Meredith, 1993, p. 240)
In the work of Höst, et al. (2006), a variant of case studies is described, called action research. For this thesis, this variant of a case study is deemed appropriate. Action research is described as suitable when a problem should be solved at the same time as it is studied (Höst, et al., 2006). The first phase of action research is to observe and clarify the problem that is set to be solved. With a proper understanding of the issue, a solution is proposed and implemented. The final phase is to evaluate the implemented solution (Höst, et al., 2006).
2.4 Design strategy
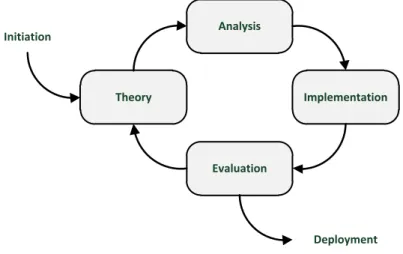
The deliverable of this thesis, except this written report, is a computerized support tool for inventory control. To achieve this deliverable, it is fundamental that the tool represents reality in a satisfactory manner. However, the complexity of such a system can be severe and to reduce the risk of misalignment between the tool and reality, incremental development is used (see Figure 2.2). Incremental development is a method commonly used in software development and implementation projects. The strategy is based on a process where the core functions are implemented first to ensure functionality. Subsequent development is in the form of small increments with additional functionality that is implemented stepwise (Jalote, 2008). This strategy enables the focus to be on one defined problem at a time and validations can be performed after each step. Drawbacks are that rework of the implemented parts might be required when features are added, which prolongs the total development time (Jalote, 2008).
Theory Analysis Implementation Evaluation Initiation Deployment
2.5 Data collection
As the outcome of this thesis is an elaborate analysis tool, comprehensive data gathering is required as a basis for the analysis and development phases. The data collection is necessary in order to understand the physical flows of material and information in the system. Furthermore, in order to understand the dynamics of inventory management and control, a comprehensive study of literature in this field is to be conducted.
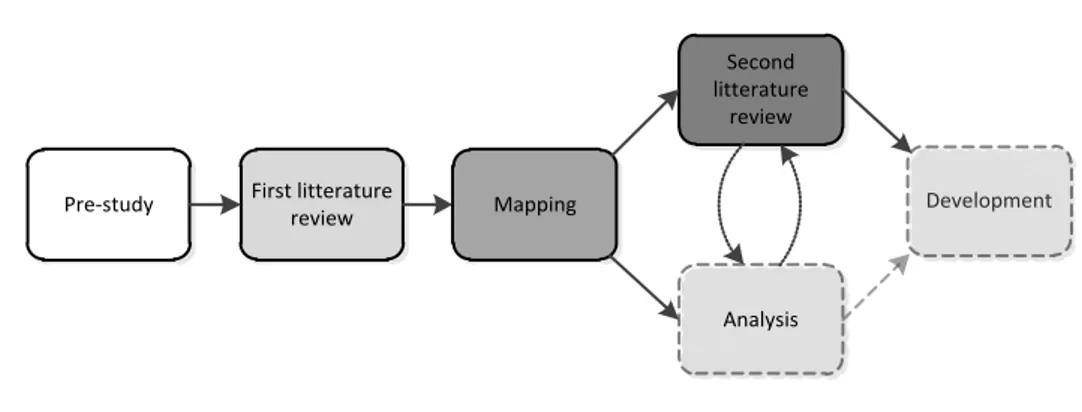
In order to approach this problem in a structured manner a short pre-study of the BorgWarner’s production and distribution system is conducted through exploratory interviews. The pre-study is followed by a literature review of the field to establish a theoretical framework. The theoretical framework serves as a basis for the extensive mapping of BorgWarner's processes and activities within the scope of this thesis. As the thesis follows the abductive research methodology the last part of the data collection phase will be interspersed with the analysis phase. The research procedure is illustrated in Figure 2.3.
Second litterature
review
Analysis
Development Pre-study First litterature
review Mapping
Figure 2.3. The different stages of research procedure in this thesis.
2.5.1 Quantitative and qualitative data
Data collection can be conducted in two distinctive forms, quantitative, and qualitative. The different collection forms should be used in different research situations. Quantitative data is data that can be counted and classified such as numbers, proportions and colors (Höst, et al., 2006). Quantitative data can be analyzed with statistical methods whereas qualitative data is in the form of words or descriptions and requires analysis methods, based on categorization and sorting, to understand and draw conclusion from (Höst, et al., 2006).
2.5.2 Primary and secondary data
There are two sorts of data types, primary and secondary data. Primary data is data that has been collected first-hand by the researcher for the specific project while secondary data is data that has been produced and collected for another purpose or study (Björklund & Paulsson, 2003). While primary data often can be collected and interpreted as the researcher desires, secondary data that has already been analyzed can, possibly, be biased (Höst, et al., 2006).
2.5.3 Exploratory interview
In order to approach the problem correctly and to understand the overall structure of the processes and activities, at BorgWarner, exploratory interviews are held with the personnel of the logistics department. The interviews are conducted in a semi-structured way, meaning that the interviews follow a predefined structure with some fixed questions and some questions being adapted to the answers of the interviewees (Höst, et al., 2006). The content of each interview is summarized and the interviewees are given the chance to make corrections or clarify any misinterpretations. The sum of the digested information from the interviews serves as guidance for the continued study.
2.5.4 First literature review
The purpose of the first literature review is to establish a theoretical framework based on the findings of the pre-study. The focus of this literature review is mapping techniques for processes and material flows in manufacturing industries. The review will be based on literature recommended by the university supervisor as well as suitable literature found by the authors of this thesis. In order to find reliable literature searches are to be conducted in university and scientific catalogues. Relevant literature can then be used as the base for finding additional literature by using the “snowball” approach (Jalote, 2008). The snowball approach starts with a credible source and then expands by using its references to continue the review followed by a new set of references. By using this approach specific knowledge can be found by going deeper into specific literature. To increase the validity, of literature found in these catalogues, sources with high citation ranks will be prioritized.
2.5.5 Mapping - Observations, ERP data extraction and interviews When the theoretical framework has been laid down the mapping phase commences. The mapping process encompasses both quantitative as well as
Empirical observations
Data extraction from BorgWarner's ERP system
Interviews
Empirical observation is a type of primary data collection where the researcher observes a certain event or behavior. The observation point for the researcher can range from just observing to taking an active part in the event itself (Höst, et al., 2006). In this study the empirical observations will be conducted by, passively, observing processes at the Landskrona plant and performing time measurements in order to determine e.g. specific process times. The purpose of the empirical observations is to gather quantitative, primary, data that is not available through other channels.
One of the principal sources of quantitative data for this thesis will be the ERP system of BorgWarner. Operational data on e.g. quantities, bill of materials (BOM) and historical sales will be collected in order to comprehend the scale of operations and to form the data basis for the analysis.
Finally, qualitative data about decisions in the value chain are to be gathered through interviews and by “walk-alongs”. The interviews at this stage will be conducted as the open question type interviews, where the subject of the interview will be presented and the interviewee can then speak freely within the frame of the subject (Höst, et al., 2006). The walk-alongs will be conducted, by the authors, by following key personnel through a typical day of their work. This aims to build a better understanding for the decision making in the value chain.
2.5.6 Second literature review
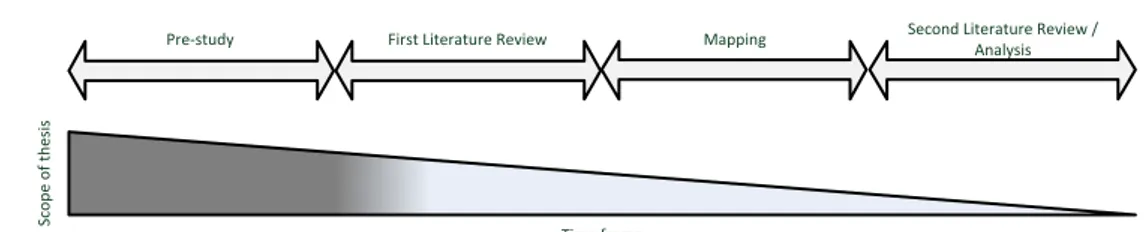
The last part of the data collection phase is closely linked to the analysis phase as they will be carried out simultaneously. In accordance with the abductive research methodology theory and analysis will be combined as the study progresses. The focus of the second literature review will be on specific analysis methods and approaches applicable to the findings of the mapping phase. The findings in this phase will also form the basis for the subsequent development phase. Again, literature recommended by the university supervisor as well as literature found by the “snowball” approach will be used, but with a narrower focus. By the end of this phase the scope of the thesis will be finalized, see Figure 2.4.
Sc o p e o f th e si s Time frame
Pre-study First Literature Review Mapping Second Literature Review / Analysis
Figure 2.4. As the thesis progresses, the scope of the thesis gets more specific.
2.6 Validity and reliability
As briefly stated in the previous section, it is of high importance that the analysis tool developed is representative of reality. For this reason the data collection methods, analysis methods and the results have to be validated and the reliability checked.
In this thesis different approaches are used for different phases. During the theory building phase there is a strong emphasis on ensuring the validity of the information. In this thesis there has been a focus to collect information from highly credible sources. To ensure correct theoretical understanding, the authors primarily collect information from academic journals and books, where the number of citations and replication of theory have been used to evaluate the credibility.
The aim of the empirical data collection is to collect data from primary sources when possible. The data can be in the form of both first-hand observations and interviews. To validate that the data is understood correctly it is verified by the interviewee or, for observations, confirmed by appropriate personnel.
The analysis and calculation will be built on the theoretical knowledge and empirical data. It is important to have a high validity in the analysis phase to produce valid results. Much of the analysis and calculations have underlying assumptions, which are based on theory and empirical data. To improve the validity, the authors discuss the assumptions in terms of how reasonable and realistic they are and the effect they have on the results if the assumptions do not hold.
3 Theoretical framework
In this chapter the theoretical framework used in this thesis is
presented. The chapter contains theory on the value stream
mapping technique used during the data collection phase as
well as the theories linked to the analysis and modeling phases.
3.1 Value stream mapping
In order to introduce the value stream mapping tool, the value stream concept should first be clarified. The value stream of a company involves all activities and actions necessary to bring a product from raw material to finished goods in the hands of the customer (Rother & Shook, 1992). The value stream perspective gives a holistic view instead of focusing on individual processes. This is very useful when improvement measures are to be implemented, as a holistic view will prevent sub-optimization (Rother & Shook, 1992). The actual value in the value stream consists of all the activities that add value in order to meet the need of a customer. Value adding activities can be; machining, assembly, drilling, etcetera. (Manos, 2006). Activities that are not adding value are, most likely, waste such as waiting time, overproduction and unnecessary transports (Hines & Rich, 1997). The value stream mapping tool is a simple, yet effective, way to map the processes, both value adding and non-value adding, of a value stream in a company (Rother & Shook, 1992). The idea is simply to follow a product’s production path from the supplier to the customer while making visual representations of every activity and step of the way (Rother & Shook, 1992). In addition to the physical flows in the production path the information flows must also be mapped. This makes the value stream mapping tool unique as it is the only tool that shows the link between information and material flow (Rother & Shook, 1992).
3.1.1 Process family matrix
As many companies offer several products and many products have different BOMs and go through different processes it is important to narrow the scope of the value stream map (Rother & Shook, 1992). One way of finding a balance between mapping each product separately, which would be inefficient and time consuming, and mapping all products at once, which would result in a chaotic and incomprehensible map, is to map according to process families (Rother & Shook, 1992). Process families are groups of products that share or go through similar process steps (Manos, 2006). In order to determine the process families a process family matrix can be used. The process family matrix consists of two axis, one axis
for all the products and the other axis for all production steps and equipment. Every intersection where a product passes through a product step should be marked with an ‘X’. By plotting all the products in this manner the product families should be determinable (Manos, 2006).
3.1.2 Creating the current state map
The current state map is a representation of the current state, showing both the material and the information flow as well as the performance (Suciu, et al., 2011) (Manos, 2006). The current state map normally starts with a single plant focus, showing an overview of the flow from receiving goods through production to shipping. With a clear picture, the focus can later be changed to involve either additional plants and companies or to focus on single process steps (Rother & Shook, 1992).
As mentioned earlier, value stream mapping is a very practical tool. However, in academic literature there exist a few guidelines for how a current state map should be created. One key aspect, is that the people creating the current state map should walk the material and the information flows themselves, interviewing the people performing the tasks (Rother & Shook, 1992) (Manos, 2006). The argument for ‘walking the flow’ is that a better picture of the entire process is developed and misconceptions of how tasks are performed are minimized (Manos, 2006). To obtain the overview of the flow in the plant, the walk should first be conducted from receiving to shipping. However, when starting to draw the map, the walk should be done by following the material flow upstream, starting from the shipping dock and finishing at the receiving. With this methodology the processes closest to the customer will be drawn first, which should guide the processes upstream (Rother & Shook, 1992). When gathering data and process times, the collector should avoid using default data and times when possible, and instead measure the data personally (Rother & Shook, 1992). In the literature it is also suggested to draw the draft of current state on paper simultaneously while walking the flow (Rother & Shook, 1992) (Manos, 2006).
The current state map is more than an illustrative representation of the material and information flow, it shows key data of the processes. Normally, the represented data include time in each process step and inventory, machine availability and rejection rates (Rother & Shook, 1992). The last step in the creation of the current state map is to add a timeline indicating when value is added and when there is waste (Rother & Shook, 1992).
3.2 General inventory control
Inventory control is a sub-field of operations research and this section will describe the theory of the relevant topics connected to this master’s thesis. The underlying cause that drives the need of inventory is often the uncertainties that exist in an inventory system (Axsäter, 2006). This section will begin with a description of the uncertainties and common inventory control terms used and end with describing different theories concerning ordering policies.
3.2.1 Uncertainties and forecasts
The uncertainties can often be grouped in three different groups; customers, internal processes and suppliers (Axsäter, 2006).
Customers
The major uncertainty from customers is demand uncertainty, both in regard to the quantity and at what time the demand will occur. This uncertainty is a problem because there is a lead-time between starting a process and the point at which the goods can be delivered to the customer. Additionally, it is often necessary to order or process goods in batches (Axsäter, 2006). When starting a process the actual need at the point of delivery to the customer is normally unknown. To estimate the demand in advance, several forecasting techniques can be used. The most widely used technique is to base the forecast on historical demand data (Mattsson & Jonsson, 2003). For articles that are solely a component of a final product, the forecast is usually made for the final product and with such forecast a production plan can be determined. The forecasted demand for the component is then derived from the production plan (Axsäter, 2006). Forecasts can also be based on, or adjusted for, other factors, e.g. sales campaigns.
Apart from predicting the demand, it is also important to know how uncertain the forecast is or how much the actual demand varies from the forecast. The deviation is important to know in order to size the safety stock correctly. The deviation is usually measured with the standard deviation. If X is a stochastic variable and m is the mean, the standard deviation σ is defined as (3.1).
(3.1)
It is common to assume that the forecast errors are normally distributed (Axsäter, 2006).
Internal process
There are several measures used to monitor internal production processes. Dal et al. (2000) describes one measure known as Overall equipment efficiency (OEE), which was developed by Nakajima in 1988. How BorgWarner measure its internal production process is described in Section 4.3.1 and later included in the simulation model, Section 6.4.3. OEE is considered to combine two related areas, operations and maintenance, and management of manufacturing equipment and resources. The measure is built up by quantifying six different losses in the process(Dal, et al., 2000), see Table 3.1.
Table 3.1. The OEE losses.
OEE losses
Equipment failure/breakdown Setup and adjustment
Idling and minor stoppage Reduced speed
Reduced yield Quality defects
The first two losses are categorized as downtime losses which reduces the availability of the production process. The availability measure is concerned with the total unscheduled stoppages, setup time and changeovers, and is calculated as (3.2) by dividing (3.3) with (3.4). (3.2) where, (3.3) and
The third and fourth losses are regarded as speed losses and measure the performance efficiency, i.e. the ideal speed compared to the actual speed of the process. See (3.5), and its subcomponents, (3.6) and (3.7).
(3.5) where, (3.6) and (3.7)
The remaining two losses are categorized as quality, which is a measure to quantify the number of defects in relation to the total production volume, see (3.8).
(3.8)
The OEE measure is then calculated by multiplying the three main elements (3.2), (3.5) and (3.8). This gives the OEE, see (3.9).
(3.9)
Many of the uncertainties in a production environment are connected to these different measures; availability, efficiency and quality. For example, the availability
measure takes all unplanned stoppages into account, the performance efficiency considers the actual output and the quality rate includes possible quality problems. Using the OEE measure makes it possible to track the total performance and variations of the internal production process.
Suppliers
The supply process, naturally, has some uncertainties because it is out of the control of the company. In the same way, as with demand uncertainty, the
uncertainty lies in what quantity and at what time a delivery will actually take place. The lead-time uncertainty is one of the uncertainties in the supply process. The lead-time is defined as the time between placing an order and the delivery of that order (Mattsson & Jonsson, 2003). There are two types of stochastic lead-times; sequential deliveries, and independent lead-times. Sequential deliveries cannot cross in time, which means that an order placed after another cannot be delivered before the first order (Axsäter, 2006). This is reasonable to assume if the orders are handled on a first-come, first-served (FIFO) policy. However, there are situations when the orders are handled according to some prioritization that will allow an order that was placed later to pass an earlier placed order. Also if the orders are treated by different servers, they can cross each other.
It is more difficult to model lead-times when orders cannot cross each other, because the lead-time depends on the queue at the supplier, which in turn results from previous orders (Axsäter, 2006). To be able to model this situation, information about the inventory and the queues need to be included. Further on, Axsäter (2006) argues that in reality it is more difficult to evaluate lead-time variation than demand variation, and if the lead-time variation is small enough it can be replaced by its mean value.
3.2.2 Definitions
The following subchapter describe definitions related to inventory control. Cost
The cost factors are not included in the simulation model of this thesis. However, it is important to understand the costs that are related to inventory control in order to understand the effect of different inventory levels, which is highly relevant in this thesis.
One essential difference in terms used, is the difference between inventory position and inventory level. Inventory level is the physical on-hand inventory minus possible backorders, i.e. orders that have been demanded but not yet delivered to the customer, see (3.10). The inventory position also includes outstanding orders, i.e. placed orders that have not yet been delivered, see Definition (3.11) (Axsäter, 2006).
(3.11)
Holding cost is the cost of keeping inventory. The cost is associated with the return of capital that could be given from alternative investments, but also other factors of keeping inventory should be included, for example material handling, obsolescence, insurance and taxes (Mattsson & Jonsson, 2003). All variable costs associated with the inventory level should be included in the holding cost and the holding cost is measured per unit and time. The holding cost exists only for positive inventory levels (Axsäter, 2006).
If the inventory level is negative, i.e. backorders exist, the corresponding cost is called shortage cost (Axsäter, 2006). The cost depends on what happens if the requested demand cannot be delivered. If the customer chooses another supplier, the shortage cost is the cost of lost sales, both current and future. If the customer accepts to wait while the order is backlogged different costs occur, for example extra administration or price discounts. Another example is when material can be bought immediately from another source, at a higher price, and the shortage cost is then the additional cost for buying the material (Axsäter, 2006).
A third cost generally included in theory of inventory control is ordering cost. In the case of ordering goods, ordering cost is the cost of placing a replenishment order. In terms of production, ordering cost is the cost of setting up the production (Axsäter, 2006).
Safety stock and safety time
As described in section 3.2.1 several uncertainties exist within an inventory system. Safety stock is a part of the inventory that is used to compensate for these uncertainties (Lumsden, 2006). Determining the safety stock is related to determining the ordering point (Axsäter, 2006). The reorder point R is equal to the expected demand during the lead-time and the safety stock SS, see (3.12).
(3.12)
The safety stock is not always a quantity unit, it can also be measured in time units (Axsäter, 2006). When the safety stock is time based, an order should be delivered at least one safety period before it is needed. It is common to use safety times when using Material Requirements Planning (MRP) (Axsäter, 2006).
Service levels
Service levels are used to determine a suitable reorder point and order quantity for the system or to evaluate the current ordering policy. This thesis mainly focuses on evaluating the service level of the current inventory system. Axsäter (2006) uses three different measures of service level.
- = = probability of no stockout per order cycle
- = = fraction of demand that can be satisfied immediately from stock on hand, called fill rate
- = = fraction of time with positive stock on hand, called ready rate
is not recommended to use in practice for inventory control because it has some critical disadvantages (Axsäter, 2006). It measures the probability of no shortage during an order cycle. It does not take into account the size of the batch, only what happens after an order is triggered until it is delivered. Fill rate and ready rate represent the true service level better since they also consider the order quantity (Axsäter, 2006). If the demand is either continuous or Poisson distributed, fill rate and ready rate are equivalent. However, if the demand is modeled as a Compound Poisson distribution, where several units may be ordered at the same time, the ready rate can be high if there are only a few units in stock but the fill rate can be low because the stock cannot cover the orders (Axsäter, 2006).
There are more ways to represent the customer service than the use of the three measurements previously presented. It can also be measured in terms of how long waiting time a customer experience or through the usage of shortage costs (Axsäter, 2006). The use of shortage costs can, in a similar way as service level measures, be used to determine a suitable reorder point. Instead of defining the required service level the cost of having backorders is determined. In the empirical chapter (Section 4.9) it is described how BorgWarner has defined their service level and in the model chapter (Section 6.4.3) it is discussed how the service level in the tool should be interpreted.
In practice the pre-determined service level should be based on the actual customer expectations, or if shortage costs are used it should reflect the true costs that occur with backorders (Axsäter, 2006). It is also of importance that the service level used is well defined throughout the company (Axsäter, 2006).
problems. The stock is often kept physically close to the manufacturing facility and all warehousing operations are carried out by the manufacturing company. The setup of keeping a material stock can vary between companies but traditionally a company purchases the stock from a supplier as previously described. An alternative approach is the use of consignment stock, which means that the goods are physically transported to the buyer but the ownership is retained by the supplier until the buyer calls off the material for production. Through this approach the manufacturing company can reduce the risks associated with late deliveries while minimizing the capital tied in inventory (Voss & Woodruff, 2005). 3.2.3 Ordering policies
An inventory control system has a twofold purpose, both to determine when and how much to order. The decision is taken in regard to the current stock situation, anticipated demand and other factors (Axsäter, 2006). The purpose of this section is to give the reader a better understanding of ordering policies to be able to understand the processes at BorgWarner.
Continuous or periodic review
Continuous or periodic review concern how the inventory level and position is monitored. With continuous review the inventory is monitored continuously, which means that as soon as the inventory position gets below a predefined level an order is triggered (Mattsson & Jonsson, 2003). If a periodic review system is used, the inventory position is only checked at predefined intervals. If the inventory position is below the set ordering level, an order is triggered and if the position is above, one waits until the next interval to check whether the position has dropped below (Mattsson & Jonsson, 2003). With the use of periodic review the inventory position can drop below the ordering level if the demand during the last interval has been high. With a periodic review system the inventory position must safeguard against demand variation both over the review interval and the lead-time. Such a system has advantages when the ordering of several products needs to be coordinated. Such systems also result in a lower total operating cost (Axsäter, 2006).
(R, Q) policy
An (R, Q) policy is an ordering policy that orders a predefined batch quantity Q when the inventory position is at the level R or below, see Figure 3.1. If the inventory position is at a level where ordering only Q units will not get the inventory position above R, a multiple of Q will be ordered. Therefore an (R, Q) policy might be called an (R, nQ) policy (Axsäter, 2006).
Figure 3.1. (R, Q) policy with periodic review and continuous demand (Axsäter, 2006).
An ordering policy that is closely related to an (R, Q) policy is a KANBAN policy (Axsäter, 2006). A KANBAN system contains a number (N) of containers each of which has a KANBAN card associated with them. When a container becomes empty, the card is used to trigger the replenishment of Q units (Axsäter, 2006). At all times there are N-1 containers that are either full or have a triggered order associated with them. This corresponds to an (R,Q) policy, , where the order quantity is Q. KANBAN systems are only suited for repetitive manufacturing (Hopp & Spearman, 2000).
(s, S) policy
Another ordering policy is the (s, S) policy. This policy has many similarities with an (R, Q) policy, but also a few significant differences. The reorder point at level s is interpreted in the same way as the reorder point R for an (R, Q) policy. The difference is that an (s, S) policy does not order the same quantity, or a multiple of it, each time. Instead a quantity, S, that increases the inventory position to the fixed level s is ordered, see Figure 3.2 (Axsäter, 2006).
Figure 3.2. (s, S) policy with periodic review and continuous demand (Axsäter, 2006).
Material requirements planning
Both the (R, Q) and the (s, S) policies are based on a static reorder point and the creators of MRP found that this ordering approach was better suited for final products than components (Hopp & Spearman, 2000). Final products have a demand that is triggered outside the company’s system, while components’ demand is dependent of the production of the final products. For this reason the two types should be treated differently (Hopp & Spearman, 2000).
MRP is used to determine when and how much to order of components to satisfy the production and external demand of the final products (Hopp & Spearman, 2000). MRP usually has a periodic review and a rolling planning horizon. The planning procedure is based on the following data and assumptions (Axsäter, 2006).
- A production plan for final products.
- Demand for components that do not originate from the production plan, for example spare parts.
- A BOM for all items specifying all of its immediate components and the quantity needed per parent item.
- Inventory status for all items. - Constant lead-time for all items.