SCHOOL OF SUSTAINABLE DEVELOPMENT OF SOCIETY AND TECHNOLOGY
THESIS FOR MASTER DEGREE IN INTERNATIONAL MARKETING
MASTER THESIS:
ROLE OF GREEN MARKETING IN ENERGY SECTOR OF SWEDEN WITH THE SPECIAL FOCUS ON CONSUMERS
SUPERVISOR: AUTHOR:
TOBIAS ELTEBRANDT 19830419 HIMMET BARAN
EXAMINER: GROUP:2505 OLE LILJEFORS
ACKNOWLEDGMENT
It is not less than an honor to show my deepest gratitude to the supervisor of my thesis, Mr. Tobias Eltebrandt whose guidance and on time support proves a helping hand to make this piece of paper fruitful. He is always besides that to give better perspective of the topic, suggested questions and maintaining and organizing meetings.
I am indebted to my many of my colleagues to elaborate the mistakes or problems in my writing through critical opposition and provide me chance to always up to the mark for my work and should not deviate from the planned track.
I am feeling proud to say that whatever I am today is due to the prayers, total devotion, love and all kinds of support from my parents without their encouragement and shore up I can‟t be able to be at this place and that is the main hub of our inspiration for this work as well.
Last but not least my friends from all around the globe helped a lot in collecting the data, suggesting books turn this dream into reality and due to that I am able to present in a good manner.
ABSTRACT Purpose
The purpose of this study is to describe the importance and role of green energy in the energy sector of Sweden and how it can enhance the possibility of more sales and secondly my purpose is to check the factors which influence consumers to choose any electricity supplier for their home use.
Methodology
In this part I define the procedure through which I do this research; mainly focuses on the questionnaire from different people belong to different groups to analyze the role of green energy. This also includes the literature view and conceptual frame work of academic work to provide more depth to the readers about the subjective topic. The data collection and theory of research is to be presented.
Research Limitations
We can face some practical and ethical issue while access to public‟s information. People can refuse to fill the questionnaire or sometime the data collected may not be reliable. Time limitation is also one of the problems. It is not an easy task to complete the research in 10 weeks which we normally get in masters program. Generally universities use standard agreement but in some cases organization might insist that the university for which a student is writing a dissertation should sign a confidentiality agreement (Fisher 2007, P.64). Even though I have a time of around 10 weeks to complete this task however the wideness of the topic is always the biggest challenge to meet my requirements in this limited time.
Findings and analysis
Findings focuses on the data which is collected through questionnaire and analysis presents through using the previous adopted model on consumer decision process and green marketing strategies for competitive advantage.
Key words
Green Marketing
T AB LE O F C O N T E N T S 1. INTRODUCTION ... 1 2. STRATEGIC QUESTION ... 1 3. RESEARCH QUESTION ... 1 4. CHOICE OF TOPIC ... 2 5. THESIS DESIGN ... 2 6. LITERATURE REVIEW ... 3 7. METHODOLOGY ... 4 7.1 RESEARCH METHODS ... 4
7.2 DATA COLLECTION METHODS ... 4
7.3 PRIMARY DATA ... 5 7.4 QUESTIONNAIRE ... 5 7.5 QUESTIONNAIRE DESIGN ... 5 7.6 DISTRIBUTION OF QUESTIONNAIRE ... 8 7.7 SECONDARY DATA ... 8 7.8 POPULATION ... 8 7.9 RELIABILITY ... 9 7.10 LIMITATION ... 9 8. CONCEPTUAL FRAMEWORK ... 9 8.1 GREEN ENERGY ... 9
8.2 WHY GREEN ENERGY? ... 10
8.3 GREEN ENERGY IN SWEDEN ... 10
8.4 BARRIERS TO GREEN ENERGY PENETRATION ... 11
8.4.1 MARKET FAILURE/ IMPERFECTION ... 12
8.4.2 MARKET DISTORTIONS ... 12
8.4.3 ECONOMIC AND FINANCIAL ... 12
8.4.4 INSTITUTIONAL ... 12
8.4.5 TECHNICAL ... 13
8.4.6 SOCIAL, CULTURAL AND BEHAVIORAL ... 13
8.4.7 OTHER BARRIERS ... 13
9. CONSIDERABLE FACTORS FOR CONSUMERS ... 14
10. FINDINGS ... 16 10.1 NATIONALITIES: ... 16 10.2 GENDER: ... 17 10.3 OCCUPATION... 18 10.4 LIVE IN ... 19 10.5 LOCATION ... 20
10.6 REASON FOR CHOOSING THE SUPPLIER ... 21
10.7 GREEN ELECTRICITY IS PRIORITY OR NOT ... 22
10.8 REASON CHANGING COMPANIES BY CUSTOMER ... 23
10.9 NUMBER OF CHANGES IN SUPPLIER BY CUSTOMER ... 24
10.10 GREEN ELECTRICITY PRICE ... 25
10.11 MARKET SHARE FOR COMPANIES ... 26
10.12 WHY THIS ... 27
10.13 EXTRA PAYMENT FOR RENEWABLE ENERGY ... 28
10.14 INFORMATION ABOUT GREEN ENERGY ... 29
10.15 INCOME ... 30
11. ANALYSIS ... 31
11.1 ANALYIZING GENDER FROM DIFFERENT ASPECT ... 31
11.1.1 GENDER AND WHY CHOOSE ... 31
11.1.2 GENDER AND WHY THIS ... 33
11.1.3 GENDER AND INCOME ... 34
11.1.4 GENDER AND EXTRA PAYMENT FOR RENEWABLE ENERGY ... 35
11.2 ANALYZE OF LIVE IN ... 37
11.2.1 LIVE IN AND NUMBER OF CHANGES IN SUPLLIER... 37
11.2.2 LIVE IN AND REASON FOR CHOOSING CURRENT SUPPLIER ... 38
11.2.3. LIVE IN AND INCOME ... 39
11.3 OCCUPATION... 41
11.3.1 OCCUPATION AND WHY CHOOSE ... 41
11.3.2 OCCUPATION AND EXTRA ... 43
11.3.3 OCUPATION AND WHY THIS ... 45
11.4 WHY CHOOSE AND GREEN RPICE ... 47
11.5 INFORMATION ABOUT GREEN ENERGY AND EXTRAPAYMENT FOR RENEWABLE ENERGY ... 49
11.6 INCOME AND WHY CHOOSE... 51
12. CONCLUSION AND SUGGESTION ... 54
13. REFERENCES ... 56
TABLE AND FIGURES
FIGUR 1: ADOPTED CONSUMER DECISION PROCESS MODEL BY AUTHOR ... 15
FIGUR 2: NATIONALITIES ... 16
FIGUR 3: GENDER ... 17
FIGUR 4: OCCUPATION ... 18
FIGUR 5: LIVE IN ... 19
FIGUR 6: LOCATION ... 20
FIGUR 7: MAIN REASON FOR CHOOSING THE SUPPLIER ... 21
FIGUR 8: GREEN ELECTRICITY IS PRIOR OR NOT ... 22
FIGUR 9: REASON CHANGING THE COMPANY BY CUSTOMER ... 23
FIGUR 10: NUMBER OF CHANGE THE SUPPLIER BY CUSTOMER ... 24
FIGUR 11: GREEN ELECTRICITY PRICE ... 25
FIGUR 12: MARKET SHARES FOR COMPANIES ... 26
FIGUR 13: WHY THIS ... 27
FIGUR 14: EXTRA ... 28
FIGUR 15: INFORMATION ABOUT GREEN ELECTRICITY ... 29
FIGUR 16: INCOME ... 30
FIGUR 17: GENDER AND WHY CHOOSE ... 31
FIGUR 18:GENDER AND WHY THIS... 33
FIGUR 19: GENDER AND INCOME ... 34
FIGUR 20: GENDER AND WILLIGNESS TO PAY EXTRA ... 36
FIGUR 21: LIVE IN AND NUMBER OF CHANGES IN SUPLLIER ... 37
FIGUR 22: LIVE IN AND REASON FOR CHOOSING CURRENT SUPPLIER ... 38
FIGUR 23: LIVE IN AND INCOME ... 39
FIGUR 24 :OCCUPATION AND WHY CHOOSE ... 41
FIGUR 25:EXTRA AND OCCUPATION ... 43
FIGUR 26: WHY THIS AND OCCUPATION ... 45
FIGUR 27: GREEN PRICE AND WHY CHOOSE ... 47
FIGUR 28: INFORMATION AND EXTRA PAYMENT FOR RENEWABLE ENERGY ... 49
1
1. INTRODUCTION
This chapter begins with the general overview of the research area and it further includes the problem statement, purpose, research question and structure of the thesis.
Although there are different opinions exist in regards of greatest invention but according to a survey conducted by BBC, UK it has been observed that every human being is in favor of electricity (www.bbc.co.uk, n.d). So there is no ambiguity if we say that electricity is the biggest invention on the planet. Simply start looking from the minor things at our home (electric bulb) to the major things (heavy industrial machines and main frame computers) which make our life meaningful and convert our dreams into reality. As no one can imagine that without the presence of this useful invention we cannot use all that machines and also all the development was not possible and we might still spending our life like the stone ages. With the passage of time development in energy and electricity sector increases and reaches to a level from where it started effecting the overall environment and becomes hazardous for the habitants of the society and also a lot of resources have to use to generate electricity. So government agencies and environmental friendly organizations took the bold step to emphasize on the importance of energy saving and environmental friendly electric products and especially developed countries took the initiative to explore certain areas which can sufficiently produce energy without damaging the society and environment.
So I work on the concept of green marketing which is very attractive now a days and I expand my area of research by looking at the effects on sales on this kind of marketing and I also include consumer attitude towards deciding about the electricity supplier and which factors they specially focus before choosing it.
2. STRATEGIC QUESTION
Does green energy have a substantial role in the energy sector?3. RESEARCH QUESTION
Which factors (price, service, availability and environmental friendly) are the most powerful effect on the customer `s choice of electricity supplier?
2
4. CHOICE OF TOPIC
I try to elaborate the importance of green marketing in the energy sector, how it can be useful for the sufficient increase in sales for the energy producing companies in Sweden and how it influences the consumers to think about it before actually finalizing any supplier for their electricity provider.
As Sweden is the country where people can choose about their electricity provider rather than many developing countries where only a single electricity provider is working with the monopoly of government and people do not have any option to think about any other company and they are helpless of choosing any other good supplier in terms of facilities, price and environment friendly. One of the worst example of this is Pakistan now a days where people have to bear load shedding of 10 to 20 hours a day because government has not taken any step to introduce other private suppliers and create a competition among the suppliers of energy market, which results in the better product in cheaper price. Even though I am conducting this research in the Swedish market but it can also be useful for the developing countries as well to think about it in two ways.
Different supplier of energy or electricity
Renewable energy sources with a minimum of detrimental impact on environment So it can be a good opportunity to do my thesis on this topic where I can analyze some companies in terms of the preferences of customer in consideration of the supplying green energy. How they present their offerings and what marketing strategies and especially green marketing can increase the ratio of sales. On the other hand I am curious to know that what are the important steps that people consider before actually choosing any company, is it the matter of price, better services or they also think about the environment as well. So these are the reasons which lead me to work on this topic.
5. THESIS DESIGN
The structure of the thesis is principally focused on six chapters which include;
Introduction; which elaborate the brief overview of the research topic regarding green marketing, impact on sales and consumer behaviors.
Methodology; which will cover the methods that I will use to conduct this report, sources for collection of information and limitation of the study if any.
3 Conceptual Framework; this will include the summarize details of many important theories, articles, books and other publications to know better what exactly already done in this area and next is necessary to do.
Finding; answers that I get from questionnaires and interview details of some customers about the subject.
Analysis; which will focus on discourse analysis based on the findings.
Conclusion and suggestion; it will emerge due to the comparison between finding and analysis, which leads to a concluding statement about the problem that have indentified in the beginning. Recommendation is based on the results, there will be some recommendation for the future research in the respective field.
6. LITERATURE REVIEW
In this section I give an overview of the related theories and researches to give an idea about our area of research.
I use various theories and research papers for my research. Beside this I use the work of Phil
Shepley (Shepley, 2010), L. Bird (L. Bird, 2002) and Painuly (Painuly, 2000) on green
energy. In addition I use various research articles of Ryan H. Wiser on green energy marketing. These research articles and theories give me a brief introduction and up to dated knowledge about the green energy marketing. (Wiser R. , 2000) As I am studying only the Swedish market, there is a very good study about energy usage in Sweden. Schippers has done this research in which he has shown the energy usage trends n the Swedish market. Although the research was done in 1990‟s, but it still has the potential to guide me. Moreover it gives me some important information and guideline about the energy usage trends in the Swedish market (L. Schipper, 1993).
Jay Zarnikau has done some very good work on consumer‟s attitude about green marketing. I
use his research to understand some important aspects of consumer‟s attitude towards green marketing (Zarnikau, 2003).
4 Although in my research I get primary data and then analyze that data to get the answer to my problem, but I also use some models to guide me throughout the completion of my research. I use Fuller’s “The Consumer’s Decision Process Model”. I modify this model according to my research. I add the factors that I want to study in my research. I add those factors to see their affect on the consumer‟s decision making (Fuller, 1999).
7. METHODOLOGY
This part includes the information about how I conduct the research; firstly I have covered the concept of quantitative research, secondly I focus on the data collection methods followed by reliability and limitations during the tenure of research.
7.1 RESEARCH METHODS
According to Colin Fisher, there are two different kinds of research methods; quantitative method deals with numbers and uses statistical tools to get the result while qualitative research methods emphasis on in depth information to reach the conclusion by focusing on words (Fisher, P 62).
In the above research, there is approximately a ratio of 70-30% change it between quantitative and qualitative research respectively because major portion of my findings are dependent upon questionnaire which I circulated among different sort of people.
7.2 DATA COLLECTION METHODS
Data collection is the simple method when planning research study process and it helps to evaluate our process. In this process the important thing is whether data collector reach to the useful data rather than how to collect data.
In general there are two types of data collection used for any research; primary and secondary and in this study both have been utilized to reach to the maximum level of satisfaction.
5
7.3 PRIMARY DATA
Through interviews and questionnaires it could be collected a primary data set. The most important features of primary data set is that it belongs to you and specified for your research question, since the study is mainly composed of quantitative and primary data, which is collected through questionnaire; which was mainly distributed to those people who pays for their bills and I deliberately decided to not to involve students in it because students are normally living in student apartment where they don‟t have to pay separate bills for their electricity and I will distribute the questionnaires in Stockholm.
7.4 QUESTIONNAIRE
One of the popular data collection methods is the questionnaire which is quite difficult to design. There are some advantages to use questionnaire as data collection method. First of all it could be cheaper in the comparison of the other data collection methods. Data collector don‟t need to prior arrangement before going to responders. Furthermore it provides enough time to respondents to think about the question which is good for the reliability of the result. In this study the questionnaire that will be presented in Swedish only, although English version will also available but to minimize the confusion among different answers for same type of questions we will present the questionnaire in Swedish.
According to the guidelines in Fisher (2007), regarding the choice of questionnaire format, I include the following Questionnaire formats.
Dichotomous Questions Multiple Choice Question Checklists
Open Questions
7.5 QUESTIONNAIRE DESIGN
In my questionnaire I use eleven parts which are consistent to each other and all these parts try to grab respondents‟ attention which makes it easy to reach to my target group who pays
6 their electric bills and who cares of the production in terms of the environmental friendly energy.
Part 1 Background:
In this part I try to get information about the respondents` nationality, gender, occupation, living in and electricity supplier`s names. Based on this background information I can reach to the information of number of gender, respondent`s occupation and where respondents live in, house or apartment.
Part2
Actual Electricity Supplier:
In this section I try to learn about respondents‟ main reason for choosing their current electricity supplier in terms of the price, service or environmental friendly production and whether they are aware of the green energy.
Part 3
Quality and satisfaction
With this part I try to get information about whether respondents satisfy with the services in the consideration of what they pay for electricity.
Part 4 Trust
In this part I try to get information about respondent‟s confidence to their current electricity supplier and whether they count their electricity bills or not.
Part 5 Commitment
With this part I try to get information about respondents‟ willingness to change their current electricity supplier.
7 Part 6
Price perception
Under this section I try to get data about how respondents percepts their current electricity supplier price in terms of comparison with other electricity supplier.
Part 7
Attitude toward switching
Data is tried to collect about what are respondents thinking about changing their electricity supplier and whether green electricity price high, low or same price?
Part 8 Subjective norms
In this part I try to get data about what are respondents thinking about change in electricity supplier by other people in the same area.
Part 9 Past behavior:
In this part the question is asked to learn about the how many times respondent has been changed their electricity supplier.
Part 10 Switching intentions:
In this part the question is asked about the intentions of the respondents to change their electricity supplier.
Part 11 New energy market
In this section I try to collect data about whether respondents got information about renewable energy and how much they are willing to pay extra money for renewable energy, what is main reason for choosing certain electricity provider and respondents income level.
8
7.6 DISTRIBUTION OF QUESTIONNAIRE
I had plenty of options in my mind to circulate the questionnaire among different regions and different class of people. There are many way to get answer from people when in their available time. I distributed questionnaire in Stockholm. My main target group is who pays their electricity bill and I distributed questionnaire in a train because the people are usually free when they are using the train for commuting or for any other reasons, I distributed in the morning hours to reach employed people as a target group who pays their energy bill themselves. Another way to get answer is distributing of the questionnaire in the train station. It is very good place to collect data because when people are waiting their train they usually have a time and finally the other way which I used to collect the data is distributing of questionnaire in a restaurant or a coffee, when people are waiting their meal or their beverage they give the attention to fill in questionnaire.
7.7 SECONDARY DATA
All data collection method can be done through quantitative data which apply to numbers or statistics and it could be presented in the graphical form and the other data collection method is qualitative data which applies generally words. As a contrary to primary data, Secondary data is data which has been collected from different people for any reason and will be
gathered through paper based sources such as books, journals, reports, annual, newspaper and magazines. Electronic sources are internet, online database and broadcasts. Beside these source, official and unofficial, government or general business sources can be given as secondary data sources. Finally international sources Organization for Economic Co-operation and Development (OECD) is given as other secondary data collection method (Thames valley university, 2005).
7.8 POPULATION
In this research my main population is the habitants of Stockholm. Even though Västerås and Eskilstuna had been written in the questionnaire, I used these two cities and different cities under the other cities title. Since I have been doing the questionnaire part individual number of the sample group was formed as 200.
9
7.9 RELIABILITY
Since I mentioned before the first hand data collection has advantage to give time to the respondents to consider about their responses, when I am distributing the questionnaire in the place where the people have plenty time to consider. For the purpose of reliability is highly subject in this survey; several checks have been included in the questionnaires to insure the reliability but as it is purely dependent upon the respondent of different backgrounds, time and situation. So one of the major steps that I will take; is to ensure the presence of any researcher.
7.10 LIMITATION
Although I have a time around 10 weeks to complete this task but the wideness of the topic and establishing links with the corporate sector time is always the biggest challenge to meet my requirements. For this reason I might have to narrow my theme and have to focus on the major part. However as I started thinking about this topic so I am sure that I will cover it in a good sense and produce a result oriented paper within the given span of time.
8. CONCEPTUAL FRAMEWORK
This section covers the concepts, understanding and theories which are related to academic work and which I use in different parts of my research.
8.1 GREEN ENERGY
Green energy is the energy that is produced in such a way that its production has the least negative impact on the environment. The energy sources in use like fossil fuels have very negative effect on the environment. Solar energy, wind energy, hydro energy and geothermal energy are some examples of the green energy. Every method of energy collection creates pollution, but the purpose of the green energy is to create energy with as little pollution as possible. Cleaning up the present fossil fuels so that more clean energy is produced is also one purpose of green energy (Shepley, 2010). The green energy products are generally 100 per
10 cent renewable energy offerings which are prepared either from many sources, or only one source, like hydro or solar or wind energy (L. Bird, 2002).
As the public awareness about environmental issues is increasing, the usage of green energy is also increasing. Renewable energy sources provided almost 20% of total world energy demand in 2000, and will fulfill 90% of total primary energy demand in 2020 (Painuly, 2000).
8.2 WHY GREEN ENERGY?
According to David P. Chynoweth, John M. Owens and Robert Legrand, the recent emphasize for green or renewable energy is related to global environmental quality. The combustion of fossil fuels releases toxic compounds like oxides of nitrogen and sulfur. These pollutants cause health and environmental problems globally, the most dangerous of which is global warming caused by increasing concentrations of carbon dioxide. For example, the use of renewable biomass as a source of energy is not only greener but also creates closed balanced carbon cycle with respect to atmospheric carbon dioxide. Another concern is the need for treatment and disposal of large quantities of organic wastes. These wastes are not only environmental threat but are also potential renewable energy resource (David P. Chynoweth, 2000).
The increasing population of the globe and the limited quantity of fossil fuels also make it necessary for us to move to renewable energy resources as soon as possible. This will help us in sustaining our species on the planet in a way that is compatible for the preservation of the biosphere (David P. Chynoweth, 2000).
In the present, If the energy situation which is consumed as much as rich world does and needed by the Third World, as much as rich world does turns to be more problematic. Assuming the future world populations in 2070 was to be 9 billion. This leads that all sorts of energy resources would be last about 20 years (Trainer, 1985).
8.3 GREEN ENERGY IN SWEDEN
When Sweden national long term energy policy adopted at the end of 70s it pointed that national energy should be based on domestic and renewable energy source with minimum effect on the environment, the program has been improved over years. After as a consequence
11 of this new program the Swedish electricity market reform came out January 1 1996. A bright separation has been made between production and trade in electricity. Network operators are regulated and become natural monopolies. Network operator task is to distribute electricity at a reasonable cost without regarding who is producer or customer (Leckström, 1997).
Today there are more than 50 companies offering green power options to electricity consumers in Sweden. Most of the companies produce their own green power but there are some companies that purchase green power and resell it to their customers. Green power sales increased about 32% in 2000 and contributed to 6% of the total electricity sales in Sweden. The average price premium in 2000 it was almost 1.4 öre/KWH, which was about 8-10% premium over the cost of electricity for commercial and industrial users (L. Bird, 2002). Green marketing has the advantage of customer‟s willingness to purchase and many times pay higher for the product. The product has the benefit that consumers think it good for their environment and health.
The marketer should take care of some very important points while marketing green energy. Green power programs will be more successful when they appeal to the sense of the community. It means that community based marketing techniques should be used. The collective harm messages like everybody should work to protect the environment should be used (Granzin and Olsen, 1991). This means that local subsidiaries can be more successful than multinational power organizations, for green power. The marketing messages should be targeted to the most suitable social norms (Ottman, 1993).
8.4 BARRIERS TO GREEN ENERGY PENETRATION
In this article “Barriers to renewable energy penetration; a framework for analysis”, J.P. Painuly, says that green energy has the potential to provide clean energy with sustainability to billions of people in developing countries. Although green energy has so much potential but even then it is unable to penetrate in the developing countries. The barriers in the penetration of green energy in the developing countries is categorized such as; market failure, market distortions, economic and financial, institutional, technical, social and cultural (Painuly, 2000).
12 8.4.1 MARKET FAILURE/ IMPERFECTION
These barriers may be due to lack of investments in green energy, lack of information and awareness, restricted access to technology, lack of competition, missing market infrastructure and/or high investment requirements.
8.4.2 MARKET DISTORTIONS
This barrier category can be defined as favor (such as subsidies) to conventional energy, taxes on green or renewable energy and trade barriers. The result of barriers can be a disadvantage relative to other energy forms and can be implemented in terms of economical, regulatory or institutional manner such as high initial and transactional cost, poor market conditions, risks and uncertainties, lack of information etc. Barriers may be country or situation based. Market distortions simply mean a separation and distinction between renewable and other forms of energy.
8.4.3 ECONOMIC AND FINANCIAL
These barriers may be because the green energy might be economically not feasible or there might be lack of financial institutions to support green energy. A common idea that renewable energy cost more is ambiguous one since it depends on the comparison. For example in terms of public subsidies renewable energy has lower cost than fuels. Another example is initial capital cost which is supposed to be higher for renewable energy. Yet, when we consider life cycle, which includes future fuel cost, operation and maintained costs, and equipment lifetime, renewable energy has a lower initial cost compare to other forms of energy. (Beck & Martinot, 2004).
8.4.4 INSTITUTIONAL
These barriers may be due to lack of a legal/regulatory framework to support green or renewable energy, unstable economic environment, lack of involvement of stakeholders in decision making, lack of R&D culture, lack of private sector and lack of professional institutions. In terms of legal framework, it is a fact that electricity production and distribution is controlled by a monopoly in most of the countries. Due to this fact, possible power producers cannot produce and sell power to the third parties. Therefore it is important to have
13 those regulatory rules and incentives which could be simple to overcome as an institutional barrier (Beck & Martinot, 2004).
8.4.5 TECHNICAL
These barriers may be due to lack of standard and codes, lack of skilled persons and/or lack of entrepreneurs. Markets failure is not the case when everyone can access to good information with low cost and the necessary skills. But in specific markets, lack of skilled personnel who may operate and maintain renewable energy can be problematic. Furthermore for project developers lack of sufficient financial, technical skills might be problem. The lack of skills and information may increase perceived uncertainties and block decisions (Beck & Martinot, 2004).
8.4.6 SOCIAL, CULTURAL AND BEHAVIORAL
These barriers may be due to the lack of acceptance of the green electricity by the society or the consumers. With a little experience with them new technologies perceived as costly and risky even though they are proven as cost effective and less riskier. This perception towards renewable energy is known lack of utility acceptance.
8.4.7 OTHER BARRIERS
Other barriers may be uncertain policies by the government or lack of infrastructure needed for the production of green electricity (Painuly, 2000). However a variety of policies are used to build and maintain this “market infrastructure,” including policies for design standards, and equipment standards, and contractor education and licensing. Additionally, policies to induce renewable technology manufactures to site locally, and direct sales of renewable systems to customers at concessionary rates facilitate market development (Beck & Martinot, 2004).
14
9. CONSIDERABLE FACTORS FOR CONSUMERS
There are numerous factors which consumer considers before choosing electricity and besides that it is not only in electricity sector infect it is our normal habit to think before actually buying or adopting anything and in the electricity this thing becomes more important because we can‟t see the product which we are about to buy other than the glowing of tube light or using any machinery.
In the late 90s, many European countries changed the way of supplying electricity and allowed households to choose the supplier of electricity by their own, even though Sweden has introduced the green energy concept in 1996 but this behavioral change of changing electricity supplier has been increased during the last two years (Söderholm, 2008).
Fuller (1999) has suggested that purchase decision of consumer help the marketers to propose the marketing mix for the achievement of sustainability targets and provide the criteria that the product system must be “compatible with ecosystems”. Fuller (1999) further stated that
“Customers must learn to base their purchase decision not only on how well products satisfy individual needs but also on how these products affect the natural environment”.
So I have decided to take the help from the model suggested by Fuller (1999) about the purchase decision that what are the steps involved which actually consumers think before deciding anything. But as I have some specific factors on which I want to emphasis so I will change the model a little bit according to my requirement and need.
The process begins with the stimulation of a need where the consumer is faced with an imbalance between the actual and desired states of a need, which may be sufficiently large to stimulate search.
I may add couple of things at the stage of information search and then purchase process or the final decision has been made and I can neglect the post purchase behaviour as well, because our research includes the factors which influence consumers not what is good or effective in longer run as well. So my final model looks like;
15 FIGUR 1: ADOPTED CONSUMER DECISION PROCESS MODEL BY AUTHOR
When consumer identifies their needs then they search for information about the various alternatives which are available to satisfy their needs. In this information search process consumer may get set of alternatives. On the other hand brand is another way to get the information about the product and separate good from similar. The consumer will use the information stored in memory and those obtained from outside sources to develop a set of criteria. These criteria will help the consumer evaluate and compare alternatives which overlaps with customer needs. Purchase is made based on the chosen alternative (Thomson & Yeong, 2001). In the following parts interaction of the factors on customer choice will be given briefly.
16
10. FINDINGS
I surveyed with 193 people to find out the importance and role of green electricity in the energy sector of Sweden and what are the important factors which influence consumers to choose any electricity supplier for their home use. You can find detailed information about the occupation, gender, nationality, live in, location, main reason for choosing electricity supplier and income.
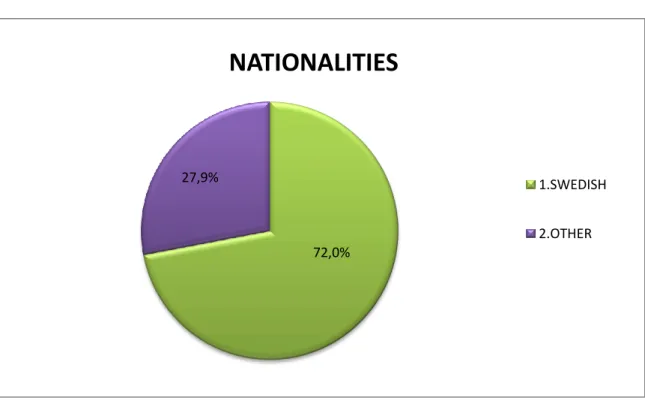
10.1 NATIONALITIES:
FIGUR 2: NATIONALITIES
According to my data which is applied to 193 respondents and as seen in the figure 2, 72.0% of the respondents are Swedish and 27.9% are other nationality.
72,0% 27,9%
NATIONALITIES
1.SWEDISH 2.OTHER
17
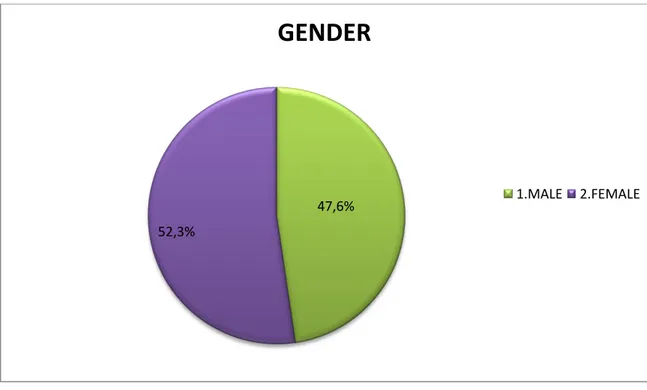
10.2 GENDER:
FIGUR 3: GENDER
As seen in the figure 3, 52.3% of the respondents who participated to my survey are female and 47.6% of respondents are male.
47,6% 52,3%
GENDER
18
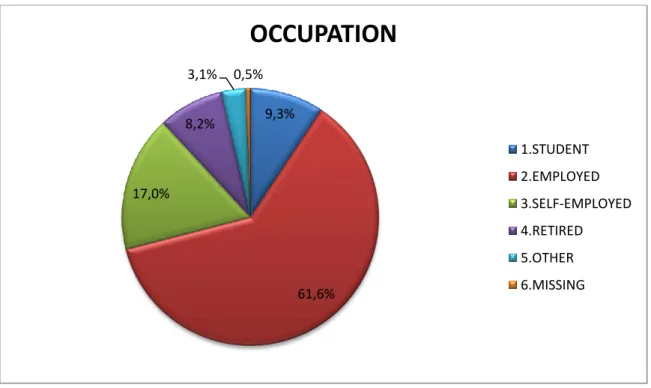
10.3 OCCUPATION
FIGUR 4: OCCUPATION
In this section I to analyze the respondents` occupation. It is formed in five parts and can be given as student, employed, self-employed, retired and other. As it was mentioned before students are not main target group but in this survey student pays their electricity bills themselves. The majority of the respondent takes place in the employed section with 61.6%. Moreover 17.0% of respondents are self-employed, 9.3% of respondents are student and 8.2% respondents are retired. 3.1% of respondents cited that their occupation as other and 0.5% didn‟t answer for this question.
9,3% 61,6% 17,0% 8,2% 3,1% 0,5%
OCCUPATION
1.STUDENT 2.EMPLOYED 3.SELF-EMPLOYED 4.RETIRED 5.OTHER 6.MISSING19
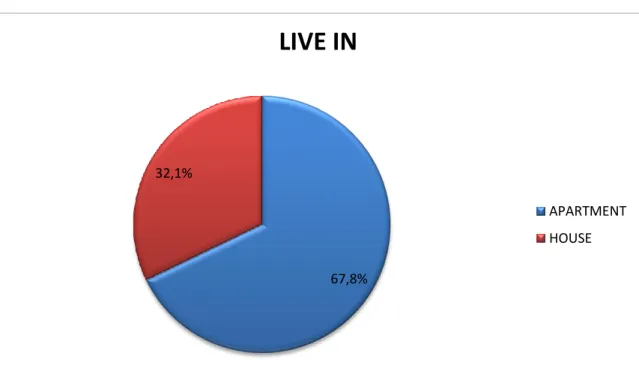
10.4 LIVE IN
FIGUR 5: LIVE IN
In the survey the question were asked to learn where respondents live in? The majority of the respondents live in apartment with rate 67.8% and 32.1% of respondents live in the house.
67,8% 32,1%
LIVE IN
APARTMENT HOUSE
20
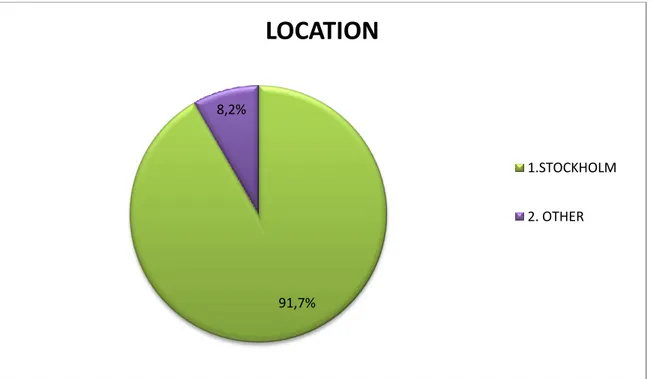
10.5 LOCATION
FIGUR 6: LOCATION
Out of the 193 respondents the majority of them live in Stockholm. 91.7% of respondents live in Stockholm. In the questionnaire there is a question to choice Västerås and Eskilstuna but in my survey as I did in Stockholm I took these two cities under the others part 8.2% of the respondents live outside the Stockholm.
91,7% 8,2%
LOCATION
1.STOCKHOLM 2. OTHER21
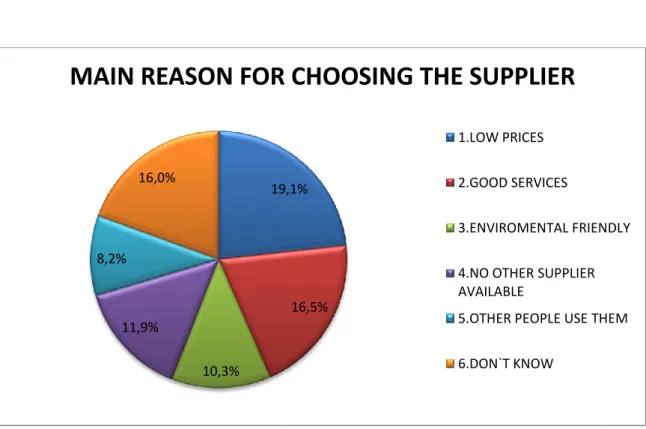
10.6 REASON FOR CHOOSING THE SUPPLIER
FIGUR 7: MAIN REASON FOR CHOOSING THE SUPPLIER
In the survey the question what is main reason for choosing electricity supplier were asked to respondents and 19.1% of respondents answered they chose the electricity supplier due to low price. Secondly the main idea for choosing is good service with 16.5%. The respondents pay attention and take into account whether electricity supplier provide good service. 10.3% of respondents chose the electricity supplier because of the reason of environmentally friendly. 11.9% of respondents chose the company due to there is no other supplier available. 8.2% of respondents are affected by other people in their decision and they chose this company as electricity supplier because of other people use it. 16.0% of respondent didn‟t answer to this question. 19,1% 16,5% 10,3% 11,9% 8,2% 16,0%
MAIN REASON FOR CHOOSING THE SUPPLIER
1.LOW PRICES 2.GOOD SERVICES
3.ENVIROMENTAL FRIENDLY 4.NO OTHER SUPPLIER AVAILABLE
5.OTHER PEOPLE USE THEM 6.DON`T KNOW
22
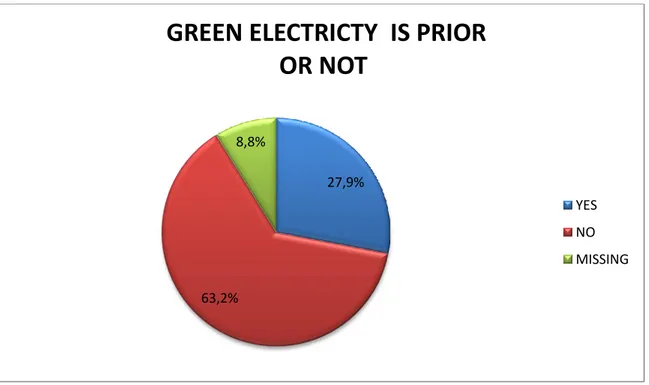
10.7 GREEN ELECTRICITY IS PRIORITY OR NOT
FIGUR 8: GREEN ELECTRICITY IS PRIOR OR NOT
In the survey the respondents answered the question whether the green energy is prior or not. 27.9% of respondents said that green eenrgy is prior for them and contrary 63.2% of them said that it is not prior for them. Beside these 8.8% of respondents didn‟t answer this question.
27,9%
63,2% 8,8%
GREEN ELECTRICTY IS PRIOR
OR NOT
YES NO MISSING
23
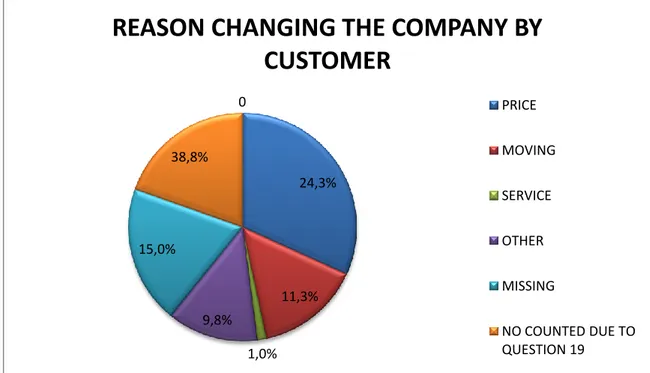
10.8 REASON CHANGING COMPANIES BY CUSTOMER
FIGUR 9: REASON CHANGING THE COMPANY BY CUSTOMER
In this section I try to learn why respondents did change their electricity supplier. 24.3 % of the respondents answered that the main reason was price for changing their electricity supplier before their current supplier. 11.3 % of responders had changed their electricity supplier due to moving the different city, area, house, and apartment or for any other reason. 1.0 % of respondents changed the electricity supplier to get a better service and 9.8% of respondents changed for other reasons. 15.0% of respondents didn‟t fill in this question. 38.8 % is no counted part due to pervious question which is who didn‟t change their electricity supplier before. 24,3% 11,3% 1,0% 9,8% 15,0% 38,8% 0
REASON CHANGING THE COMPANY BY
CUSTOMER
PRICE MOVING SERVICE OTHER MISSING NO COUNTED DUE TO QUESTION 1924
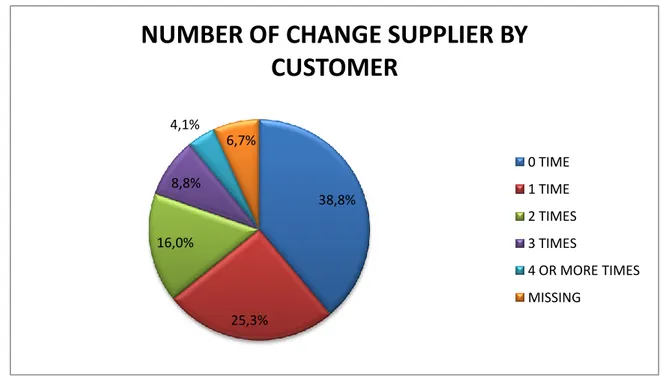
10.9 NUMBER OF CHANGES IN SUPPLIER BY CUSTOMER
FIGUR 10: NUMBER OF CHANGE THE SUPPLIER BY CUSTOMER
According to the data, 38.8% of respondents didn‟t change their current electricity supplier. 25.3% of respondents changed 1 time. 16.0% and 8.8% of respondents changed their electricity supplier for any reasons 2 and 3 times respectively. 4.1% of respondents had changed 4 or more times. 6.7% of respondents didn‟t answer to this question.
38,8% 25,3% 16,0% 8,8% 4,1% 6,7%
NUMBER OF CHANGE SUPPLIER BY
CUSTOMER
0 TIME 1 TIME 2 TIMES 3 TIMES 4 OR MORE TIMES MISSING25
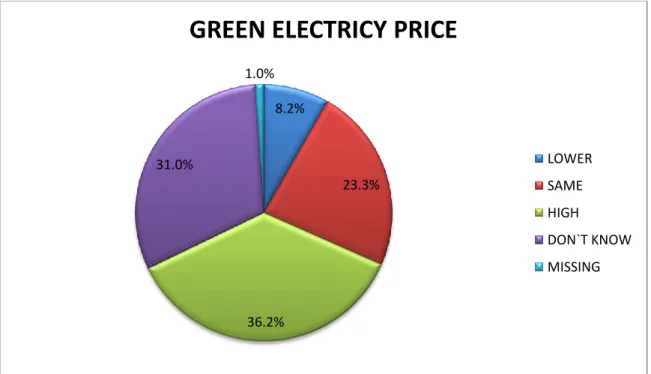
10.10 GREEN ELECTRICITY PRICE
FIGUR 11: GREEN ELECTRICITY PRICE
In the survey the question were asked what respondents are thinking about the green electricity price. 8.2% of respondents are thinking that it could be cheaper than standard electricity and 23.3% of respondents are thinking that it might be same price. 36.2% of respondents are thinking green electricity price is higher than standard electricity. 31.0% of respondents have no idea about it and 1.0% of respondents didn‟t answer this question.
8.2% 23.3% 36.2% 31.0% 1.0%
GREEN ELECTRICY PRICE
LOWER SAME HIGH
DON`T KNOW MISSING
26
10.11 MARKET SHARE FOR COMPANIES
FIGUR 12: MARKET SHARES FOR COMPANIES
The collected data shows which company is currently being used by customer. 35.7 % of respondents are using the Vatten Fall and 19.1% respondents are using Fortum. 11.3% of respondents are using Sollentuna Energy and 4.1% of respondents are using God El. E On takes over the 3.6% in the market and 16.5% of respondents are using the other electricity supplier and 9.3% are respondents didn‟t answer to this question.
35.7% 19.1% 11.3% 4.1% 3.6% 16.5% 9.3%
MARKET SHARES FOR COMPANIES
VATTEN FALL FORTUM SOLLENTUNA ENERGY GOD EL E ON OTHER MISSING
27
10.12 WHY THIS
FIGUR 13: WHY THIS
The question asked to learn why did respondents choose this electricity supplier? 21.2% of respondents answered that they chose the current electricity supplier for social responsibility reason. 51.8% of respondents chose electricity supplier in terms of low price. 8.8% of respondents chose the electricity supplier because of the innovation and 11.9% of respondents chose their electricity supplier due to the greenest product which the supplier produce or provide the customer. 6.2% of respondents didn‟t answer this question.
21,2% 51,8% 8,8% 11,9% 6,2%
WHY THIS
SOCIAL RESPONSIBLE LOW PRICE INNOVATIONS GREENEST PRODUCTS MISSING28
10.13 EXTRA PAYMENT FOR RENEWABLE ENERGY
FIGUR 14: EXTRA
The question was asked to learn about whether respondents are willing to pay extra money for renewable energy. According to collected data 30.0% of respondents are not willing to pay extra money for renewable energy. 20.7% of respondents said that they can pay between 1-100kr and 8.8% of respondents could pay between 101-300kr. 7.2% of respondents could pay between 301-500kr. 5.1% of respondents said that they are willing to pay extra money for renewable energy more than 501kr and 2.5%of respondents didn‟t answer to this question.
30,0% 20,7% 8,8% 7,2% 5,1% 2,5%
EXTRA
0KR 1-100kr 101-300kr 301-500kr MORE THAN 501KR MISSING29
10.14 INFORMATION ABOUT GREEN ENERGY
FIGUR 15: INFORMATION ABOUT GREEN ELECTRICITY
Question was asked to learn whether respondents get information about green electricity or not. The collected data showed that 21.7% of respondents got information about the green electricity. 33.1% of respondents were uncertain and 43.0% of respondents didn‟t get any information about green electricity. Beside these 2.0% of respondents didn‟t fill this question in. 21,7% 33,1% 43,0% 2,0%
INFORMATION ABOUT GREEN ELECTRICITY
YES UNCERTAIN NO
30
10.15 INCOME
FIGUR 16: INCOME
Question was asked about the respondents` income level. 5.6% of respondents said that they earn less than 10 000kr and 19.6% of respondents earn between 10 000-20 000kr. 28.4% of respondents earn between 20 30 000kr and 15.5% of respondents earn between 30 001-40 000kr. 19.1% of respondents earn between 001-40 001-60 000kr and 6.7% of respondents earn between 60 001-80 000kr. Very small part of responders earn more than 80 001kr with rate 2.5%. For this question 2.0% of respondents didn‟t answer.
5,6% 19,6% 28,4% 15,5% 19,1% 6,7% 2,5% 2,0%
INCOME
LESS THAN10 000KR 10 000-20 000KR 20 001-30 000KR 30 001-40 000KR 40 001-60 000KR 60-001-80 000KR MORE THAN 80 001 MISSING31
11. ANALYSIS
In this analyze section I mainly focus on the some variables which interacts between gender, live in, occupation, income, why this company and why choose. In the first part I deal with the genders interaction between respondents` main reason for choosing current electricity supplier, why respondents choose the curtain electricity provider and income and willingness to pay extra money for the renewable energy.
11.1 ANALYIZING GENDER FROM DIFFERENT ASPECT
11.1.1 GENDER AND WHY CHOOSE
FIGUR 17: GENDER AND WHY CHOOSE FEMALE
As seen in the figure 17; female respondents are more sensible for social responsibility in the comparison of the male. 13.0% of female respondents are taking social responsibility in consideration when they are choosing their curtain electricity provider. 27.7% of female respondents think low price is priority when they are choosing curtain electricity provider and 4.8% of female respondents think innovation is prior for them. 6.5% of female respondents
Male Female Social responsible 0 9,20% 13,00% Low price 0 27,70% 27,70% Innovation 0 4,30% 4,80% Green product 0 5,90% 6,50% 0 0,05 0,1 0,15 0,2 0,25 0,3
32 think greenest product is most important factor when they are choosing the curtain electricity provider. 0.5% of female respondents didn‟t answer to this question. This figure shows that which factor is most powerful on female respondents on their choice when they are choosing electricity supplier.
MALE
According to the 9.2 % of male responders, social responsibility is prior when they are choosing curtain electricity provider. 27.7 % of male respondents think low price is most important reason. Moreover 4.3% and 5.9% of male respondents think that innovation and greenest products are prior when they are curtain electricity provider respectively.
As seen in the figure respondents without noticing the sex are more price sensible then other factors when they are choosing their curtain electricity provider. In the figure it can be seen there is big gap between price and any other second reason. Price undertakes 55.5% in total and the other factors can count in small part in the customer choosing process. Social responsibility and greenest products follows the low price reason. From this angle, it can be said that male and female are taking care of environment for the next generations. In this point, respondents can choose the curtain electricity provider as long as companies provide reasonable price and more environmentally friendly products.
33 11.1.2 GENDER AND WHY THIS
According to collected data respondents main reason when they are choosing current supplier I encountered the main reason is low price. Analyze of the gender can be given as:
FEMALE
10.8% of the female respondents answered that they choose their current electricity supplier because of the low price. Secondly, 7.2% of female respondents said that the reason is good service and again at the same rate the respondents answered that no other supplier is available. 4.1% of female respondents stressed that the environmental friendly is affecting factor when they are choosing their current electricity supplier. 3.6% of female respondent choose the electricity supplier because of the other people use that company as well. 9.3% of female respondent don‟t know what is the main reason which affect their decision while they are choosing the electricity supplier and 7.7% of female respondents choose electricity supplier for any other reasons.
0,00% 2,00% 4,00% 6,00% 8,00% 10,00% 12,00% LOW PRICE GOOD SERVICE ENVIRO MENTAL LY FRIENDL Y NO OTHER SUPPLIE R AVAILAB LE OTHER PEOPLE USE THEM DONT KNOW OTHER MALE 8,20% 9,30% 6,20% 4,60% 3,60% 6,70% 8,80% FEMALE 10,80% 7,20% 7,20% 4,10% 3,60% 9,30% 7,70%
GENDER AND WHY THIS
34 MALE
According to the male respondents the main reason for choosing electricity supplier is good service. 9.3% of male respondents choose the good service is the main reason. 8.2% of male respondent answered that the low price is prior when they are choosing electricity supplier. 6.2% of male respondents choose for the reason environmental friendly and 4.6% of them choose due to there is no other supplier available and 3.6% of them choose this electricity supplier since other people use them. 6.7% of male respondents don‟t have idea when they are choosing and 8.8% of male respondents choose for the different reason.
As seen in the figure there is no big difference between sexes when they are choosing the current electricity supplier. Low price is generally prior for the respondent when they are choosing current electricity supplier.
11.1.3 GENDER AND INCOME
FIGUR 19: GENDER AND INCOME
0 0,02 0,04 0,06 0,08 0,1 0,12 0,14 0,16
GENDER AND INCOME
35 FEMALE
According to the income distribution between the gender and 4.1% of female respondents earn less than 10 000kr per month. 10.8% of them earn between 10 001-20 000kr and 14.5% of female respondents earn between 20 001-30 000kr this represents that the majority of female respondents earn in this interval. 7.2% of female respondents earn 30 001-40 000kr and 11.3% of female respondents earn 40 001-60 000kr per month. 1.5% of female respondents earn between 60 001-80 000kr and more than 80.0001kr.
MALE
From the collected data, 1.5% of male respondents earn less than 10 000kr and 8.8% of them earn between 10 20 000kr. The majority of male respondents earn between 20 001-30 000kr every month with 13.9%. Beside these 8.2% and 7.7% of male respondents earn between 30 001-40 000kr and 40 001-60 000kr respectively. 5.1% of male respondents earn between 60 001-80 000kr and 1.0 % of them earn more than 80 001kr.
11.1.4 GENDER AND EXTRA PAYMENT FOR RENEWABLE ENERGY
0,00% 2,00% 4,00% 6,00% 8,00% 10,00% 12,00% 14,00% 16,00% 18,00% 0 1-100KR 101-300KR 301-500KR MORE THAN 501KR NO ANSWER MALE 17,00% 16,00% 5,60% 1,00% 2,00% 5,60% FEMALE 11,90% 15,00% 6,70% 3,10% 1,00% 14,50%
GENDER AND EXTRA PAYMENT FOR
RENEWABLE ENERGY
36 FIGUR 20: GENDER AND EXTRA PAYMENT FOR RENEWABLE ENERGY
FEMALE
The question were asked to respondents to learn that how much can they pay extra money for renewable energy and 11.9% of female respondents said that they are not willing to pay extra money for renewable energy. 15.0% of them are willing to pay extra money between 1-100kr and 6.7% of them said that they can pay between 101-300kr. 3.1% of them are willing to pay extra money between 301-500kr and 1.0% are willing to pay more than 501kr. And 14.5% of female respondents didn‟t answer this question.
MALE
From the survey 17.0% of male respondent are not willing to pay extra money for the renewable energy. In comparison of female respondents are more sensible than male respondent to pay extra money for renewable energy. 16.0% and 5.6% of male respondents are willing to pay between 1-100kr and 101-300kr respectively. 1.0% of male respondents are willing to pay between 301-500kr and 2.0% of male respondents are willing to pay extra money more than 501kr. 5.6% of male respondents didn‟t answer to this question.
In this study again the majority of respondents are price sensible they don‟t want to pay extra money for renewable energy. In this section we can see that number of male respondent is more than female respondents who don‟t want to pay extra money. Moreover 31.0% of respondents are willing to pay extra money between 1-100kr. The rate is changing inside gender. In this section respondent can be grabbed according to the income level which sex group are earning more in which income level and between this income level which sex group are more sensible to pay extra money for renewable energy. For example the rate of the male respondent who want to pay extra money between 1-100kr. According to the analyzed income level correspond to the gender, male respondent are dominant in the 30 001-40 000kr and 60 001- 80 000kr income level. Beside that female respondent are more willing to pay extra money between 101-300kr and 301-500kr and in the income level 10 001-20 000kr, 20 001- 30 00kr and 40 001-60 000kr. This willingness to pay extra money for renewable energy can be matched within the gender in terms of combination of income level.
37
11.2 ANALYZE OF LIVE IN
11.2.1 LIVE IN AND NUMBER OF CHANGES IN SUPLLIER
FIGUR 21: LIVE IN AND NUMBER OF CHANGES IN SUPPLIER
In the study I analyze that number of changes in the electric supplier respect to respondents live in. As I indicated in the finding 67.8 % respondents live in the apartment and 32.1% of them live in the house. I take into account the respondent who changes the electricity supplier.
HOUSE
14.8% of respondents didn‟t change their electricity supplier and 4.2% of respondents changed 1 time. 8.5% of respondents changed 2 times and again 4.2% of respondents changed 3 times.
APARTMENT
The number of change electricity supplier from point of apartment residents can be given as; 31.9% of respondents didn‟t change their electricity supplier and 14.8% of them change 1 time and 12.7% of respondents who live in the house change 2 times. 4.2% of the respondents
0,00% 5,00% 10,00% 15,00% 20,00% 25,00% 30,00% 35,00% 0 1 2 3 4 APARTMENT 31,90% 14,80% 12,70% 4,20% 4,20% HOUSE 14,80% 4,20% 8,50% 4,20% 0,00%
LIVE IN AND NUMBER OF CHANGES IN
SUPPLIER
38 change their electricity supplier 3 times and more than 3 times. After the given number of changes we can focuses on the answers which collected by respondents for choosing curtain electricity provider. The reason behind these changes can be given in following part.
11.2.2 LIVE IN AND REASON FOR CHOOSING CURRENT SUPPLIER
FIGUR 22: LIVE IN AND REASON FOR CHOOSING CURRENT SUPPLIER
From the different perspective I analyzed that the main reason of changing supplier from aspect of house and apartment resident. The respondent who lives in the house or apartment could be changed their electricity supplier for different kind of reasons. The majority of responders change their electricity supplier in the reason of green electricity, price, moving, service and other. This analyze of reason of changing supplier could convey us to the factor which is main reason for choosing the current electricity supplier.
HOUSE
According to the data 1.1% of responders they changed their electricity supplier because of the green electricity reason. 22.2% of respondents indicated that the price. 4.4% of house resident changed their electricity supplier because of the moving to different house, area or
APARTMENT HOUSE LOW PRICE 0 33,30% 22,20% GREEN PRODUCT 0 2,20% 1,10% MOVING 0 22,20% 4,40% SERVICE 0 1,10% 2,20% 0 0,05 0,1 0,15 0,2 0,25 0,3 0,35
LIVE IN AND REASON FOR CHANGING
SUPPLIER
39 city. 2.2% of respondents changed to get better service or could be said they weren‟t satisfied their previous electricity supplier. 3.3% of respondents had changed for different reasons.
APARTMENT
When I analyze respondents who live in apartment, first of all 2.2% of respondents changed their supplier of reason of green electricity. 33.3% of respondents changed due to price. 22.2% and 1.1% of respondents changed because of moving to the other apartment or city or area and service respectively. Finally 7.7% of respondents changed due to the other reasons. The major reason of respondents for changing the electricity supplier could be given price in the total 55.5% for house and apartment residents. This given percentage lead the electricity supplier to think about the price when they are providing electricity to the customer most of changes or choosing the different supplier happened due to the price affect. As seen in the previous figure respondents who live in apartment and house changed their electricity supplier up to 4 times and majority of these changes happen because of the price. From this analyze it may be said that customer can change to use electricity more lower price. On the other hand this is the main reason for choosing the current electricity provider after changing electricity supplier.
11.2.3. LIVE IN AND INCOME
FIGUR 23: LIVE IN AND INCOME
0 0,05 0,1 0,15 0,2 0,25
LIVE IN AND INCOME
APARTMENT HOUSE
40 HOUSE
In this analyze I tried to learn income level of the residents who live in house or apartment and the income level which is counted for each month. According the data 1.0% of respondents who live in house earn less than 10 000kr. 3.6% and 8.2% of respondents earn between 10 0001-20 000kr and 20 001- 30 000kr respectively.4.6% of respondents earn between 30 001-40 000kr and 7.7% of them earn between 40 001-60 000kr. 4.6% of respondents earn between 60 001-80 000kr and 1.0% of them earn more than 80 001kr
APARTMENT
An analyze of the resident of apartment, 4.6% of respondents earn less than 10 000kr. 16.0% and 20.2% of respondents earn between 10 001-20 000kr and 20 001-30 000kr respectively. While 10.8% of respondents earn between 30 001-40 000kr, 11.3% of respondents earn between 40 001-60 000kr. Finally the respondents earn between 60 001- 80 000kr and more than 80 000kr can be give as 2.0% and 1.5%. In this research 2.0% of respondent who live in house or apartment didn‟t answer to this question.
When the analyze combine with the previous two figures which shows number of changes and reason for changing electricity supplier. In this survey since majority of respondents live in apartment and most of them places in the 10 001-20 000kr and 20 001-30 000kr income level and they changes up to 4 times their electricity supplier. This convey us how respondents are sensible and flexible to change their electricity supplier if they are uncomfortable for the price. In this point the electricity supplier should focus on the price it can be main reason when customers choose or change their electricity supplier.
41
11.3 OCCUPATION
11.3.1 OCCUPATION AND WHY CHOOSE
FIGUR 24 :OCCUPATION AND WHY CHOOSE
Analyze of the why choose according to occupation shows us the relation between which group of the occupation is more sensible when they are choosing certain electricity provider.
STUDENT
First of all 3.8% of student respondents choose their certain electricity provider for the social responsibility.4.3% of them choose due to the low price and 1.0% of student respondents are sensible about the greenest product when they are choosing their certain electricity provider.
EMPLOYED
12.5% of employed respondents take account into social responsibility when they are choosing their certain electricity provider and 33.3% of employed respondents think about the
0,00% 5,00% 10,00% 15,00% 20,00% 25,00% 30,00% 35,00%
LOW PRICE SOCIAL RESPONSIB ILITY INNOVATI ONS GREENEST PRODUCTS OTHER REASON STUNDET 4,30% 3,80% 0% 1,00% 0,00% EMPLOYED 33,30% 12,50% 6% 9,20% 0,50% SELF-EMPLOYED 10,20% 2,70% 3,20% 0,50% 0% RETIRED 4,30% 2,10% 0% 1,60% 0% OTHER 2,10% 1,00% 0% 0% 0%
42 low price while choosing certain electricity provider. 9.2% and 6.0% of employed respondents choose the company in consideration of the green product and innovations respectively. 0.5% of them didn‟t answer this question.
SELF EMPLOYED
According to the self employed, 2.7% of them choose certain electricity provider in the reason of social responsibility. 10.2% of self-employed chose certain electricity provider because of low price. 3.2% and 0.5% of self employed choose certain electricity provider for the reason of innovation and greenest products respectively.
RETIRED
While 2.1% of retired respondents choosing certain electricity provider according to the social responsibility reason, 4.3% of retired respondents chose because of low price.1.6% of retired respondents chose the company in the consideration of greenest products.
OTHER
1.0% of the respondents who aren‟t belonging to the given occupation chose their electricity supplier for the social responsibility reason and 2.1% of respondents chose due to low price. As seen in the figure 24 low price is the main reason for the respondent who has been divided according to the occupation. In this part many respondents take place in the employed section and in the comparison of the reason the low price is strongly dominant between other reasons. This is the only case which is low price main reason why they are choosing certain electricity provider for all group. In the collaboration with the previous figure which is occupation and live in it is shown majority of the respondents live in the apartment and it may provide a result that apartment residential more sensible to the price than other factors. This condition is valid for student but it is not as much as employed do. From the figure students are more sensible in terms of social responsibility. Social responsibility slightly lower than low price which shows new generation or on the other hand who get education in the present which may convey them to take care of the environment more.
43 11.3.2 OCCUPATION AND EXTRA
FIGUR 25: OCCUPATION AND EXTRA
STUDENT
In this section I analyze the willingness to pay for the renewable energy correspond to the occupation.
According to the data 2.0% student respondents are not willing to pay extra money for renewable energy. On the other hand another 2.0% of student respondents are willing to pay extra money between 1-100kr. 1.5% of student respondents are willing to pay between 101-500kr. 0,5% of student respondents are willing to pay extra money more than 501kr 1.5% of retired respondents didn‟t answer to this question.
EMPLOYED
17.7% of employed respondents are not willing to pay extra money for renewable energy. 22.3% and 6.5% of employed respondents are willing to pay extra money between 1-100kr and 101-300kr respectively.1.0% of them are willing to pay extra money between 301-500kr and 1.5% of employed respondents could pay extra money more than 501kr. 13.0% of retired respondents didn‟t answer to this question.
0,00% 5,00% 10,00% 15,00% 20,00% 25,00% 0 0-100KR 101-300KR 301-500KR MORE THAN 501KR NO ANSWER STUNDET 2,00% 2,00% 2% 0,50% 0,00% 1,50% EMPLOYED 17,70% 22,30% 7% 1,00% 1,50% 13,00% SELF-EMPLOYED 5,70% 4,60% 3,60% 0,50% 0% 2,60% RETIRED 2,60% 1,50% 0,50% 0,50% 0% 2,60% OTHER 1,40% 0,50% 0,50% 0,50% 0,50%
44 SELF EMPLOYED
5.7% of self employed respondents indicated that they are not willing to pay extra money for renewable energy and 4.6% of self employed respondents could pay extra money between 1-100kr. 3.6% and 0.5% of self employed respondents are willing to pay extra money for renewable energy between 101-300 and 301-500kr respectively. 2.6% of self employed respondents didn‟t answer to this question.
RETIRED
According to data 2.6% retired respondents are not willing to pay extra money for renewable energy.1.5% of retired respondents are willing to pay more between 1-100kr and 0.5% of retired respondents could pay extra money between 301-500 and more than 501kr.2.6% of retired respondents didn‟t answer to this question.
OTHER
1.4% of the respondents who don‟t participate one of this given group are not willing to pay extra money for renewable energy and for each group which is 1-100,101-300,301-500 and more than 501kr 0.5% of respondents are willing to pay extra money.
According to the figure occupation and extra money for renewable energy, every good group includes that most of respondents don‟t want to pay extra money for green energy. When we look at the different view of point there are respondents who want to pay extra money in different amounts. This willingness to pay can be analyzed according to the income level of the occupation group and green energy can be provided for reasonable price. For example mostly employed respondents earn between 20 001-30 000kr and 40 001-60 000kr and they are willing to pay extra money between 1-100kr so the supplier should not exceed this interval when they are providing the green energy in the consideration of the employed. Since in every group some of respondents are willing to pay extra for green energy, it shows that in all the groups many respondents are taking care of the environment and at least they can pay for this reason. As seen in the figure there is still missing part who doesn‟t know whether they can pay extra money or not. Since big part of this group exist in the employed section with a consideration they can pay extra for the green energy and they should grabbed by giving information about green energy and its benefits.
45 11.3.3 OCUPATION AND WHY THIS
FIGUR 26: OCCUPATIONAND WHY THIS
In this part I analyze the relation between occupation and main reason for choosing the current electricity supplier.
STUDENT
1.0% of student responders chose their current electricity supplier due to low price. 1.5% and 0.5% of student respondents choose the current supplier for the reason of good service and no other supplier available respectively. 2.1% of student respondents don‟t know why they chose their current electricity supplier.
EMPLOYED
11.0% employed respondents choose electricity supplier in terms of low price. 10.5% and 6.8%of employed respondents chose because of good service and since it is environmentally friendly respectively. 7.3% of employed respondent choose because of there is no other supplier available and 3.6% of employed respondents choose because of other people use this supplier. While 11.0% of employed respondents don‟t know why they choose their current
0,00% 2,00% 4,00% 6,00% 8,00% 10,00% 12,00% LOW PRICE GOOD SERVICE S ENVIRO MENTA LLY FRIEND LY NO OTHER SUPPLIE R AVAILA BLE OTHER PEOPLE USE THEM DONT KNOW OTHER STUNDET 11,00% 10,50% 7,30% 7,30% 3,60% 11,00% 11,50% EMPLOYED 11,00% 10,50% 6,80% 7,30% 3,60% 11,00% 11,50% SELF-EMPLOYED 3,10% 3,10% 2,10% 3,10% 1,50% 1,50% 2,10% RETIRED 2,10% 1,00% 1,50% 0,50% 0,50% 1,00% 1,50% OTHER 1,50% 1,50% 1,50% 1,50% 1,50% 0,50% 0%